Article
J. Braz. Chem. Soc., Vol. 25, No. 9, 1552-1564, 2014. Printed in Brazil - ©2014 Sociedade Brasileira de Química 0103 - 5053 $6.00+0.00
A
*e-mail: [email protected]
Discrimination of Black Pen Inks on Writing Documents Using Visible Reflectance
Spectroscopy and PLS-DA
Verônica A. G. da Silva,a Márcio Talhavini,b Jorge J. Zacca,b Bruno R. Trindadeb and Jez W. B. Braga*,a
aInstitute of Chemistry, University of Brasília, PO Box 4478, 70904-970 Brasília-DF, Brazil
bNational Institute of Criminalistcs, Brazilian Federal Police, SAIS Quadra 07 Lote 23,
70610-200 Brasília-DF, Brazil
A análise de tintas é realizada para verificar a ocorrência de falsificações em documentos. Nesse aspecto, métodos espectroscópicos são atrativos, pois preservam a integridade do documento. Neste trabalho, é proposto um método para a discriminação de tintas de canetas pretas entre tipos, marcas e modelos para a aplicação em documentos. Espectros de reflectância na região visível foram obtidos através do equipamento comparador espectral de vídeo VSC®6000 e da
análise discriminante por mínimos quadrados parciais (PLS-DA). O método foi validado com dados independentes e um teste cego. O viés presente nos resultados foi corrigido para a detecção das amostras anômalas. Os modelos PLS-DA apresentaram baixos erros médios quadráticos de previsão (RMSEP) e permitiram a discriminação de todas as tintas de forma rápida, não destrutiva e eficiente. O método se mostrou exato e robusto com respeito a escrita de diferentes indivíduos e capaz de identificar o tipo, a marca e o modelo de caneta em um caso forense.
The analysis of inks is performed to verify the occurrence of forgery in documents. Spectroscopic methods are attractive techniques for use in forensic document analysis as they, in most instances, preserve the integrity of the document. In this work, it is proposed a discrimination method of black pen inks of different types, brands and models for application in cursive handwriting. The visible reflectance spectra was obtained by the video spectral comparator VSC®6000 and
discrimination analysis performed by partial least squares (PLS-DA). The method was validated with an independent test set and with a blind test. The bias in the results was corrected for the outlier identification. The PLS-DA models presented low root mean squared error of predictions (RMSEPs) and allowed a fast, non-destructive and anefficient discrimination of all pen inks evaluated. The method has proved to be accurate and robust regarding the handwriting of different individuals and capable of identifying the pen type, brand and pen model in a forensic case.
Keywords: black ink pen, questioned documents, video spectral comparator, PLS-DA, forensic
Introduction
The analysis of inks, papers and their interactions, has been an important area of study in forensic science. Its
main objective is to verify the adulterations in documents.1,2
Usually, document analysis involves examination of pen
ink entries in orderto investigate if the same instrument
was used in two or more releases in manuscripts, which are commonly related to changes or additions to a
document in forensic cases.1-3 Furthermore, it should be
pointed out that in the forensic analysis of documents the
integrity of the collected evidence should be preserved whenever possible. Thus, a destructive analysis should be performed only if a non-destructive method is not available to solve the case. However, the variety of materials used in the ink manufacture, the possible contamination of the surface where the ink was applied and chemical changes in the document make this analysis a complex analytical
problem.2-5
On the other hand, pigments are finely ground to produce multi-molecular granules insoluble in the vehicle. The vehicle composition affects the fluidity and the drying characteristics of the ink. It is usually composed of oils, solvents and resins. Other substances may be used to adjust the characteristics of the ink, such as driers, plasticizers,
waxes, greases and surfactants (soaps and detergents).1-5
Many works have been published aiming to propose and optimize methodologies for analyzing inks on documents,
thus,a significant number of papers have been dedicated
to studies involving the analysis of pen inks.6-11 Bell et al.7 compared the results obtained by Raman, surface-enhanced Raman spectroscopy (SERS), video spectral comparator
model 2000 (VSC®2000) and thin layer chromatography
(TLC) for analysis of 26 different pen inks on questioned documents. The results demonstrated that in many cases the discrimination power of Raman was better than the
standard visual technique using VSC®2000. Zieba-Palus
and Kunicki investigated micro-Fourier transform infrared spectroscopy (micro-FTIR), Raman spectroscopy and X-Ray fluorescence (XRF) method to study the composition
of inks for blue and black ballpoint and gel pens.8 The
authors concluded that micro-FTIR provides satisfactory information for the analysis of the ink composition, but the most complete information is obtained only when the
three techniques are combined. Causin et al.9 tested the
discriminant power of UV-Vis, FTIR spectroscopy and TLC techniques in forensic analysis of 33 inks from blue and black ballpoint pens of different models. The authors observed a different discriminant power for blue and black inks and argue that the best results are obtained through the joint observation of all the techniques evaluated.
Wilson et al.10 used different instrumental techniques
(VSC®2000, liquid chromatography (LC), luminescence
and infrared reflectance, TLC and gas chromatography with mass spectrometry detection (GC-MS)) for the discrimination of inks from gel and rollerball black pens. From the 29 inks studied, the authors showed that it was possible to differentiate 19 groups and propose a flow chart to determine whether an ink release in a document is compatible with a gel or a rollerball pen. Other techniques applying mass spectrometry were also proposed for
document analysis.12-18 However, most of these techniques
present a high cost, usually require the sampling/destruction of part of the document and are usually not available for all forensic laboratories.5
The application of spectroscopy techniques associated with multivariate analysis has proved to be able to solve
different problems in forensic science.19-29 However,
there are only few studies applying chemometrics and
spectroscopy for analysis of black ink pens.25,26 Therefore,
despite the papers published in the literature, there is still a lack of studies that prove the efficiency of chemometric models, such as partial least squares for discriminant analysis (PLS-DA), to discriminate pen inks applying non-destructive measurements directly in writing documents.
Thus, in order to propose a non-destructive method that fulfills the requirements for forensic applications, this study aims to propose a method that can be applied to discriminate a significant number of black inks from different types and brands of pens by the analysis of handwriting traces by
visible reflectance measurements obtained with a video
spectral comparator, VSC®6000 (Foster and Freeman)
associated with PLS-DA.30 Furthermore, the correction
of bias in PLS-DA results to enable outlier detection is described. The proposed method was applied to the discrimination of 55 different classes of black pen and validated by independent samples, blind testing as well as applied to a forensic casework.
Experimental
Description of the samples
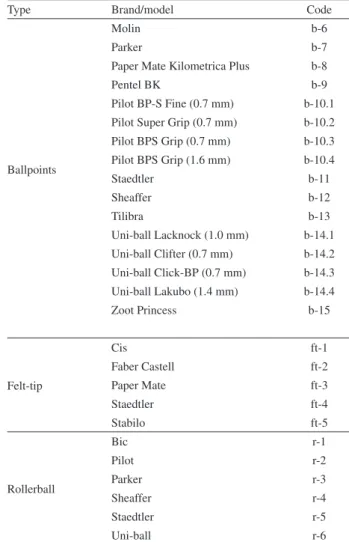
The set of inks studied was composed of 55 different classes of pens, all black color, divided into six different
types, brands and models, according to the detailed
description presented in Table 1. The samples were purchased at local markets in Brasília, Distrito Federal, Brazil. The pen brands and models were selected in order to cover the most used ones in Brazil, which consequently are the most used in document writings.
The standard samples were produced on white paper
(Chamex brand), A4 size and 75 g m-2. For each brand/
model were used three pens from different pen batches in order to introduce in the model the variability inside the same brand. Furthermore, for each pen, three ink strokes
were produced on the mentionedpaper, simulating cursive
handwriting. After a 24 hour drying period, all samples were placed in plastic bags and stored in a closet protected
from light in orderto avoid ink degradation.
Video spectral comparison analysis
The video spectral comparator model 6000 (VSC®6000)
is an equipment employed as an auxiliary tool by experts
in forensic investigations. The VSC®6000 consists of
at focused regions in the document. All reflectance
measurements were obtained using VSC®6000, located
at the document examination laboratory of the National Institute of Criminalistics, Brazilian Federal Police.
After the optimization of the instrumental conditions, all spectra were acquired in the range of 400 to 1000 nm, with 1 nm resolution (600 variables), 11.8 times magnification, integration time at 300 ms and diaphragm at 60%. The blank spectra (background) (Figure 1a) were obtained
usinga clean paper surface without ink. The reflectance
spectra were acquired along each writing line in different positions without repetition, such that all spectra included the contributions from both ink and paper. It is important to note that before the development of the discrimination models the reflectance spectra were converted to log(1/R) scale, where R is the reflectance. In order to perform the spectra acquisition, the sheets containing the standards or real documents were placed in the main unit of the
VSC®6000 (Figure 1) and the area of interest (the region
containing the ink) was selected.
For each ballpoint pen brands a total of eighty spectra were acquired, whereas for the other types of pen brands only a total of sixty spectra were acquired. The different numbers of spectral measurements performed for each type of pens were caused by
instrumental limitations with the VSC®6000 located at the
Document Analysis Laboratory of the National Institute of Criminalistics.
Mass spectroscopy analysis
The mass spectrometry measurements were performed using a time-of-flight LC-mass spectrometer system (LC/MS-TOF) (Agilent Technologies). Small samples of each standard sample were solubilized in 1% formic acid in methanol solution. The instrument calibration was carried out with the ink obtained from a blue ballpoint pen (Bic Cristal) with a known dye composition. The calibration signals were acquired in the positive mode for the ions 327 and 358 m/z.
Table 1. List of the black ink pens studied according to type, brand and model
Type Brand/model Code Type Brand/model Code
Ballpoints
Acrilex b-1
Ballpoints
Molin b-6
Bic Cristal (1.0 mm) b-2.1 Parker b-7
Bic Cristal (0.8 mm) b-2.2 Paper Mate Kilometrica Plus b-8
Bic Cristal (1.2 mm) b-2.3 Pentel BK b-9
Bic Cristal (1.6 mm) b-2.4 Pilot BP-S Fine (0.7 mm) b-10.1
Bic Diamante b-2.5 Pilot Super Grip (0.7 mm) b-10.2
Bic Atlantis b-2.6 Pilot BPS Grip (0.7 mm) b-10.3
Bic Cristal pocket b-2.7 Pilot BPS Grip (1.6 mm) b-10.4
Bic Eco solutions b-2.8 Staedtler b-11
Cis RT-Grip (1.0 mm) b-3.1 Sheaffer b-12
Cis Silver stick (1.0 mm) b-3.2 Tilibra b-13
Cis Speed (1.0 mm) b-3.3 Uni-ball Lacknock (1.0 mm) b-14.1
Cis Prime (1.0 mm) b-3.4 Uni-ball Clifter (0.7 mm) b-14.2
Cis NeoTip (1.0 mm) b-3.5 Uni-ball Click-BP (0.7 mm) b-14.3
Cis Tekball (1.0 mm) b-3.6 Uni-ball Lakubo (1.4 mm) b-14.4
Compactor Economic (1.0 mm) b-4 Zoot Princess b-15
Faber Castell (1.0 mm) b-5 Erasable Paper Mate, Erasable e-1
Felt-tip
Cis ft-1
Fountain Zoot, Dakota f-1 Faber Castell ft-2
Gel
Faber Castell g-1 Paper Mate ft-3
Molin g-2 Staedtler ft-4
Pentel g-3 Stabilo ft-5
Tilibra g-4
Rollerball
Bic r-1
Uni ball g-5 Pilot r-2
Cis g-6 Parker r-3
Pelikan g-7 Sheaffer r-4
Gelstick g-8 Staedtler r-5
Development of the discrimination models
The discrimination models were developed based on the
PLS-DA.31-34 In PLS-DA modeling samples are discriminated
into two distinct classes: (class 1) the samples belonging to the interest class and (class 0) the samples belonging to any other class, as illustrated in Figure 1d. PLS-DA is a regression
method where the dependent variable is a vector (y) that can
assume the values of 0 or 1 and indicates the class in which a sample belongs. It is expected that if a given sample i belongs to the interest class the value of yiwill be approximately equal
to 1; otherwise, if a given sample i does not belong to the
interest class the value of yi will be approximately equal to
zero. Therefore, the estimated values in y are approximations
of 0 or 1 and a good discrimination is obtained when the distributions of the estimates of the samples belonging to classes 1 and 0 are not overlapped. It is important to note that in most applications of PLS-DA, a specific model is developed for each interest class.32-34
In model development, the spectra acquired for each pen type, brand and model were randomly split into a calibration dataset, containing 60% of the spectra, and a validation dataset, containing 40% of the available spectra for each pen type/brand/model. Different pre-processing methods were tested, such as first derivative Savitzky-Golay, orthogonal signal correction (OSC), multiplicative scattering correction (MSC), and standard normal variate (SNV). The best pre-processing method and the number of latent
variables used in the PLS-DA models were chosen based on the specificity (selectivity) values. Furthermore, in order to obtain models with small occurrence of discrimination errors and absence of overfitting the lowest root mean square error of cross validation (RMSECV), obtained by leave-one-out cross-validation and accounting the amount of explained variance, were also used as optimization parameters.
Outlier detection
Outliers can be defined as samples showing some type of different behavior when compared to the bulk of the data. Their occurrence in the calibration step usually impairs model development such that outlier identification and elimination is one of the most important steps in model
development.35 Outlier detection methods have already
been described in several papers.35-38 In this work, outlier
identification was performed according to ASTM E1655-05 which is based on Hotelling’s (T2) statistics, Q statistics and
high Student residuals in estimated values (y), taking into
account 95% confidence intervals.35
It is important to note that the model performance and the identification of outliers in PLS-DA may be highly impaired by the occurrence of bias in the estimated results for the class values (estimates for y). Therefore, in order to prevent this influence in the outlier identification regarding high errors in y, the procedure described in ASTM E1655-05 was adapted for bias correction in PLS-DA results by the Figure 1. Scheme of VSC®6000 spectra acquisition. (a) Examples of the sampled areas used for background and ink spectral measurements; (b) VSC®6000
estimation of the mean bias in calibration samples for each class (biasclass0 and biasclass1) in the calibration samples, as
described in equations 1 and 2, respectively:35
(1)
(2)
where , , ycal1,i and ycal0,i are the estimated and the
reference values for calibration sample i in classes 1 and
0, respectively, and n0 and n1 are the number of samples
in each class. After the estimation of the average bias, the
corrected RMSE for the calibration dataset (RMSECbias)
can be estimated as:
(3)
where n is the number of all samples of the calibration set
and VL the number of latent variables of the PLS-DA model.
It is important to mention that when the class sample i is 0,
the bias term of equation 3 is equal to biasclass0. Otherwise, if the sample belongs to class 1, biasclass1 is used in equation 3.
Finally, samples presenting high prediction errors in y
were identified by Student’s t-test for residuals suggested by ASTM E-1655-05, which takes into account the correction
for bias by equation 4.35
(4)
where ei, and hi are the residual and leverage estimated
for the sample i, respectively, and the bias term is equal to
biasclass0 or biasclass1 depending on the class of the sample i.
Samples were considered outliers regarding high y residuals
if the estimated value for ti waslarger than the reference
t-value of the t-Student distribution with n-VL-2 degrees
of freedom and 99% of confidence.
Model optimization related to outliers was accomplished according to the following procedure: (i) an initial calibration model was built with the pre-processed data and the outliers
were removed from the calibration samples; (ii) the model
was recalculated and the process of outlier identification and
elimination was repeated; (iii) after these two exclusions,
the third model was considered as optimized. After the calibration set optimization, the validation set was evaluated with the optimized calibration model. The identification of
outliers in the validation samples was performed with the same criteria used in the calibrations samples.
Software
The spectral data were imported to Matlab® (version
7.12, R2011a) and both pre-processing and PLS-DA models
were performed using the PLS Toolbox® (version 6.5) from
Eigenvector Technologies.39 Bias correction and outlier
identification were performed with routines written in
Matlab® in our research laboratory.
Discrimination of black pen inks between different types, brands and models
In order to obtain the best discrimination results, the
PLS-DA models were developed in three different stages.
In the first one, pen inks were discriminated according
to their types. Therefore, in this stage 6 PLS-DA models were developed to discriminate the types: erasable pen (1 brand), ballpoint (15 brands), felt-tip (5 brands), rollerball (6 brands), gel (9 brands) and fountain (1 brand).
In the second stage, different brands of pens belonging to the same type were discriminated. Therefore, as presented in Table 1, 37 distinct PLS-DA models were developed.
The discrimination of the pen inks by type and brands was performed considering just 37 of the 55 pen models listed in Table 1, since just one pen model of each brand was introduced in the discriminant analysis by type and brands. In this sense, when a ballpoint brand in Table 1 presents more than one model, just the first pen model was introduced in this discrimination by type and brands. Furthermore, the total number of spectra obtained for this dataset was: 60, 1200, 60, 540, 300 and 360 for erasable, ballpoint, fountain, gel, felt-tip and rollerball, respectively. Consequently, the dataset used for discrimination by type and brands was composed of 2520 spectra, which was split into 1680 and 840 calibration and validation spectra, respectively.
The third stage was used to discriminate different pen models within the same brand. In this stage, only ballpoint pens were evaluated: 8 PLS-DA models were developed for Bic, 6 for Cis, 4 for Pilot and 4 for Uni-ball. In addition, for these models only 60 spectral measurements were obtained for each pen model, totaling 1320 spectral measurements in each PLS-DA model. The total number of spectra was split into 880 and 440 calibration and validation spectra, respectively.
Classification regarding the type, brand and pen model was made based on the estimated class value obtained by the specific PLS-DA model and the discrimination thresholds
estimated class value presents a value higher than the
discrimination threshold of the specific PLS-DA model,
the sample is classified as belonging to the discriminated class (type, brand and pen model). Otherwise, the sample belongs to another class.
Validation of the discrimination models with a blind test
A blind test was conducted in order to evaluate the
effectiveness of discrimination in samples produced by different individuals and pens randomly chosen by each volunteer. In order to make the study bias free, the expected measurement outcomes as well as volunteer identities were not revealed to the analyst.
Blind test analysis was divided into two steps. Firstly, six volunteers had at their disposal 15 brands of black ballpoint pen used in the model development and two pens were chosen by each volunteer. Afterwards, two sheets of blank paper were given to each volunteer. On the first sheet the volunteer´s name, chosen pens and the sequence of pen releases were registered. On the second sheet, each non-identified volunteer only wrote the word
“DOCUMENT” usingeach chosen pen. At the end, the
volunteer gave the two sheets to the blind test coordinator. The first sheet of paper was stored for subsequent conference and the second one was coded and sent for analysis.
In a second step, for each encoded sheet twenty spectral measurements were acquired from each word written by the volunteers and the subsequent PLS-DA analysis was performed.
Application of the proposed method in a real forensic case
The method was applied to elucidate a real case in the Document Analysis Laboratory of the Brazilian National Institute of Criminalistics. Six pages from a questioned document were analyzed with the proposed method. The questioned document presented a contract containing signatures in different pages made with black ink pen. The signatures were questioned about their authenticity. For
each document page, VSC®6000 background spectrum was
obtained on a clean paper surface (without ink) and twenty spectra were acquired on different portions of each signature. Afterwards, these spectra were analyzed with all PLS-DA models previously developed in order to identify the type and brand of the pens used in each signature. The dispersion of the estimated class values obtained on two sections of a same page as well as on sections coming from different
pages were analyzed in the PLS-DA models in orderto
conclude if the ink present in the signatures belonged to the same pen type and brand. The brand/model of the pen used
in a specific page was identified when the estimated class values obtained were above of the discrimination threshold at the PLS-DA model for this brand/model. The similarity or dissimilarity of the ink in a document was determined after the identification of the pen brand/model by the agreement or disagreement of the estimated class values obtained in the pages analyzed, respectively.
Results and Discussion
Spectroscopy data
Figure 2a presents the ink spectra for all calibration samples, before and after applying the pre-processing methods (Savitzsky-Golay using a second-order polynomial and an eleven point window and mean centering) obtained in the range of 400-1000 nm. It may be observed that different spectral profiles are present in the data, which indicate that this spectral region presents useful information for ink discrimination. However, considering that Figure 2a presents 33 distinct classes (brands and pen models) of ballpoint pen and 22 classes of other types of pens, it is important to notice that the visual analysis by itself does not allow the safe discrimination between the different types and brands of pen. In Figure 2b, the spectra for the 33 ballpoint pen brands studied are presented. In this case, it is possible to observe that some of the classes present a very similar spectroscopic profile.
In both cases, it may be observed that the ink spectra present systematic baseline variation. In order to correct this effect, several types of pre-processing have been tested. The best results were obtained using a combination of orthogonal signal correction (OSC), first spectra derivative (Savitzsky-Golay using a second-order polynomial and an eleven point window) and mean centering.
Discrimination of black ink pens by type
In all PLS-DA models, the entire spectra were used,
number of outliers were excluded in both calibration and validation steps.
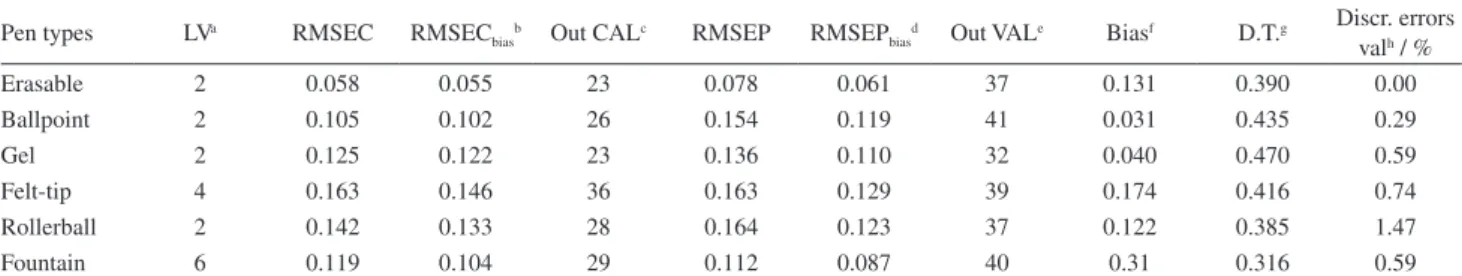
It can also be observed in Table 2 that low prediction errors were obtained and the models did not present any overfitting, since the RMSEC values did not show a significant difference in relation to the RMSEP values. The values of RMSEP, after the bias correction, varied between 0.061 and 0.129. In addition, comparison of the RMSEC and RMSEP values before and after bias correction shows that the largest bias occurred for the discrimination of the fountain pen type, where a bias in the discriminated class (fountain samples) of 0.310 was observed. This value was obtained by subtracting the mean estimated class value from the fountain class in the calibration samples from its expected class value (1 – 0.690).
Figure 3a shows the distribution of class values estimated for the calibration and validation sets used in the discrimination of erasable pens related to all other types. Figure 3b shows the same situation in the case of ballpoint pen type. In both cases, all samples present a clear separation according to their characteristics, and no misclassification was observed. All the remaining pen types presented a similar separation as the one observed in Figure 3.
Discrimination of black inks pens of different brands within the same pen type
Table 3 presents RMSEC and RMSEP values obtained with the optimized PLS-DA models for the discrimination Figure 2. Absorbance spectra before applying the pre-processing methods. (a) Complete data set of all 55 types and brands of pens studied; (b) complete data set for all 33 ballpoint classes studied; (c) pre-processed spectra of the data set of all 55 types and brands of pens studied; (d) pre-processed spectra of the data set for all 33 ballpoint classes studied.
Table 2. Results of the mean prediction errors and model parameters for the discrimination per type
Pen types LVa RMSEC RMSEC
biasb Out CALc RMSEP RMSEPbiasd Out VALe Biasf D.T.g
Discr. errors valh / %
Erasable 2 0.058 0.055 23 0.078 0.061 37 0.131 0.390 0.00
Ballpoint 2 0.105 0.102 26 0.154 0.119 41 0.031 0.435 0.29
Gel 2 0.125 0.122 23 0.136 0.110 32 0.040 0.470 0.59
Felt-tip 4 0.163 0.146 36 0.163 0.129 39 0.174 0.416 0.74
Rollerball 2 0.142 0.133 28 0.164 0.123 37 0.122 0.385 1.47
Fountain 6 0.119 0.104 29 0.112 0.087 40 0.31 0.316 0.59
aLatent variable number; bRMSEC
bias: root mean square error of calibration with bias corrected; cnumber of outliers in the calibration set; dRMSEPbias:
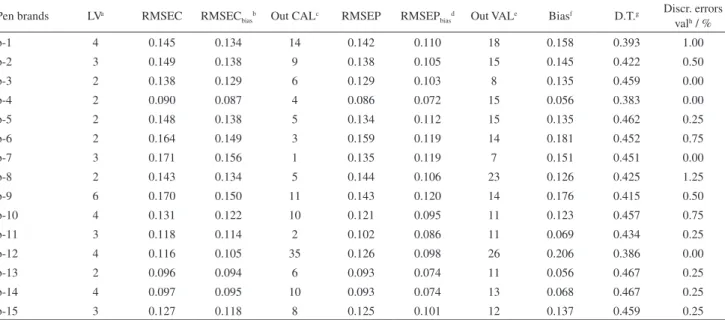
of the 15 ballpoint pen brands under study. The models presented low prediction errors, which enabled the correct discrimination of all pen brands studied. The number of outliers indentified in both calibration and validation samples were relatively low and a small bias was observed in the results. It is important to note that even if the outliers in the validation set were not excluded, the discrimination errors are very low. Table 3 shows that the largest discrimination error in the validation set before the exclusion of outliers was 1.25%, which proves the high accuracy of the method.
Figure 4 illustrates the calibration and validation dataset distribution of estimated class values for one of the discriminated brands corresponding to the ballpoint, gel, felt-tip and rollerball pen types. A clear separation in all
situations can be observed. A comparison of Figures 4a-4d allows the bias effect visualization in the estimated results. A higher bias may be observed in Figure 4a, since the mean of all calibration samples of the brand b-2.1 is 0.855 (bias = 0.145). For the other plots in Figure 4, an average value closer to 1 is observed. However, it is important to note that the bias in the results in Figure 4a was not sufficient to cause any misclassification. The utilization of discrimination thresholds allows the visualization of the classification efficiency of PLS-DA models for the black
ink pens analyzed with VSC®6000. For all other brands,
similar results were achieved, as it can be observed by the prediction errors, bias and discrimination thresholds presented in Tables 3 and 4.
Table 3. Results for the mean prediction errors and discrimination parameters for the ballpoint ink pens
Pen brands LVa RMSEC RMSEC
biasb Out CALc RMSEP RMSEPbiasd Out VALe Biasf D.T.g
Discr. errors valh / %
b-1 4 0.145 0.134 14 0.142 0.110 18 0.158 0.393 1.00
b-2 3 0.149 0.138 9 0.138 0.105 15 0.145 0.422 0.50
b-3 2 0.138 0.129 6 0.129 0.103 8 0.135 0.459 0.00
b-4 2 0.090 0.087 4 0.086 0.072 15 0.056 0.383 0.00
b-5 2 0.148 0.138 5 0.134 0.112 15 0.135 0.462 0.25
b-6 2 0.164 0.149 3 0.159 0.119 14 0.181 0.452 0.75
b-7 3 0.171 0.156 1 0.135 0.119 7 0.151 0.451 0.00
b-8 2 0.143 0.134 5 0.144 0.106 23 0.126 0.425 1.25
b-9 6 0.170 0.150 11 0.143 0.120 14 0.176 0.415 0.50
b-10 4 0.131 0.122 10 0.121 0.095 11 0.123 0.457 0.75
b-11 3 0.118 0.114 2 0.102 0.086 11 0.069 0.434 0.25
b-12 4 0.116 0.105 35 0.126 0.098 26 0.206 0.386 0.00
b-13 2 0.096 0.094 6 0.093 0.074 11 0.056 0.467 0.25
b-14 4 0.097 0.095 10 0.093 0.074 13 0.068 0.467 0.25
b-15 3 0.127 0.118 8 0.125 0.101 12 0.137 0.459 0.25
aLatent variable number; bRMSEC
bias: root mean square error of calibration with bias corrected; cnumber of outliers in the calibration set; dRMSEPbias:
root mean square error of prediction with bias corrected; enumber of outliers in the validation set; fBias: systematic bias; gD.T.: discrimination threshold; hdiscrimination errors in the validation set before the exclusion of outliers.
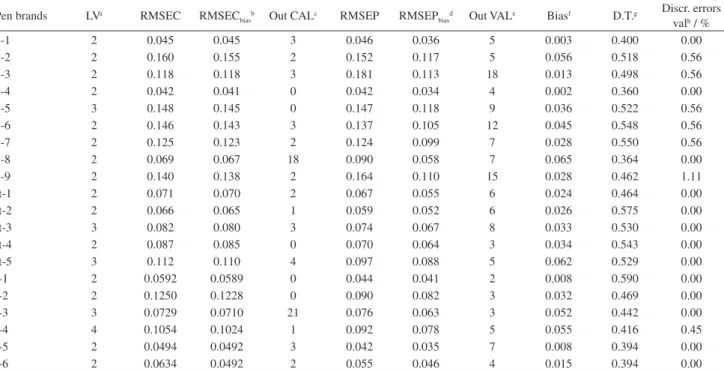
Table 4. Results for the mean prediction errors and discrimination parameters for the non-ballpoint ink pens:gel, felt-tip and rollerball
Pen brands LVa RMSEC RMSEC
biasb Out CALc RMSEP RMSEPbiasd Out VALe Biasf D.T.g
Discr. errors valh / %
g-1 2 0.045 0.045 3 0.046 0.036 5 0.003 0.400 0.00
g-2 2 0.160 0.155 2 0.152 0.117 5 0.056 0.518 0.56
g-3 2 0.118 0.118 3 0.181 0.113 18 0.013 0.498 0.56
g-4 2 0.042 0.041 0 0.042 0.034 4 0.002 0.360 0.00
g-5 3 0.148 0.145 0 0.147 0.118 9 0.036 0.522 0.56
g-6 2 0.146 0.143 3 0.137 0.105 12 0.045 0.548 0.56
g-7 2 0.125 0.123 2 0.124 0.099 7 0.028 0.550 0.56
g-8 2 0.069 0.067 18 0.090 0.058 7 0.065 0.364 0.00
g-9 2 0.140 0.138 2 0.164 0.110 15 0.028 0.462 1.11
ft-1 2 0.071 0.070 2 0.067 0.055 6 0.024 0.464 0.00
ft-2 2 0.066 0.065 1 0.059 0.052 6 0.026 0.575 0.00
ft-3 3 0.082 0.080 3 0.074 0.067 8 0.033 0.530 0.00
ft-4 2 0.087 0.085 0 0.070 0.064 3 0.034 0.543 0.00
ft-5 3 0.112 0.110 4 0.097 0.088 5 0.062 0.529 0.00
r-1 2 0.0592 0.0589 0 0.044 0.041 2 0.008 0.590 0.00
r-2 2 0.1250 0.1228 0 0.090 0.082 3 0.032 0.469 0.00
r-3 3 0.0729 0.0710 21 0.076 0.063 3 0.052 0.442 0.00
r-4 4 0.1054 0.1024 1 0.092 0.078 5 0.055 0.416 0.45
r-5 2 0.0494 0.0492 3 0.042 0.035 7 0.008 0.394 0.00
r-6 2 0.0634 0.0492 2 0.055 0.046 4 0.015 0.394 0.00
aLatent variable number; bRMSEC
bias: root mean square error of calibration with bias corrected; cnumber of outliers in the calibration set; dRMSEPbias:
root mean square error of prediction with bias corrected; enumber of outliers in the validation set; fBias: systematic bias; gD.T.: discrimination threshold; hdiscrimination errors in the validation set before the exclusion of outliers.
Discrimination of black ink pens of different models in the same brand
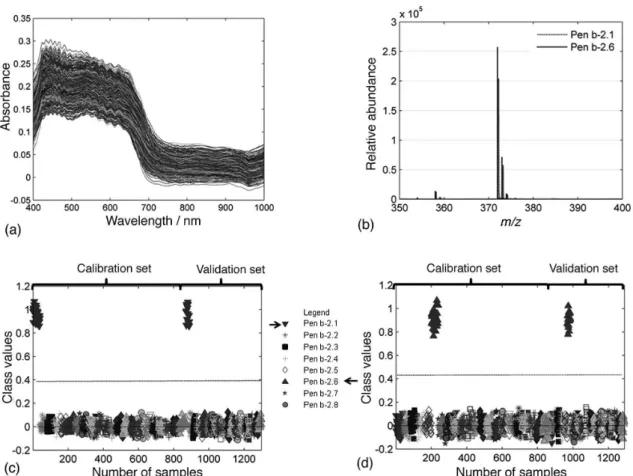
Figure 5a shows the spectroscopy measurements in absorbance scale obtained for all different pen models evaluated for the same brand b-2 (Bic). It can be observed, by simple visual inspection, that all pens present a very similar spectral profile. Figure 5b shows the overlay of the mass spectra obtained for the pen models Bic Cristal (b-2.1) and Atlantis (b-2.6), which reveals that there is only a small difference in mass signals relative to the dyes present in the ink pens of the same brand studied. As presented in Figure 5b, the mass spectra show differences in the chemical composition of ink pens of same brand in different models. Similar results were observed for other brands and pens models studied.
Figures 5c and 5d present the calibration and validation PLS-DA dispersion graphics for the discrimination of pen models Bic Cristal (b-2.1) and Atlantis (b-2.6), respectively. A good separation is observed demonstrating that the proposed method is able to discriminate pen models within the same brand, which is a challenging problem in forensic science. The same results were obtained for the other four brands tested.
Most of the papers on PLS-DA present the sensitivity and selectivity values in order to express the degree of discrimination between the classes. In this paper, for all discrimination models between different pen types, brands and models the sensitivity and selectivity were equal to their maximum values (1.00) after the exclusion of the outliers in the validation set, which confirm the high accuracy of the proposed method.
Neumann and Margot discuss an important aspect regarding discrimination between different brands that should be pointed out. When two brands or pen models share
the same ink or one brand was marketed using adifferent
ink sources, the results of the proposed method may be significantly impaired and the discrimination between brands or pen models will be not possible in these cases. However, the very good discrimination results obtained with all brands and pen models shows that this problem was not observed
in the Brazilian brands evaluated in this work.5
Blind test
The developed and validated PLS-DA models for all pens were used to analyze a set of samples in a blind test, as described in the video spectral comparison analysis section.
Figure 6 presents the results obtained for the discrimination of ballpoint brand b-2, model b-2.1. Initially, all pens used in the blind test were analyzed in the six pen type discrimination PLS-DA models. Figure 6a shows that all pens were correctly identified as belonging to the ballpoint pen type. Afterwards, samples of a specific pen were analyzed in all 15 different PLS-DA models for ballpoint pens. Figure 6b shows the results obtained for one of the fifteen cases evaluated, indicating that the pen chosen by the volunteer belongs to the brand b-2. Finally, samples of this specific pen were analyzed with the 8 PLS-DA models to identify the pen model. Figure 6b shows that in this case the pen used by the volunteer belongs to the model b-2.1 (Bic Cristal). In general, it was observed that all samples were classified as belonging to their real classes. All cases evaluated in the blind test resulted in 100% of correct identification of the pen brands chosen by the volunteers. This result indicates that the models are free of biased judgments by the analyst, and also, they are robust regarding the handwriting of different individuals and suitable to be applied to unknown samples, such as those in actual forensic cases.
Application of the proposed method in a real forensic case
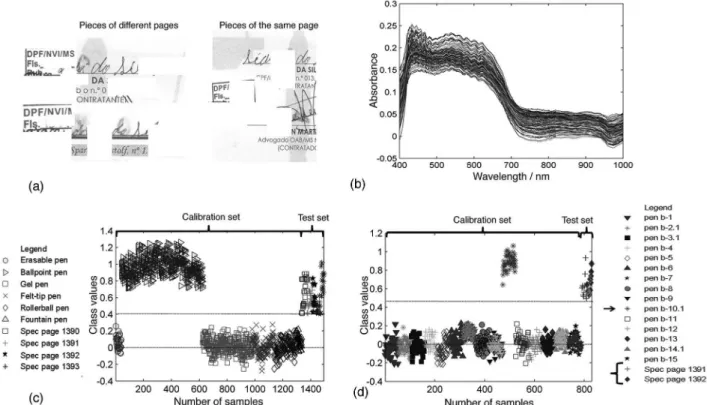
Figure 7 shows the results obtained by the application of the proposed method to the analysis of four pages from a questioned document, where the signatures of each page
were questioned abouttheir authenticity. Figure 7a presents
uncharacterized pieces of the analyzed sectors on three sheets of the questioned document. In Figure 7b, the absorbance spectra of all four pages before the application of the pre-processing methods are presented. They show a very similar spectral profile, indicating the existence of similarities in the chemical composition of inks used in each page.
Although the estimated class values for pen type identification have presented a larger bias than the one
observed in the calibration samples, Figure 7c shows that the samples of all pages are compatible with a ballpoint pen. As expected, this result agrees with the classical document analysis performed by a forensic expert. The larger bias is attributed to differences between the paper of the standard samples used for development of the PLS-DA models and the paper in the real samples.
Figure 7d presents the results obtained with the PLS-DA model for discrimination of the ballpoint pen brand b-10 (Pilot), where the samples of all pages were identified as belonging to this brand. Furthermore, it was observed that similar estimated class values were observed for the samples of all pages. The analysis in the PLS-DA models for discrimination between the specific pen models inside the brand b-10 indicated that all pages were written with an ink compatible with the brand Pilot and model BP-S fine (b-10.1). To the criminal expert, these results indicate that the analyzed traces of all pages on the questioned document may have been written with the same pen type, brand and model, which lead us to conclude that an adulteration in the questioned signatures is highly unlikely.
Conclusions
The results showed that PLS-DA presented a high discrimination power when associated with the spectra
obtained by the VSC®6000. The method enables the
correct discrimination of black inks of different pen types, brands and pen models. The results of PLS-DA indicate a great potential for the identification inks in questioned documents, since it enables a fast and nondestructive analysis of handwritten ink strokes without any sample preparation.
The validation of the method was performed with an independent test set and a blind test, where 100% correct
Figure 7. Estimated class values for calibration and application sets. (a) Images of uncharacterized pieces of the analyzed document; (b) absorbance spectra of the inks present in the pages analyzed; (c) discrimination of the inks by the PLS-DA model for discrimination of ballpoint ink pens from the other types; (d) discrimination of inks by the ballpoint brands. (▪▪▪) Discrimination threshold.
identification was achieved, thus, proving the accuracy of the method and its robustness regarding the handwriting texts produced by different individuals.
The analysis of a real forensic case was accomplished. The results indicate that the ink present in all questioned pages was compatible with a ballpoint pen of the brand Pilot and model BP-S fine. The classical document analysis performed by a forensic expert also confirms the similarity of the writings in all pages, which increases the confidence of the results obtained with the proposed method in real forensic cases. However, it is important to note that the classical visual forensic analysis only enables the identification of the pen type and that the inks present high visual similarity.
Acknowledgments
The authors thank CNPq (140867/2010-4) for financial support, SEPDOC service of the National Institute of Criminalistics, INCTAA and INCTBio.
References
1. Ezcurra, M.; Góngora, J. M. G.; Maguregui, I.; Alonso, R.; Forensic Sci. Int.2010, 197, 1.
2. Brunelle, R. L.; Crawford, K. R.; Advances in the Forensic
Analysis and Dating of Writing Ink, 1st ed.; Charles C. Thomas
Publisher Ltd.: Springfield, USA, 2002.
3. Braz, A.; López-López, M.; García-Ruiz, C.; Forensic Sci. Int.
2013, 232, 206.
4. Claybourn, M.; Ansell, M.; Sci. Justice2000, 40, 261. 5. Neumann, C.; Margot, P.; Forensic Sci. Int.2009, 185, 29. 6. Van Es, A.; De Koeijer, J.; Van der Peijl, G.; Sci. Justice2009,
49, 120.
7. Bell, S. E. J.; Stewart, S. P.; Ho, Y. C.; Raythorne, B. W.; Speers, S. J.; J. Raman Spectrosc. 2013, 44, 509.
8. Zieba-Palus, J.; Kunicki, M.; Forensic Sci. Int.2006, 158, 164. 9. Causin, V.; Casamassima, R.; Marega, C.; Maida, P.; Schiavone, S.; Marigo, A.; Villari, A.; J. Forensic Sci. 2008, 53, 1468. 10. Wilson, J. D.; La Porte, G. M.; Cantu, A. A.; J. Forensic Sci.
2004, 49, 364.
11. Roux, C.; Novotny, M.; Evans, I.; Lennard, C.; Forensic Sci. Int.1999, 101, 167.
12. Romão, W.; Schwab, N. V.; Bueno, M. I. M. S.; Sparrapan, R.; Eberlin, M. N.; Martiny, A.; Sabino, B. D.; Maldaner, A. O.; Quim. Nova2011, 34, 1717.
13. Weyermann, C.; Bucher, L.; Majcherczyk, P.; Mazzella, W.; Forensic Sci. Int.2012, 217, 127.
14. Denman, J. A.; Skinner, W. M.; Kirkbride, K. P.; Kempson, I. M.; Appl. Surf. Sci. 2010, 256, 2155.
16. Williams, M.; Moody, C.; Arceneaux, L.; Rinke, C.; White, K.; Sigman, M.; Forensic Sci. Int.2009, 191, 97.
17. Jones, R. W.; Cody, R. B.; McClelland, J. F.; J. Forensic Sci.
2006, 51, 915.
18. Lalli, P. M.; Sanvido, G. B.; Garcia, J. S.; Haddad, R.; Cosso, R. G.; Maia, D. R.; Zacca, J. J.; Maldaner, A. O.; Eberlin, M. N.; Analyst2010, 135, 745.
19. Grim, D. M.; Siegel, J. A.; Allison, J.; J. Forensic Sci.2001, 52, 1411.
20. Alamilla, F.; Calcerrada, M.; García-Ruiz, C.; Torre, M.; Forensic Sci. Int. 2013, 228, 1.
21. Hoeshe, M.; Paul, A.; Gornushkin, I.; Panne, U.; Anal. Bional. Chem.2012, 402, 1443.
22. Weyermann, C.; Bucher, L.; Majcherczyk, P.; Sci. Justice2011, 51, 122.
23. Senior, S.; Hamed, E.; Masoud, M.; Shehata, E.; J. Forensic Sci.2012, 57, 1087.
24. Silva, C. S.; Borba, F. S. L.; Pimentel, M. F.; Pontes, M. J. C.; Honorato, R. S.; Pasquini, C.; Microchem. J.2013, 109, 122. 25. Adam, C.; Forensic Sci. Int. 2008, 182, 27.
26. Adam, C.; Sherratt, S.; Zholobenko, V.; Forensic Sci. Int.2008, 174, 16.
27. Kher, A.; Mulholland, M.; Green, E.; Reedy, B.; Vib. Spectrosc.
2006, 40, 270.
28. Thanasoulias, N.; Parisis, N.; Evmiridis, N.; Forensic Sci. Int.
2003, 138, 75.
29. Kher, A. A.; Green, E. V.; Mulholland, M. I.; J. Forensic Sci.
2001, 46, 878.
30. Foster & Freeman; VSC®6000, Video Spectral Comparator -
User Manual 10; Foster & Freeman: Evesham, 2006, p. 124. 31. Silva, M. P. F.; Brito, L. R.; Honorato, F. A.; Paim, A. P. S.;
Pasquini, C.; Pimentel, M. F.; Fuel2014, 116, 151.
32. Almeida, M. R.; Fidelis, C. H. V.; Barata, L. E. S.; Poppi, R. J.; Talanta2013, 117, 305.
33. Barker, M.; Rayens, W.; J. Chemom.2003, 17, 166.
34. Pastore, T. C. M.; Braga, J. W. B.; Coradin, V. T. R.; Magalhães, W. L. E.; Okino, E. Y. A.; Camargos, J. A. A.; Muniz, G. I. B.; Bressan, O. A.; Davrieux, F.; Holzforschung2011,65, 73. 35. ASTM E1655-05: Standard Practices for Infrared Multivariate
Quantitative Analysis, West Conshohocken, 2005.
36. Martens, H.; Naes, T.; Multivariate Calibration, 1st ed.; John
Wiley & Sons: New York, USA, 1989.
37. Walczak, B.; Massart, D. L.; Chemom. Intell. Lab. Syst.1998, 41, 1.
38. Valderrama, P.; Braga, J. W. B.; Poppi, R. J.; J. Agric. Food Chem.2007, 52, 8331.
39. Wise, B. M.; Gallagher, N. B.; Bro, R.; Shaver, J. M.; Windig, W.; Koch, R. S.; PLS-Toolbox and Solo, v6.5; Eigenvector Research Inc.: Wenatchee, 2006.
40. Armstrong, N.; Hibbert, D. B.; Chemom. Intell. Lab. Syst.2009, 97, 194.
Submitted: April 6, 2014