A
Subjective
Quality Estimation
Tool
for
the
Evaluation
of Video
Communication
Systems
Janio M. Monteiro, Mairio S. Nunes
Abstract- This paper presents a quantification tool for the evaluation of scalable and non-scalable video communication systems. The proposed mechanism estimates the subjective quality of experience (QoE) of a human viewer according to the temporal resolution, the spatial resolution and the Root Mean Square of the Error (RMSE) between the original image and the encoded one. According to these three dimensions ofquality it enablesanencoder andserver tosearch for the best combination of each of these scalability factors in order to deliver the best quality. The proposed quantification toolwas obtained through subjective tests using a panel of evaluators and a new
methodologywhich have shown good correlation factors between measurement data andestimating functions.
Index Terms- Television over IP, H.264 Scalable Video Coding (SVC), Quality of Experience (QoE), subjective quality.
I. INTRODUCTION
The popularity of Internet video streaming has grown
tremendously as does the interest for mobile TV over IP
with the growth of mobile terminals using 3G technologies and wireless LANs. In this field there are currently several mobile operators already delivering live encoded videos to
clients withheterogeneous terminal capabilities.
In live video distribution, the traditional solution to adapt the encoded videotothe receiver capability and bandwidth is simulcast. In simulcast several streams are encoded, targeted for different transmission ratesand aredeliveredaccordingto
the bandwidth of the receiver. This solution, however,
presents a limited number of quality profiles and it is
necessary to frequently switch between encoded streams in
ordertosearch for the bestquality.
Analternativetothe discretenatureof simulcast is basedin alayered encoding of video, supporting what is knownasFine Grained Scalability, which enables nearly continuous quality degradation accordingtothe receiver bandwidth. Inthisfield,
in 2005 the MPEG and the Video Coding Experts Group
(VCEG) of the ITU-T have joined efforts to define the Scalable Video Coding (SVC) as an Amendment of the
H.264/MPEG-4 AVC standard [1]. SVC provides scalable video streamswhich arecomposed ofabaselayer and one or more enhancement layers. Enhancement layers may enhance the temporal resolution (i.e. frame rate), the spatial resolution
J. M. Monteiro iswith the University ofAlgarve, Faro,Portugal (email: jmmonteigualg.pt)andINESC/IST,Lisboa,Portugal.
M. S. Nunes is with INESC/IST-UTL, Lisboa, Portugal (e-mail:
mario.nunesginov.pt).
(i.e. image size), or the signal-to-noise ratio resolution (SNR)
of thecontentrepresented by the lower layers.
The reduction in temporal and spatial resolutions can hardly
be measured in terms of traditional metrics and it is notyet
completely known how each of these factors contributestothe perception of quality degradation inthe specific scenarios of
currentvideoover IP ormobile terminals.
One of the differences between traditional television and mobile TV terminals rests in thetype and size of terminals. Mobile terminals were developed to be used personally and therefore users expect reduced dimensions. Additionally the one-by-oneusageof these terminals reduces the distance from the user and the display, and usually, the videos delivered
present small sizes. It is therefore expectable that quality
assessmentevaluations should consider thistypeof scenarios. The oldest method used to monitor video quality is subjective assessment. Subjective methods were standardized
in ITU-Rrecommendation BT.500 [2] and have been usedto
evaluate video quality in television services for more than
twenty years. However,subjectiveassessment testspreviously designed to evaluate the quality in traditional television can
hardly be appliedtothecurrentscenarios of televisionover IP
(IPTV).
In [3] the authors propose a new subjective evaluation methodology called Subjective Assessment Methodology for VideoQuality (SAMVIQ) anduseittoevaluate thequality of several encoders. Theadvantage of this solution is that itwas
specially developed for Videoover IP assessment.
Inthispaper we propose asubjective quality estimation tool for the continuous assessment of television over IP
distribution systems.Theproposed tool is meant tobe usedat
the server side, inorder to help deciding whicharrangement
ofscalability factors best enhances theuserperceived quality. Although this methodology specifically focuses the SVC
encoder it can also be extended to non-scalable video encoders.
Thefollowing chaptersare organisedasfollows. ChapterII
describes the overall methodology used in the assessment tests. Chapters III and IV describe the procedures made and results taken from the assessment of the subjective quality, respectively as a function of the RMSE andas a function of spatial and temporal scalabilities. Chapter V defines a
combined QoE expression and employs it inthe analysis for the estimation of the quality of an SVC encoded video
Fig. 1. Sequences used in the metric tests.
II. METRICTESTS METHODOLOGYANDVIDEOSEQUENCES A. Metric TestsMethodology
The value of the subjective quality (Q) is usually derived directly orindirectly through theMeanOpinion Score(MOS) ofsubjective assessmenttests,like thoseproposedinthe ITU-R BT.500 Recommendation. This recommendation considers and describes several metric tests, all them orientedtovideo qualityassessment.
Besides the solutions proposed by the ITU-R BT.500
Recommendation, a new assessment testnamedSAMVIQ [3]
was proposed in the European Broadcasting Union (EBU) Technical Review.
The SAMVIQ method allows the assessment ofa set of videos (structured in several scenes) in a comparative way,
grading each video in a linear scale between 0 and 100%. In
each scene observers are firstly presented with ahigh anchor reference video (whichmustalso begraded by observers) and all the other videosarepresented in arandom order. Similarly
to other methods, this method defines the utilization of a
hidden reference having the same quality as the reference video. In this methodology assessors can play each video as manytimes asthey want inordertomake abetterjudgement of thequality of eachone.
Since users also grade the Reference video, the maximum value of thevoting scale is known andcanbe afterwards used
in the process ofquality estimation. Particularly, that value
canbe usedto compensate the scale boundary effect, using it
as an anchor of maximum quality (i.e. the maximum scale limit usedby observers).
This new method was selected in this study because it is
more orientedto quality assessmentof video transportedover
the Internet, being characterized as simpler and quicker than thepreviousones.
In ordertoperform the tests, examiners (or subjects) were
chosen among college students withages ranging from 18 to 28 years old. Allselected examiners were asked to answer an
extensive questionnaire in order to validate the universe chosen for the video tests. The questionnaire also focused problems dealing with visual acuity in order to discriminate individuals with visual deficiencies.
B. Selected Video Sequences
Four video sequences with very different characteristics
were used the measure the degradation of the perceived quality. This studywasorientedtothe evaluation of television equivalent videos and therefore all these sequences (represented in Fig. 1) were captured from TV broadcast
sources. They were recordedusing a frame rate of25
fps,
inthe 4 times Common Intermediate format (4CIF, 704x576) andtheywere savedin an YUV format. Each video sequence was chosen in order to represent a different level of visual complexity inwhat referstomotion andimage details.
TableIdepicts the characteristics of thesesequences andin
whichway each one relates tothe sequencesthat are usually usedinvideoquality metricstests.
TABLE I
VIDEOSEQUENCES CHARACTERIZATION AND DESCRIPTION.
Sequence Most similar standard Frames Duration
testsequence (seconds)
News Akiyo 274 12.3
Football Tempete 356 14.2
Motorcycle Mobile 273 10.9
Savanna Hall 281 11.3
Sequence News is characterized as having a fixed camera
and presenting a full body newscaster over a synthetic background. SequenceFootball is characterized forpresenting
a football match counter-strike with lots of detail and
movement. Sequence Motorcycle is characterized for having rapid and complex details ofaninroadmotorcycle grand prix. Sequence Savanna is a fixed camera in which movement is localized.
In all tests, the distance between each observer and their monitorranged betweenapproximately0.4 and0.6m, and all monitors were setwith the same resolution (1280x1024) and settings.
III. QUALITYAS A FUNCTION OF THERMSE
TheRoot Mean Square of the Error(RMSE) and the Peak Signal-to-Noise Ratio(PSNR), whichcanbe derived from the
RMSE, arecurrentlytwo of themost commonmetrics usedto assesscompressed videoquality.
There are however several studies, like for instance [4], which state that these metrics do not correlate well with the human perception ofquality obtained through MOS derived from subjective tests. Particularly, it was verified that the human perception of quality is affected by many different artefacts introduced by compression algorithms, like for instance the blocking and ringing effects, whichmany times
are notcorrectly quantifiedusingthePSNRorRMSEmetrics, since they contribute differently to subjective perception of
quality.
Because of this low correlation between objective and
subjective metrics, several distinct solutions were proposed whichattempt toestimate thesubjective quality of video using other metrics that try to model the behaviour of the Human
Visual System (HVS). Some of these solutions canbe found
on [5] and [6]. Nevertheless, none of these models have
proven to be applicable to a wide range of circumstances.
Instead, although they present ahigh degree of correlation in some conditionsthey also leadtolow correlations under other circumstances.
In this context, it may be understandable that both, PSNR
and RMSE, continue to be themost common metrics used to
evaluate thequality of video compression algorithms andas a consequence ofthat, it would be important to find if, and in
which cases, these metrics could be used to estimate subjective video quality. Based intheseresults, it would also be important to identify the mapping function that best estimates the HVS behaviour, evaluating it through standard procedures.
There aremany advantages of converting PSNR or RMSE insubjective metrics. For instance it iscommonly verified an
increase in transmission rate of videos without a
correspondence in perceptual quality. This usually happens because above a certain limit of encoding rate the effect in
quality is almost negligible. However, at the encoder the
PSNRmetric continuestoincrease, giving the impression that there isareal increaseintheperceived quality.
Nevertheless, in order to convert the RMSE or PSNR
metricin asubjective metric, it is importanttounderstand and distinguish psychological effects that mainly result from the chosen methodology, from psychological effects that estimates the Human Visual System response. Although the first ones usually cause distortions and variability in the results and for that reason need to be understood and compensated, the second ones should be preserved and correctly evaluated.
Additionally, since previous research have shown that different visual effects contributedifferently totheperception ofquality by theHumanVisual System, therangeof variation
invisual effects should be restricted by only using a certain encoder algorithm. Based in this assumption, it should be possible to obtain a function that represents the way quality changes accordingtotheRMSEvariation(or PSNR).
Finally, the results obtained throughassessment tests should be fittedusinganinterpolating function that consequently will
represent the degradation function of a certain encoder (according to the main encoding parameters used). Nevertheless, accordingtothepreviously defined procedure it is important to analyse each encoder separately and not to
extrapolate these resultstoother conditions.
According to these guidelines, this chapter specifies a
method that can be used to estimate, with a high degree of correlation, thesubjective quality ofanencoded video andan associated parametric estimation function that translates the human visual system response to the RMSE variation. This
estimation functioncanalso contributetotheunderstanding of
how artifacts degrade perception quality more quickly, when
does it happen, and how they are associated with the increase
in RMSE (or PSNR). Different curves obtained for different
video sequences can also help in understanding how test sequences influence the perception of quality degradation.
Additionally since the resulting estimation function describes quality degradation induced by the type of RMSE impairments of a specific encoder, applying the proposed
method to several encoders permits the comparison, understanding and evaluation of how different encoding artefacts degrade quality,astheRMSEincreases.
A. Specific Methodology
Each of the four videos was encoded in H.264 Baseline (BL) adjustedtothe transmission bit-rates of64, 128, 256and
512 kbps using the CIF format. The RMSE between the original and the coded video was computed, applied onlyto
the luminancecomponentof theimage. Table IVpresents the
RMSEresults computed for each of the encoded videos.
TABLEII
RMSE RESULTS FOR EACH OFTHEENCODED VIDEOS.
Bit Rateof the Encoded Videos(kbps)
Sequence 64 128 256 512
Football 9.4524 6.3832 4.3756 3.1120
Savanna 6.3612 5.3770 4.3106 3.2177
News 4.4212 3.3888 2.7198 2.3771
Motorcycle 11.9823 7.6391 5.2124 3.7072
As previously explained, the subjective metrics tests were
conductedusing the SAMVIQmethodology and the obtained data were analyzed having the Recommendation ITU-R BT.500[2] statisticaltreatmentprocedureasreference.
These metrictestes wereperformedusing apanel oftwenty one examiners. The same set of video sequences was
presentedtothe audience, allowing examinersto quantify the videoqualityin alinear scaleranging from0 to 100%. B. Results andAnalysis
Table III,presents the obtainedMOSof eachsequenceand theaverage MOSfor the foursequences.
TABLEIII
MOSRESULTS OFTHESEQUENCES CODEDAT DIFFERENTBIT-RATES.
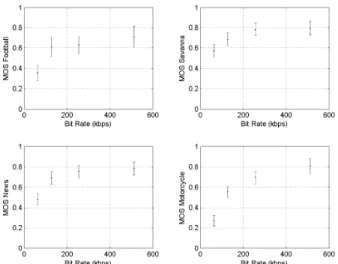
Encodingbit-rate(kbps) Sequence 64 128 256 512 Reference Football 0.354 0.612 0.630 0.710 0.760 Savanna 0.572 0.686 0.782 0.796 0.804 News 0.480 0.690 0.752 0.782 0.826 Motorcycle 0.266 0.552 0.694 0.808 0.832 Average [ 0.418 0.635 0.715 0.774 0.806
Fig.2presentstheMOSobtainedfor each sequence and the 95% confidence interval for each metric result according to theprocedure describedin[2].
By analyzing Table IIIand Fig. 2 it becomes clear that the examiners tendto evaluate the intrinsic quality of each video
and notonly the difference ofquality, asmeasured by PSNR or RMSEmetrics. This effectcanbe noticedby the difference ofMOSvalues for the several reference videosequences.
0.8 w 0.6 06 ILi 04 02 00_ 200 400 Bit Rate(kbps) 0.8 >0.6 0 0.2 00 600 0 200 400 Bit Rate(kbps)
Table IVpresents these resultsalong with the results of the standard deviation and thePearson'scorrelation coefficient.
Fig. 3 presents the interpolation results using function (3), represented in a solid line. This curvetranslates the observer
response toanincreaseintheerrorbetween theoriginalimage and the codedimage,specifically taken for theH.264encoder.
Ina dotted line isrepresented the 95%confidence interval of the function and in a dashed line is represented the 95%
confidence interval fora newsample ofNormalizedMOS.
600 0.9 0.8 en 0.6 O 0.4-0.2 0_ o 0.8 0ID Q 0.6 0 0.42 0.2-200 400 Bit Rate(kbps) O _ 600 0 200 400 Bit Rate(kbps) 0.8 Football Savanna News Motorcycle 0.7 co)0.6 0 N0 E 600 z0
0.4-Fig. 2. Mean Opinion Scores and confidence intervals for each sequence
encodedinH.264 BL.
In order to compensate this effect, all measurements were normalized using as reference the MOS obtained for the referencevideos, asfollows:
Ujk Ujk
UiREF
0.1
10 20 30 40
Root MeanSquare of the Error
(1) Fig. 3. Interpolation curve and values of the Normalized Mean Opinion Scores as afunction of the Root MeanSquareError.
were Ujk represents the normalized valueof thescorings fora certainsequence(for thetestconditionj,forasequencek), Ujk
iscomputed from thetestvideos(as definedin [2])and
uj,F
represents the mean of scorings for the Reference videos of eachsequencej.Finally, the Normalized MOS values were interpolated usingtwofunctions. Althoughthe recommendedexpressionin
[2] is:
1+
eO(PSNR+P)
(2)we found out through empirical analysis of data that the following function (3), besides being simpler, present higher values of correlation and shorter confidence intervals when
comparedwith thepreviousone.
QRASE e-a(RMSE)2 (3)
According tothese two functions, the values of 0 and p in
function(2)andocinfunction(3)werecomputed.
TABLEIV
STATISTICALPARAMETERS COMPARING THE EXPRESSION PROPOSED BY THE
RECOMMENDATION ITU-RBT.500AND THE ONE PROPOSED IN THISPAPER.
Function Coefficients Standard Correlation
Deviation Coefficient
ITU-R BT.500 0= -0.2619±0.1006 0.0922 0.8764
Recommendation p=-28.6823±1.6800
Proposedinthis
paper I8.05x103±2.00x10³ 0.0905 0.8833
Although the obtained statistical results validate both, the methodology used and the selected interpolation functions, from the analysis of Fig. 3 it is noticeable that the encoding noise introduced in the Newssequence degradesmore quickly the perceived quality than the same amount of noise introduced in the other videos. This particular resultis in line
withprevious studies like [4], showingthat the type of noise
being introduced by the encoding algorithm should be
compared with the videocharacteristics intermsoftexture.
IV. QUALITYAS A FUNCTION OFSPATIALANDTEMPORAL RESOLUTIONS
Using the SAMVIQ quality assessment methodology, the
subjective quality degradation introduced by reducing temporal and spatial scalabilities was quantified using the samefour videosequencespreviouslydescribed,yetdisplayed
uncompressed. These metric testes were performed using a panel of sixteenobservers.
A. SpecificMethodology
Inthissetof metrictests, observerswere askedto evaluate
thequality of video definitions fora4CIF, CIF, QCIFandone
quarter ofQCIF (/4QCIF, 88x72) definitions and 25, 15, 7.5, 3.75 and 1.875 frames per second. All videoswere displayed with the same size (as required by the SAMVIQ assessment
procedure), with a 4CIF equivalent size (with an height of 15.2 cm). The 4CIF initial formatwas converted in the lower
definitions (CIF, QCIF and 1/4QCIF) using the defaultspatial
0.3 0.2
downsampling
andresampling procedures
available in the reference software ofSVC[1].
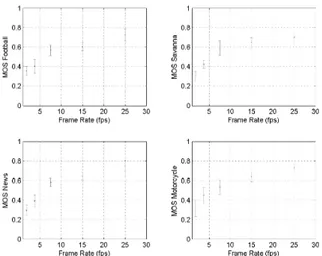
0.8 > 0.6 n U)04 0 0.2 5 10 15 20 25 30 Frame Rate(fps) 08 i 040 3: .6 ..i .4 02 5 10 15 20 25 30 Frame Rate(fps) 5 10 15 20 25 30 Frame Rate(fps) 08 04 .... U)0.4 0 02 5 10 15 20 25 30 Frame Rate(fps)Fig. 4. Mean Opinion Scoresand confidence intervals for each sequence with different frame rates.
0.8 > 0.6 u0.4 0 0.2 1 2 3 4
((1/4)QCIF-QCIF-CIF-4CIF)
1 2 3 4
((1/4)QCIF-QCIF- CIF- 4CIF)
0.8 06 P00.6 >0.4 0.2-O _ 1 2 3 4
((1/4)QCIF- QCIF-CIF-4CIF)
1 2 3 4
((1/4)QCIF lF-CIFO-4CIF)
therefore this difference could be higher if using as reference ahigher definition videosequence.
The same normalization procedure described and implemented for the analysis of the impairments caused by the RMSE increase was implemented for these metrics (using expression (2)).
The Normalized MOS values were interpolated using the
following functions (5) and (6), respectively for the reduction
intemporal and the reduction in spatial scalabilities.
QFrameRate
8]
+,2loglo(FrameRate) (5)I
QDefinition 1+e (Definition-62,) (6)
The interpolation resultsarepresented in Table V.
TABLEV
STATISTICALPARAMETERS REGARDINGTHECURVE INTERPOLATIONANALYSIS
OF THE REDUCTION ON THETEMPORALANDSPATIAL SCALABILITIES.
Standard Correlation
Function Coefficients Deviation Coefficient
QFrameRate Pi0.2827±0.0428 0.0377 0.9813 P2 =0.4634 ±0.0451
QDefinition
61.1
860±0.1648 0.0424 0.986662=1.8190±0.1115
Fig. 6 presents both fitting functions (in solid line). In a
dotted line is represented the 95% confidence interval of the function and in a dashed line is represented the 95%
confidence interval for anewsample of NormalisedMOS. As can be verified inFig. 6, users are more tolerantto temporal scalability reduction thantospatial reduction.
08-co 0 5S06 0.6-.N m 0.4-04 0.2-Football Savanna News Motorcycle
Fig. 5. MeanOpinion Scoresand confidence intervals for each sequence with different definitions.
The image definition was evaluated in a linear scale between 1 (corresponding to the 1/4QCIF format) and 4
(corresponding to the 4CIF). Intermediate values can be computed using the following expression:
Definition =-log2(PixelNumbe r)-5.3147 2
(4)
B. Results andAnalysisFigs. 4 and 5 represent the MOS obtained for each test
sequence regarding the reduction in temporal and in spatial
scalabilities, respectively.
In terms of temporal scalability the results have shown
small differencesintheMOS values between videosequences
with different levels ofmovement.
Concerning Fig. 5, it can be verified that users tend to almost equally grade thequality of 4CIF and CIF sequences.
However it is important to state that these results were orientedto the evaluationof television equivalent videos and
08 co 0 750.6 "04 0.4-0.2 1 1.5 2 2.5 3
Definition((1/4)QCIF-QOCIF C-4CIF) Football Savanna News Motorcycle
3.5
Fig. 6. Interpolationcurvesand values of the Normalized MOS withdifferent
temporal (upper part)andspatial (lower part) scalabilitymeasurements.
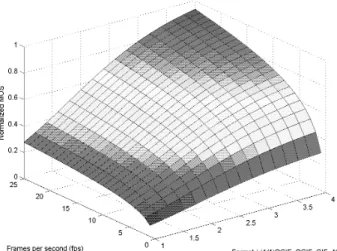
Both equations (5) and (6) were combined in a single function (7) expressing quality as a function oftemporal and spatial scalabilities.
Q(FrameRate,Definition) 8 +
l1og10(FrameRate)
(7)In this expression, y= 1.0747 was obtained through
Y = lmax(QFrameRate,
QDefinition)
and serves to maintain the resulting scale within the maximum variation of both original0.8 0.6 04 )0.42 0.2-0.8 -0060.6 LL u0.4 02 0.8 N0.6 00.4 02 0O2 10 15 Frame Rate(fps) 20 25
ranges.
Expression (7) is represented through a three dimensional
plot in Fig. 7. Notice that these results areindependent from the encoding algorithm since they were measured using raw
videos, and therefore they can be applied to different encoders.
The next step istojoin these resultsin aunique expression specifically appliedtotheH.264encoder.
Fig. 8 representsthe estimated QoE(for this encoding)as a
function of the encoded bitrate. Fig. 8 shows thatanincrease
inthe encodingbitrate notalways corresponds to anincrease
in user perceived quality and that a correct design of the quality enhancement layers should consider the associated subjectiveQoEfactor herepresented.
-o C) .F ,£ 0.9 08 07 - 06 0.8 -CO 0 50.6 ._N E 0.4-z 0.2 -02 25 4CIF 25fps CIF .(D25fps d12.5fps D12.5fps QCIF 00.5_-1'f25fp d6.25fps s 04 12.5fps 125fp 6.25fps 0.3 d1.5626fp. 3.125 fps 0.2 1.5626fps 6.25fps 03.125 fps 1.5626fps 0.1 500 1000 1500 2000 2500 Rate(kbps)
Fig. 8. Estimated QoE forthe Newssequence,codedusingthe SVCencoder,as
Format((1/4)QCIF,QCIF,CIF, 4CIF) function of theencoding bitrate.
Fig. 7. Three dimensional representation of theNormalized MeanOpinion Scoreas afunction oftemporalandspatialscalabilities.
V. COMBINEDQUALITYEXPRESSIONANDANALYSIS
Using the results obtained fromQRMSE(whicharespecificto
the H.264 encoder) with the results obtained from
QFrameRa,e
and
QDeZniUiOn
it is possible to obtain an expression thatestimates the HVS response to these three parameters. Since
any of these quality factors should be capable of independently change quality inthe full scale between 0% to
its maximum level, we propose an expression that translates this behaviour which is obtained by multiplying both expressions(3) and (7), resulting in:
QT
e-a(RAmSEA
,63
+f62
log,,
(FrameRate
(8)T~~~
~ ~
L
~~~~
ye
1
-(Definition
-,,)
were QT referstothe total QoE ofaviewer whenfacingthese three scalability factors. This expression canalso be rewritten
as a function of the PSNR, since this metric can be directly obtained from the RMSE. The validity of expression (8) should be further evaluatedusingmetrictests.
TABLE VI
Y-PSNROF THENEWS SEQUENCECODED USING THEH.264 SVCENCODER.
Frame Rate(fps)
Format 1.5625 3.125 6.25 12.5 25.0
QCIF 39.8dB 39.2dB 38.6dB 38.3dB 38.1dB
CIF 40.4dB 39.2dB 38.3dB 37.7dB 37.5dB
4CIF 39.6dB 38.3dB 37.6dB 36.8dB 36.4dB
In order to demonstrate the applicability ofexpression (8), the News sequence was encoded using the reference SVC
encoder [1]. Table VI show the Y-PSNR of the compressed videoas afunction oftemporalandspatialscalabilities.
VI. CONCLUSIONAND FUTURE WORK
The results obtained in this paper enable the subjective quantification of the impairments caused by changing the
temporalresolution,thespatial resolution and the RMSEinan encoded video. Using these results it is possible for an encoder (or video server) to select the best cost-benefit ratio, i.e. try to maximise the QoE according to the bandwidth available or the minimum bit rate for a specified level of quality.
These results also show thatanincrease in the Y-PSNR of an encoded video does not necessarily correspond to an increase in the subjective quality ofa viewer. Therefore the estimated QoEmustbe consideredas an importantmetric for thedesign andassessmentof the encoderquality layers.
Interms of futurework, further subjective tests should be
performedinordertovalidate theproposed expression (8).
REFERENCES
[1] T.Wiegand, G.Sullivan,J.Reichel, H. Schwarz,and M. Wien(eds.), "Scalable VideoCoding-Joint Draft9,"Joint VideoTeam,Doc.
JVT-V201,Marrakech, Morocco, January 13-19,2007.
[2] ITU-R Recommendation BT.500-11, "Methodology for the subjective assessmentof thequalityof televisionpictures",June 2002.
[3] F. Kozamernik et al, "Subjective quality of internet video codecs phase II evaluations using SAMVIQ", EuropeanBroadcasting Union
(EBU)TechnicalReview,No.301, January2005.
[4] Girod, B., "What'swrongwithMean-Squared Error", Digital Images and Human Vision,A. B. WatsonEd., Chapter 15,pp. 207-220, MIT
press,1993.
[5] Guo,J. etal., "Gabor Difference Analysis ofDigitalVideo Quality", IEEETransactionsonBroadcasting,Vol.59, NO.3,Geneva, September
2004.
[6] Winkler, S., DigitalVideoQuality.JohnWileyEd., 2005,ch. 4.
Framespersecond(fps) 0 1

![Fig. 2 presents the MOS obtained for each sequence and the 95% confidence interval for each metric result according to the procedure described in [2].](https://thumb-eu.123doks.com/thumbv2/123dok_br/18032654.861460/3.892.472.809.890.1032/presents-obtained-sequence-confidence-interval-according-procedure-described.webp)