The aim of this paper is to systematically review the literature to estimate the overall prevalence of xerostomia/hyposalivation in epidemiological studies. An electronic search was carried out up to February 2018 with no language restrictions. A total of 5760 titles were screened and just twenty-nine papers were included in review and the meta-analysis after a two independently reviewers applied the selection criteria. Data were extracted from PubMed and Web of Science databases. Eligibility criteria included original investigations from observational population-based studies that reported the prevalence of xerostomia or data that allowed the calculation of prevalence of xerostomia and/or hyposalivation. Studies conducted in samples with specific health conditions, literature reviews, case reports and anthropological studies, as conferences or comments were excluded. Sample size, geographic location of the study, study design, age of the studied population, diagnosis methods, and evaluation criteria used to determine xerostomia e/or hyposalivation were extracted for meta-analysis and meta-regression. Multivariate meta-regression analysis was performed to explore heterogeneity among studies. The overall estimated prevalence of dry mouth was 22.0% (95%CI 17.0-26.0%). Higher prevalence of xerostomia was observed in studies conducted only with elderly people. Despite diverse approaches to the condition’s measurement, just over one in four people suffer from xerostomia, with higher rates observed among older people. Moreover, the measurement methods used currently may over- or underestimate xerostomia. These findings highlight the need for further work on existing and new clinical measure and will be useful to determine which one is more reliable in clinical and epidemiological perspectives.
How Common is Dry Mouth? Systematic
R e v i e w a n d M e t a - R e g r e s s i o n
Analysis of Prevalence Estimates
Bernardo Antonio Agostini1, Graziela Oro Cericato2, Ethieli Rodrigues da Silveira3, Gustavo Giacomelli Nascimento4, Francine dos Santos Costa1,3, Willian Murray Thomson5, Flavio Fernando Demarco1,3
1Post-Graduate Program in Epidemiology, UFPEL - Universidade Federal de Pelotas, Pelotas, RS, Brazil 2School of Dentistry, IMED - Instituto de Desenvolvimento Humano, Passo Fundo, RS, Brazil 3Post-Graduate Program in Dentistry, UFPEL - Universidade Federal de Pelotas, Pelotas, RS, Brazil 4Section of Periodontology, Department of Dentistry and Oral Health, Aarhus University, Aarhus, Denmark
5Sir John Walsh Research Institute, University of Otago, Dunedin, New Zealand
Correspondence: Flávio Fernando Demarco, Rua Gonçalves, 457, 5º andar, 96015560 Pelotas, RS, Brasil. Tel: +55-53-3222-6690. e-mail: [email protected]
Key Words: xerostomia, dry mouth, hyposalivation, global prevalence, salivary function. Brazilian Dental Journal (2018) 29(6): 606-618
http://dx.doi.org/10.1590/0103-6440201802302 ISSN 0103-6440
Introduction
Xerostomia and hyposalivation are two distinct and independent phenomena, which may manifest alone or in combination (1). Xerostomia is defined as the subjective sensation of dry mouth and it is diagnosed through self-report (2). On the other hand, hyposalivation refers to an objectively measured low salivary flow (3). Either dry mouth situations may negatively affect oral health-related quality of life (4,5) and may cause oral health problems such as halitosis, impaired chewing and swallowing, and difficulties in prosthesis retention (6). There is evidence that lower salivary flow increases the risk of dental caries, due to an absence of the physical cleaning action and buffering capacity of saliva (7). This increasing risk is not exclusive of elderly and can occur in early age, specially in asthmatic patients under treatment.
Epidemiological studies of dry mouth situations from the last two decades have shown prevalence estimates ranging from 1% (8) to 62% (1). The high variability in estimates has been attributed to variations in measurement methods, populations investigated, sample representativeness, study design, and the age of individuals
evaluated (9). Despite the research effort, much remains unanswered about the epidemiology of dry mouth. Even xerostomia that is measured through self-report (2,10), there are methodological differences, whereby some studies report only the presence or absence of dry mouth (7,11,12) and others investigate the frequency of such a sensation (5,13,14). New approaches use scales, such as the Xerostomia Inventory (XI) developed and tested by Thomson et al. (15), which includes a battery of seven xerostomia questions used by Locker (16) or a nine-item battery of questions on dry mouth-related symptoms and behaviors (17).
Hyposalivation is diagnosed through the assessment of salivary flow, which may be evaluated by collecting the fluid from individual salivary glands (or pairs of glands) and; also, total salivary flow may be evaluated by collecting whole saliva. The latter method is more common (9). However, there is a lack of consensus in the literature about which salivary flow rate indicates hyposalivation, ranging from less than 0.1mL/min unstimulated saliva (15) to 0.8 mL/ min stimulated saliva (18).
Braz Dent J 29(6) 2018
607
Overall prevalence of dry mouth
Increasing age has been reported as a risk marker for xerostomia (11,19). Chronic diseases such as diabetes, autoimmune diseases, especially Sjögren’s Syndrome (12), and polypharmacy (10,20,21) are recognized as major dry mouth associations. Not only polypharmacy, but specific medicines favor the occurrence of xerostomia and hyposalivation, especially inhaled antiastmatic drugs (22). The action of such medicines, even in early ages can significantly affect salivary flow. Considering the widespread occurrence of asthma since childhood (23) and the impact of its therapy in dry mouth, the effects of it therapy in a long-term are not clear and it must be considered in all ages as well.
A previous systematic review evaluating the prevalence of xerostomia in population samples was published in 2006 (24). However, that study included only estimates for xerostomia. Moreover, the study did not use a meta-analysis, so it was unable to obtain an overall prevalence estimate for xerostomia. Many epidemiological studies on dry mouth have been published since then.
This paper presents a systematic review of the literature on the prevalence of xerostomia and hyposalivation in order to obtain a global combined prevalence estimate for dry mouth, and to determine the factors behind the considerable variability in prevalence estimates.
Material and Methods
This systematic review was organized using the PRISMA statement and it was based on the following review question: “What is the estimated worldwide prevalence of xerostomia/hyposalivation?”
Eligibility Criteria
Original investigations from observational studies that reported the prevalence of xerostomia were included. Only population-based studies with representative samples, according to the Critical Appraisal Checklist for prevalence studies recommended by the Joanna Briggs Institute, were
considered for this review. As a qualifying condition, all selected studies should have clearly reported the prevalence of xerostomia and/or hyposalivation or have included data allowing its calculation.
Studies conducted in samples with specific health conditions (asthma, cancer, depression, paralysis, syndromes - including Sjögren’s Syndrome, and similar convenience samples) were excluded, as were literature reviews, case-control studies, retrospective studies, case reports, anthropological studies, in vitro and in situ studies, and comments or conference abstracts. Articles in other languages than English, Spanish, Portuguese, French or German were excluded.
Search Strategy
An electronic search was performed in the PubMed and Web of Science databases, with no initial date and language restrictions. Keywords included the following MeSH and free terms: (Xerostomia(Mesh)) OR (Xerostomia (all)) OR (Dry Mouth(all)) OR (Mouth Dryness(all)) OR (Hyposalivation(all)) AND Epidemiologic Studies(Mesh)) AND (Cross-Sectional Studies(Mesh)) AND (Longitudinal Studies(Mesh)) AND (Cohort Studies(Mesh)), which are presented in Table 1 in several combinations.
Reports were managed using the EndNote X7.4 software (Thomson Reuters, New York, NY, USA). Duplicate reports were excluded. Two reviewers (GOC and ERS) independently screened titles and abstracts, based on the aforementioned criteria. The screened lists were compared and differences were discussed and resolved by consensus. If there was no consensus, a third examiner was asked to decide on the inclusion or exclusion of the study. The same two reviewers also screened full text manuscripts. Reference lists from the eligible papers were reviewed according to the eligibility criteria. Gray Literature was not screened.
Critical Appraisal
The Critical Appraisal Checklist for prevalence and
Table 1. Search strategy
PubMed
(((((“Xerostomia”(Mesh)) OR “Xerostomia”(all)) OR “Dry Mouth”(all) OR “Mouth Dryness”(all) OR “Hyposalivation”(all))) AND ((((((((((((((((((((((((“Epidemiological Studies”) OR “Epidemiological Study”) OR “Cross Sectional Study”) OR “Cross Sectional Studies”) OR “Cross-Sectional Study”) OR “Cross-“Cross-Sectional Studies”) OR “Studies, Cross-“Cross-Sectional”) OR “Study, Cross-“Cross-Sectional”) OR “Prevalence Studies”) OR “Prevalence Study”) OR “Studies, Prevalence”) OR “Study, Prevalence”) OR “Cohort Study”) OR “Cohort Studies”) OR “Incidence Study”) OR “Incidence Studies”) OR “Studies, Incidence”) OR “Study, Incidence”) OR “Follow up Studies”) OR “Follow-up Studies”) OR “Follow up Study”) OR “Follow-up Study”) OR “Prevalence”) OR “Incidence”))
Web of Science
Braz Dent J 29(6) 2018
608
B
. A. Agostini.
incidence studies recommended by the Joanna Briggs Institute was employed. The same reviewers independently evaluated each study and answered ‘Yes’, ‘No’, or ‘Unclear’ for each of the 9 items of the instrument. Disagreements were resolved by reaching consensus through discussion.
Data Extraction and Data Analysis
Information extracted from the studies included sample size, geographic location, study design, age of the studied population, diagnosis methods, and evaluation criteria used to define xerostomia and/or hyposalivation. Prevalence rates for xerostomia/hyposalivation were also collected (or calculated, if necessary). In case of missing data, the authors were contacted up by e-mail. When more than one method for measuring dry mouth was employed, prevalence rate of hyposalivation was included in the meta-analysis for dry mouth. Prevalence rates were categorized according to the age of the participants (adults or elders), when more than one available, the highest was used;
however, when such information was not available, studies were grouped into mixed population (adults and elders). Considering that cohort studies could showed prevalences of xerostomia or hyposalivation in more than 1 time, it was established the use of the most recent values of prevalences.
The estimated global prevalence of dry mouth was calculated using fixed- and random-effect models. When heterogeneity was present (I2>50% or chi-square p value<0.05), the random-effect model was favored (25). The same criteria were adopted for individual meta-analysis of xerostomia and hyposalivation information of each study. Additionally, meta-regression and subgroup analyses were conducted to investigate sources of between-study variability for each criterion. Characteristics were included in a multivariate meta-regression model. Variable selection was performed using the backward stepwise approach. Variables with p value<0.20 remained in the final model, but only those with p value<0.05 were considered significant in the final adjusted model. Explained heterogeneity was
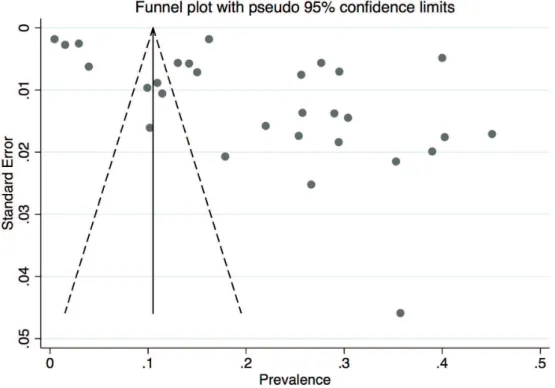
obtained from the adjusted R2 of the final model. Subgroup analysis was also conducted for each methodological variable included in the final meta-regression model. Sensitivity analyses were conducted to estimate the influence of each study on the pooled results. Funnel plot and the Egger test were used to test for any potential publication bias (17). All analyses were performed using the Stata 14.1 software (StataCorp, College Station, TX, USA).
Results
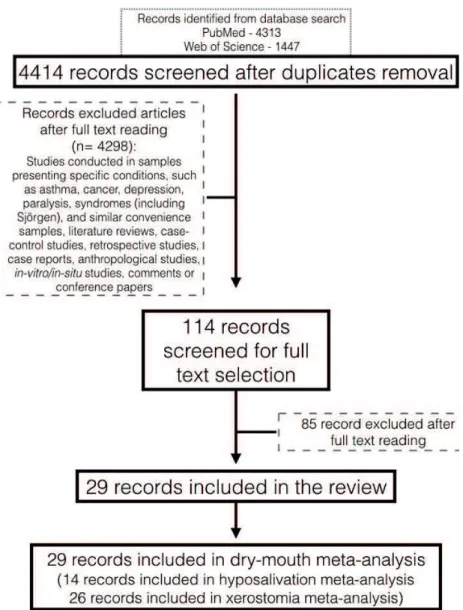
Electronic searches revealed 5760 studies. From those, 1346 were excluded for being duplicates. A total of 4414 articles were submitted to title and abstract screening and 114 of them remained for full-text evaluation, from which 85 were excluded after appraisal (Fig. 1, Table 2). A total of 29 articles met the inclusion criteria, among these articles, 26 reported the prevalence of xerostomia or data on it and 14 reported the prevalence of hyposalivation
Braz Dent J 29(6) 2018
609
Overall prevalence of dry mouth
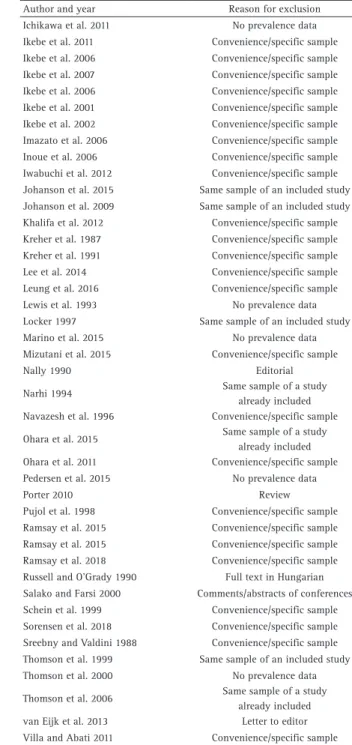
Table 2. Excluded studies and reasons for exclusion
Author and year Reason for exclusion Abdullah 2015 Convenience/specific sample Acevedo et al. 1996 Comments/abstracts of conferences Allen and Locker 1997 No prevalence data Almas et al. 2003 Convenience/specific sample Almstahl et al. 2012 Convenience/specific sample Anusavice 2002 No access to full text Arcury et al. 2009 Convenience/specific sample Atchinson et al. 1993 Convenience/specific sample Bai and Lin 2006 Full text in Chinese Barbagli et al. 2014 No prevalence data Benaryeh et al. 1985 Convenience/specific sample Bergdahl 2000 Convenience/specific sample Bergdahl and Bergdahl 2001 Convenience/specific sample Bergdahl and Bergdahl 2002 Convenience/specific sample Bhattacharyya and Kenpes 2015 Prevalence data not clear Billings 1993 Review Billings et al. 1996 Convenience/specific sample Cabrera et al. 2007 Convenience/specific sample Castrejon-Perez et al. 2017 Convenience/specific sample Chopra et al. 2015 Convenience/specific sample Coccia et al. 2015 No access to full text El Osta et al. 2014 Convenience/specific sample Elishoov et al. 2005 Full text in Hebrew Enoki et al. 2014 Convenience/specific sample Evans et al. 2000 Prevalence data not clear Farah et al. 2008 Convenience/specific sample Field et al. 2000 Convenience/specific sample Field et al. 2001 Convenience/specific sample Field et al. 2001 No access to full text Flink 2007 No access to full text Flink et al. 2008 Convenience/specific sample Flink et al. 2000 Convenience/specific sample Foerster et al. 1998 Convenience/specific sample Fure 1998 Non-representative sample Fure 2003 Non-representative sample Gerdin et al. 2005 Convenience/specific sample Ghezzi and Ship 2003 Non-representative sample Gilbert et al. 1993b Same sample of an included study Goaz et al. 1994 Comments/abstracts of conferences Gois et al. 2018 Convenience/specific sample Guignon and Novy 2015 Comments/abstracts of conferences Hahnel et al. 2014 Convenience/specific sample Hassel et al. 2010 Non-representative sample
Author and year Reason for exclusion Ichikawa et al. 2011 No prevalence data Ikebe et al. 2011 Convenience/specific sample Ikebe et al. 2006 Convenience/specific sample Ikebe et al. 2007 Convenience/specific sample Ikebe et al. 2006 Convenience/specific sample Ikebe et al. 2001 Convenience/specific sample Ikebe et al. 2002 Convenience/specific sample Imazato et al. 2006 Convenience/specific sample Inoue et al. 2006 Convenience/specific sample Iwabuchi et al. 2012 Convenience/specific sample Johanson et al. 2015 Same sample of an included study Johanson et al. 2009 Same sample of an included study Khalifa et al. 2012 Convenience/specific sample Kreher et al. 1987 Convenience/specific sample Kreher et al. 1991 Convenience/specific sample Lee et al. 2014 Convenience/specific sample Leung et al. 2016 Convenience/specific sample Lewis et al. 1993 No prevalence data Locker 1997 Same sample of an included study Marino et al. 2015 No prevalence data Mizutani et al. 2015 Convenience/specific sample Nally 1990 Editorial Narhi 1994 Same sample of a study
already included Navazesh et al. 1996 Convenience/specific sample Ohara et al. 2015 Same sample of a study
already included Ohara et al. 2011 Convenience/specific sample Pedersen et al. 2015 No prevalence data Porter 2010 Review Pujol et al. 1998 Convenience/specific sample Ramsay et al. 2015 Convenience/specific sample Ramsay et al. 2015 Convenience/specific sample Ramsay et al. 2018 Convenience/specific sample Russell and O’Grady 1990 Full text in Hungarian Salako and Farsi 2000 Comments/abstracts of conferences Schein et al. 1999 Convenience/specific sample Sorensen et al. 2018 Convenience/specific sample Sreebny and Valdini 1988 Convenience/specific sample Thomson et al. 1999 Same sample of an included study Thomson et al. 2000 No prevalence data Thomson et al. 2006 Same sample of a study
already included van Eijk et al. 2013 Letter to editor Villa and Abati 2011 Convenience/specific sample
or data on it. One study was included twice in the meta-analysis, because it presented separate data for different populations under study (14).
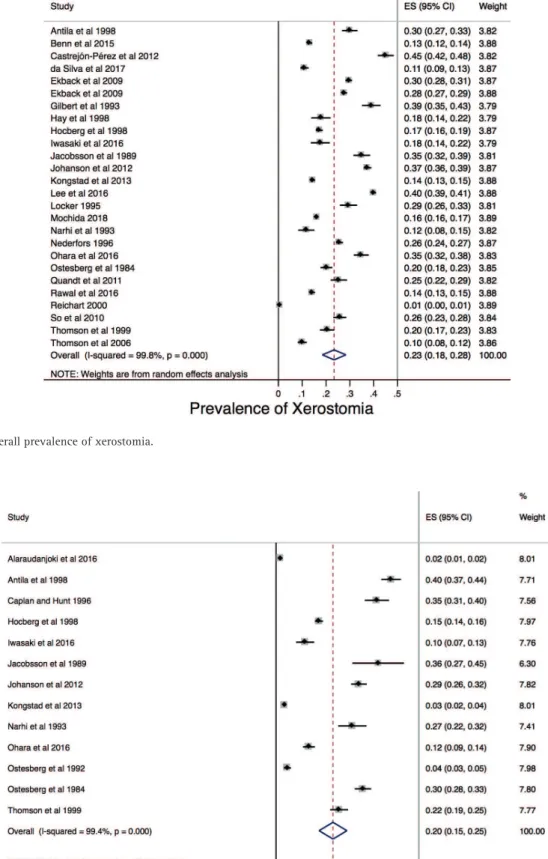
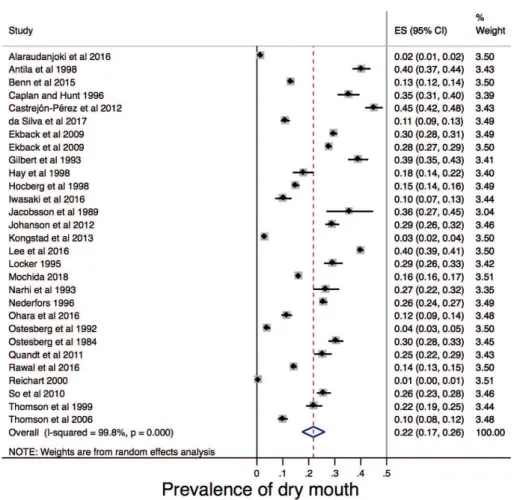
The overall prevalence of xerostomia was estimated to be 23.0% (95%CI 18.0-28.0%), with high heterogeneity among studies (I2 99.8%; chi square p value<0.001; Fig. 2). The overall prevalence of hyposalivation was estimated to be 20.0% (95%CI 15.0 – 25.0%) with high heterogeneity among studies (I2 99.4%; chi square p value<0.001; Fig. 3). The overall prevalence of dry mouth (xerostomia or hyposalivation) was estimated to be 22.0% (95%CI 17.0-26.0%), also with high heterogeneity among studies (I2
99.8%; chi square p-value<0.001; Fig. 4).
The final meta-regression analysis explained about 16% of the between-study variability.
Braz Dent J 29(6) 2018
610
B
. A. Agostini.
study (12) did not use an appropriate statistical analysis, and one study (7) did not have a sufficient participation rate.
Tables 5 and 6 shows the subgroup analysis according to the variables retained in the final adjusted
meta-Figure 2. The overall prevalence of xerostomia.
Braz Dent J 29(6) 20
18
611
Overall prevalence of dry mouth
Table 3. Main characteristics of included studies
Author and year (# ref) Country Participants Age of
participants Study design
Xerostomia/ Hyposslivation assessment
Xerostomia/ Hyposalivation criteria
Cases of Xerostomia/
Hyposalivation Total Sample Prevalence Alaraudanjoki et
al. 2016 (3) Finland Adults 46 Cohort Unstimulated salivary flow rate
Unstimulated salivary flow
rate <0.1 mL/min 31 1,944 0.2* Antila et al. 1998 (13) Finland Adults 55 Cross-sectional Self-reported Frequency (‘Sometimes’ ‘Often’) 232 774 30.0 Adults 55 Cross-sectional Stimulated salivary flow rate Stimulated salivary flow rate <0.7 mL/min 312 774 40.3* Adults 55 Cross-sectional Unstimulated salivary flow rate Unstimulated salivary flow
rate <0.1 mL/min 123 772 15.9 Benn et al. 2015 (5) New Zealand Adults/Elderly >18 Cross-sectional Self-reported Frequency (‘Always’ ‘Frequently) 455 3475 13.1* Caplan and Hunt
1996 (28)
United States
of America Elderly >65 Cross-sectional Stimulated salivary flow rate Stimulated salivary flow rate < 1 mL/min 173 490 35.3* Castrejón-Pérez
et al. 2012 (2) Mexico Elderly >70 Cohort Self-reported Presence/Absence 378 838 45.1*
da Silva et al. 2017 (35) Brazil Adults 20-59 Cohort Self-reported
Frequency (‘Regular’ “Irregular’) according to “Frequently” or “Always” answers
to the question ‘How often do you experience dry mouth?’ in 2009 and 2012.
134 1222 11.0*
Ekback et al. 2009 (14) Norway Elderly 65 Cross-sectional Self-reported Frequency (‘Sometimes’ ‘Often’ ‘Seldom’) 1,201 4,062 29.6* Sweden Elderly 65 Cross-sectional Self-reported Frequency (‘Sometimes’ ‘Often’ ‘Seldom’) 1,685 6,078 27.7* Gilbert et al. 1993 (10) United States
of America Elderly >65 Cross-sectional Self-reported Presence/Absence 234 600 39.0*
Hay et al. 1998 (26) United States
of America Adults/Elderly 18-75 Cross-sectional Self-reported
Classification based on 3 questions: Does your mouth feel dry every day? Have you had recurrent or persistent swelling of your salivary glands as an adult? Do you frequently have to
take a drink in order to swallow?
61 341 17.9*
Hocberg et al. 1998 (11) England Elderly 65-84 Cohort Self-reported
Classification based on 2 questions: Does your mouth usually feel dry? Do you wake at night feeling so dry in your
mouth that you need to drink fluids?
427 2,482 17.2
England Elderly 65-84 Cohort Stimulated salivary flow rate Stimulated salivary flow rate < 1 mL/min 373 2,482 15.0* Iwasaki et al. 2016 (7) Japan Elderly 80 Cohort Self-reported Presence/Absence 62 352 17.6 Elderly 80 Cohort Stimulated salivary flow rate Stimulated salivary flow rate <0.5 mL/min 36 352 10.2*
Jacobsson et al. 1989 (12) Sweden Adults 52-72 Cohort Self-reported
Classification based on 2 questions: Do you often feel a gritty or sandy sensation in your eyes? Do you wake up at night feeling so dry in the mouth
that you need to drink water?
247 705 35.0
Adults 52-72 Cohort Unstimulated salivary flow rate Unstimulated salivary flow
Braz Dent J 29(6) 20
18
61
2
B. A. Agostini.
Johanson et al. 2012 (1) Sweden Elderly 75 Cohort Self-reported Frequency (‘Sometimes’ ‘Often’ ‘Seldom’) 1,325 3,539 37.4 Elderly 75 Cohort Self-reported Frequency (‘Sometimes’ ‘Often’ ‘Seldom’) 2,064 3,591 57.5 Elderly 75 Cohort Self-reported Frequency (‘Sometimes’ ‘Often’ ‘Seldom’) 2,249 3,611 62.3 Elderly 75 Cohort Stimulated salivary flow rate Stimulated salivary flow rate <0.7 mL/min 311 1072 29.0* Kongstad et al. 2013 (19) Denmark Adults/Elderly 18-96 Cross-sectional Self-reported Frequency (‘Sometimes’ ‘Often’ ‘Seldom’) 634 4,402 14.4 Adults/Elderly 18-96 Cross-sectional Stimulated salivary flow rate Stimulated salivary flow rate <0.5 mL/min 132 4,402 3.0* Lee et al. 2016 (29) Korea Elderly >65 Cross-sectional Self-reported Presence/Absence 3,943 9,84 40.1* Locker 1995 (34) Canada Adults >50 Cross-sectional Self-reported Presence/Absence 180 611 29.5* Mochida et al. 2018 (41) Japan Elderly >65 Cohort Self-reported Presence/Absence 6256 38529 16.2* Narhi et al. 1993 (18) Finland Elderly >75 Cohort Self-Reported Presence/Absence 40 341 11.7
Elderly >75 Cohort Unstimulated salivary flow rate Unstimulated salivary flow
rate <0.1 mL/min 143 306 46.7 Elderly >75 Cohort Stimulated salivary flow rate Stimulated salivary flow rate <0.8 mL/min 82 307 26.7* Nederfors 1996 (37) Sweden Adults 20-80 Cross-sectional Self-reported Presence/Absence 851 3,313 25.7* Ohara et al. 2016 (27) Japan Elderly >65 Cross-sectional Self-reported Presence/Absence 311 894 34.8
Elderly >65 Cross-sectional Unstimulated salivary flow rate Weight <0,1 g 103 894 11.5* Ostesberg et al. 1992 (20)
Ostesberg et al. 1984 (40) Sweden Elderly >70 Cohort Stimulated salivary flow rate Stimulated salivary flow rate <0.2 mL/min 39 975 4.0* Elderly >70 Cohort Self-reported Presence/Absence 201 996 20.2 Elderly >70 Cohort Stimulated salivary flow rate Stimulated salivary flow rate <0.1 mL/min 303 996 30.4* Quandt et al. 2011 (36) United States
of America Elderly >60 Cross-sectional Self-reported Frequency (‘Always’ ‘Frequently) 158 622 25.4* Rawal et al. 2016 (33) United States
of America Adults >40 Cross-sectional Self-reported Presence/Absence 513 3,603 14.2* Reichart 2000 (8) Germany Adults >35 Cross-sectional Self-reported Presence/Absence 7 1,367 0.1* So et al. 2010 (17) Korea Elderly >55 Cross-sectional Self-reported Classification based on 9 questions. 261 1,012 25.8* Thomson et al. 1999 (15) Australia Elderly 75 Cohort Self-reported Frequency (‘Always’ ‘Frequently) 140 684 20.5
Elderly 75 Cohort Unstimulated salivary flow rate Unstimulated salivary flow
rate <0.1 mL/min 151 684 22.1* Thomson et al. 2006 (4) New Zealand Adults/Elderly 26 and 32 Cohort Self-reported Frequency (‘Always’ ‘Frequently) 95 950 10.0*
Braz Dent J 29(6) 2018
613
Overall prevalence of dry mouth
regression models. A higher prevalence estimate for dry mouth was noted in studies conducted with older people only and in studies conduceted in Americas (Table 5). Table 6 presents overall prevalence estimates for xerostomia and
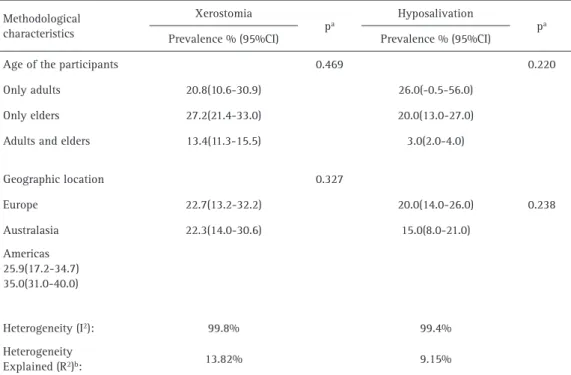
hyposalivation separately. Considerating age group, the higher prevalence values were 27.2% for xerostomia in studies conducted with older people only; and 26.0% for hyposalivation in studies considering adults people only. The heterogeneity of the studies for each outcome was higher than 99.0%.
The Egger test revealed the presence of publication bias (p-value=0.007), which was confirmed by the metafunnel analysis (Fig. 5). Sensitivity analysis demonstrated that the omission of any study would not significantly modify the estimated prevalence of dry mouth (Fig. 6).
Discussion
This meta-analysis of findings from epidemiological studies on dry mouth has found the overall estimated prevalence of dry-mouth from population-based studies tov be 22.0% (95%CI 17.0-26.0). Xerostomia and hyposalivation are two phenomena that may negatively affect the oral health of individuals and their quality of life (4,5,13). Dry mouth impairs oral function, chewing, and swallowing (29). Considering oral diseases, evidences from different study designs researches highlight the impact of salivary problems in caries experience (30,31). Moreover, a recent study showed that dry mouth could influence the occurrence of halitosis and consequently affect oral health-related quality of life (32). Besides oral manifestations, these problems may result in more general effects, including loss of appetite, malnutrition, impaired interpersonal communication and social interactions, and perhaps even depression, thereby negatively affecting the daily lives of sufferers (4,5).
When only xerostomia was considered the overall prevalence in the studies considered in this review ranged from 0.01% (8) to Table 4. Evaluation of included studies according to Joanna Brings Institute Critical Appraisal
Checklist
Checklist item
1 2 3 4 5 6 7 8 9
Alaraudanjoki et al. 2016 (3) yes yes yes no yes yes yes yes yes
Antila et al. 1998 (13) yes yes yes yes yes yes yes yes yes
Benn et al. 2015 (5) yes yes yes yes yes yes yes yes yes
Caplan and Hunt 1996 (28) yes yes yes yes no yes yes yes yes
Castrejon-Perez et al. 2012 (2) yes yes yes yes yes yes yes yes yes
da Silva et al. 2017 (35) yes yes yes yes yes yes yes yes yes
Eckback et al. 2009 (14) yes yes yes yes yes yes yes yes yes
Gilbert et al. 1993 (10) yes yes yes yes yes yes yes yes yes
Hay et al. 1998 (26) unclear yes yes yes yes yes yes yes yes
Hocberg et al. 1998 (11) yes yes yes yes yes yes yes yes yes
Iwasaki et al. 2016 (7) yes yes no yes yes yes yes yes no
Jacobsson et al. 1989 (12) unclear yes yes yes yes yes yes no yes
Johanson et al. 2012 (1) yes yes yes yes yes yes yes yes yes
Kongstad et al. 2013 (19) yes yes yes yes yes yes yes yes yes
Lee et al. 2016 (29) yes yes yes yes yes yes yes yes yes
Locker 1995 (34) yes yes yes yes yes yes yes yes yes
Mochida 2018 (41) yes yes yes yes yes yes yes yes yes
Narhi et al. 1993 (18) yes yes yes yes yes yes yes yes yes
Nederfors 1996 (37) yes yes yes yes yes yes yes yes yes
Ohara et al. 2016 (27) yes yes unclear yes yes yes yes yes yes
Ostesberg et al. 1992 (20) yes yes yes yes yes yes yes yes yes
Ostesberg et al. 1984 (40) yes yes yes yes yes yes yes yes yes
Quandt et al. 2011 (36) yes yes yes yes yes yes yes yes yes
Rawal et al. 2016 (33) yes yes yes yes yes yes yes yes yes
Reichart 2000 (8) yes yes yes yes yes yes yes yes yes
So et al. 2010 (17) yes yes yes yes yes yes yes yes yes
Thomson et al. 1999 (15) yes yes yes yes yes yes yes yes yes
Thomson et al. 2006 (4) yes yes yes yes yes yes yes yes yes
Braz Dent J 29(6) 2018
614
B
. A. Agostini.
45% (2). For hyposalivation, the prevalence rate ranged from 0.02% (3) to 40% (13). For both situations, ageing seems to be determinant of its occurrence, studies have shown what appears to be an increase in the prevalence of dry mouth with increasing age. Diverse factors have been investigated to clarify the potential association of age with such oral conditions. However, most studies were conducted in samples of older people and no population-based studies were conducted in children or adolescents sample. Moreover, a few studies conducted in both populations of young adults and older adults have found prevalence differences between them. Thomson et al. (15) found a prevalence of 20% of xerostomia in an older population and 10% in an adult population (4). Similar findings were observed by Benn et al. (5) in a nationally representative sample, in which the prevalence of xerostomia was 5% in the 18-24 age group and 26% in those aged 75 years or older, but there was not a consistent age gradient. These findings provide further evidence that xerostomia, even in divergent proportions, could not affect only older people, and that perhaps the lack of knowledge of its occurrence by young adults is because younger age groups have become aware of it only over the last decade or so. Hence, it is difficult to establish age-standardized population prevalences
of dry mouth and what kind factors really modify salivary conditions in young population.
There is evidence that the association with age is not just due to the aging process itself. Aging is associated with increases in comorbid chronic medical conditions, w h i c h c o n s e q u e n t l y increases the use of medications. Many of the drugs taken are associated with lower salivary flow (10,11,17,27,33). In this context, an interesting observation was the association between the number of medications taken and the prevalence of xerostomia (34-36). The prevalence of xerostomia is usually higher in individuals who take more than one medication (4,37). Factors such as changes in saliva quality, underlying diseases, and medications should be Figure 4. The overall prevalence of dry mouth (xerostomia or hyposalivation).
Table 5. Meta-regression of dry mouth and subgroup analysis according to methodological characteristics.
Methodological characteristics
Prevalence %
(95%CI) p value
a Heterogeneity
Explained (R2)
Age of the
participants 0.259 10.52%
Only adults 19.3 (12.8-25.7)
Only elders 25.4 (20.0-30.9)
Adults and Elders 10.8 (4.2-17.5)
Geographic
location 0.187 2.79%
Europe 20.4(14.7-26.2)
Australasia 18.6(10.6-26.7)
Americas 27.1 (18.7-35.5)
Heterogeneity Explained by final model (R2) b: 15.81%
Braz Dent J 29(6) 2018
615
Overall prevalence of dry mouth
considered as the cause of higher subjective perception of dry mouth with aging (16). Not only polypharmacy but specific drugs present salivary flow and quality adverse
Figure 5. Funnel plot of the studies included in metaregression analysis.
Figure 6. Estimated prevalence of dry mouth and confidence interval with random effect after the omission of the study.
Braz Dent J 29(6) 2018
616
B
. A. Agostini.
conditions. Even few months using inhaled β2-agonist and corticosteroids could decrease significantly the salivary flow rate, increase dental plaque index, and decrease salivary pH (38-40), all of these consequences favor dental caries. Finally, the long-term effect of this group of medicines in salivary aspects is not known, and identify asthmatic population that used inhaled medicines in the past could be an alternative to understand life-course effects of medication on salivary flow rate.
This study has several strengths that should be considered. The first one is the inclusion of population-based studies only, excluding studies that investigated clinical or other biased samples, then the common occurrence of dry mouth in general population could be evaluated. Secondly, the analytical approach used, including the meta-analysis, allowed estimating the global prevalence of xerostomia. Such methodology has already been used to estimate the global prevalence of halitosis (32) and its use here by regarding dry mouth highlights the importance of the approach for obtaining global estimates of the impact of major oral conditions. The high heterogeneity found in all meta-regressions conducted evidence the lack of a standard criteria for population-based studies aiming to assess salivary conditions. However, we used meta-regression as a tool to explain heterogeneity in prevalence among studies. Although there was no statistical association, a considerable amount of heterogeneity were explained
after considering age-groups and geographic location of the studies as potential sources of heterogeneity. Finally, the studies included showed high quality, since just six studies of all included do not fulfill all items as “yes” in the JBI critical appraisal checklist.
Besides the strengths stated, our findings should be interpreted with caution. Firstly, the Egger test and the funnel plot revealed publication bias, although the main databases for the outcome had been searched and an extensive search had been conducted this could suggest a lack of information of unpublished studies or grey literature. Even though, a great variety of studies were screened (4,414 articles). Moreover, the chosen databases included the main peer reviewed journals of the field and probably all high-quality population-based salivary studies were included in our research. Secondly, even adopting strategies to collect detailed information of all studies, as send e-mail to authors, eight potential articles were excluded due not provide prevalence data, and it is not clear their influence on the overall result. Moreover, language restriction was applied and some specific countries prevalences were not considered, but only three articles were excluded by such reason, being in Hebrew, Chinese and Hungarian. Finally, we cannot fully explain the heterogeneity found based on the included variables. Hence we encourage the development of further studies addressing other potential sources of heterogeneity in salivary research.
Table 6. Overall prevalence of Xerostomia and Hyposalivation and subgroup analysis according to methodological characteristics
Methodological characteristics
Xerostomia
pa
Hyposalivation
pa
Prevalence % (95%CI) Prevalence % (95%CI)
Age of the participants 0.469 0.220
Only adults 20.8(10.6-30.9) 26.0(-0.5-56.0)
Only elders 27.2(21.4-33.0) 20.0(13.0-27.0)
Adults and elders 13.4(11.3-15.5) 3.0(2.0-4.0)
Geographic location 0.327
Europe 22.7(13.2-32.2) 20.0(14.0-26.0) 0.238
Australasia 22.3(14.0-30.6) 15.0(8.0-21.0)
Americas 25.9(17.2-34.7) 35.0(31.0-40.0)
Heterogeneity (I2): 99.8% 99.4%
Heterogeneity
Explained (R2)b: 13.82% 9.15%
Braz Dent J 29(6) 2018
617
Overall prevalence of dry mouth
The studies included were conducted mostly in high-income countries, except for one study in Mexico. Considering that the occurrence of chronic diseases and aging are rather socially determined, and social inequality manifests differently and perhaps more acutely in poorer countries, it is possible that the overall dry mouth prevalence estimate may have been different had more data from those countries been available. It is also important to emphasize the need for more information from prospective cohort studies, including from younger populations (34) and consider the high presence of specific chronic diseases, such asthma that could influence xerostomia through medicines, in order to better understand the history of dry mouth and its effects (9).
Another important factor to consider is that the estimated prevalence rate highly depends on the method used to measure dry mouth. Xerostomia is not necessarily accompanied by lower salivary flow rate (7,10,13). In this context, Thomson et al. (15) reported that xerostomia and hyposalivation occurred together in only 6% of their overall sample, and that this was equivalent to only one in six of the 36% of individuals who had either condition. The measurement methods used may over- or underestimate xerostomia, a fact widely discussed by Thomson et al. (21). These findings emphasize the need for further work on existing and new clinical measures, including the most recent ones working with scales for epidemiological use to measure the prevalence of xerostomia. Alternatively, researchers may be required to reach a consensus on which of the many currently available measures should be used. There is still much to find out about dry mouth and its associations (41). Despite diverse approaches to the condition’s measurement, just over one in four people in adult age or older suffer from xerostomia, with higher rates observed among elderly.
Resumo
O objetivo do estudo é revisar sistematicamente a literatura afim de estimar a prevalência global de xerostomia/hiposalivação em estudos epidemiológicos. Uma busca eletrônica foi conduzida até Fevereiro de 2018 sem restrições de linguagem. Um total de 5760 títulos foram inicialmente identificados e somente vinte e nove artigos foram incluídos na revisão e meta-análise após dois revisores independentes aplicarem os critérios de seleção. Os artigos foram extraídos das bases de dados PubMed/Medline e Web of Science. Os critérios de elegibilidade incluíram investigações originais de estudos observacionais de base populacional os quais reportaram a prevalência de xerostomia ou dados que permitissem o cálculo da prevalência de xerostomia e/ou hiposalivação. Estudos realizados em populações com condições de saúde específicas, revisões de literatura, relato de casos e estudos antropológicos, assim como, conferências ou comentários foram excluídos. Tamanho amostral, localização geográfica aonde foi realizado o estudo, desenho do estudo, idade da população estudada, métodos de diagnóstico e o critério de avaliação para determiner xerostomia e/ou hiposalivação foram extraídos para a meta-análise e metaregressão. Análise de meta-regressão multípla foi realizada para explorar a heterogeneidade entre os estudos.
A prevalência global estimada de boca seca foi de 22.0% (95%IC 17.0-26.0%). Uma maior prevalência de xerostomia foi observada em estudos realizados exclusivamente em populações idosas. Apesar de diferentes abordagens utilizadas para mensurar as condições de interesse, cerca de uma em quatro pessoas é acometida por xerostomia, com taxas mais elevadas sendo observadas na população idosa. Além disso, os métodos de mensuração podem ter super- ou subestimado os valores de xerostomia. Os achados do presente estudo salientam a necessidade de mais estudos acerca das existentes e novas formas de avaliação clínica, os quais serão úteis para determinar qual é a mais confiável para as perspectivas clínicas e epidemiológicas.
References
1. Johansson AK1, Johansson A, Unell L, Ekbäck G, Ordell S, Carlsson GE. Self-reported dry mouth in Swedish population samples aged 50, 65 and 75 years. Gerodontology 2012;29:e107-e115.
2. Castrejon-Perez RC, Borges-Yáñez SA, Gutiérrez-Robledo LM, Ávila-Funes JA. Oral health conditions and frailty in Mexican community-dwelling elderly: a cross sectional analysis. BMC Public Health 2012;12:773.
3. Alaraudanjoki V, Laitala ML, Tjäderhane L, Pesonen P, Lussi A, Ronkainen J. Influence of Intrinsic Factors on Erosive Tooth Wear in a Large-Scale Epidemiological Study. Caries Res 2016;50:508-516.
4. Thomson WM, Poulton R Broadbent, JM Al-Kubaisy S. Xerostomia and medications among 32-year-olds. Acta Odontol Scand 2006;64:249-254.
5. Benn AM, Broadbent JM, Thomson WM. Occurrence and impact of xerostomia among dentate adult New Zealanders: findings from a national survey. Aust Dent J 2015;60:362-367.
6. Ichikawa K, Sakuma S, Yoshihara A, Miyazaki H, Funayama S, Ito K, et al. Relationships between the amount of saliva and medications in elderly individuals. Gerodontology 2011;28:116-120.
7. Iwasaki M, Yoshihara A, Ito K, Sato M, Minagawa K, Muramatsu K. Hyposalivation and dietary nutrient intake among community-based older Japanese. Geriatr Gerontol Int 2016;16:500-507.
8. Reichart PA. Oral mucosal lesions in a representative cross-sectional study of aging Germans. Community Dent Oral Epidemiol 2000;28:390-398.
9. Thomson WM. Issues in the epidemiological investigation of dry mouth. Gerodontology. 2005;22:65-76.
10. Gilbert GH, Heft MW, Duncan RP. Mouth dryness as reported by older Floridians. Community Dent Oral Epidemiol 1993;21:390-397. 11. Hochberg MC, Tielsch J, Munoz B, Bandeen-Roche K, West SK, Schein
OD. Prevalence of symptoms of dry mouth and their relationship to saliva production in community dwelling elderly: the SEE project. Salisbury Eye Evaluation. J Rheumatol 1998;25:486-491.
12. Jacobsson LT, Axell TE, Hansen BU, Henricsson VJ, Lieberkind K, Lilja B, et al. Dry eyes or mouth - an epidemiological study in Swedish adults, with special reference to primary Sjogren’s syndrome. J Autoimmun 1989; 2:521-527.
13. Anttila SS, Knuuttila ML, Sakki TK. Depressive symptoms as an underlying factor of the sensation of dry mouth. Psychosom Med 1998;60:215-218.
14. Ekback, G Astrom, AN Klock K, Ordell S, Unell L. Variation in subjective oral health indicators of 65-year-olds in Norway and Sweden. Acta Odontol Scand 2009;67:222-232.
15. Thomson WM, Chalmers JM, Spencer, AJ Ketabi M. The occurrence of xerostomia and salivary gland hypofunction in a population-based sample of older South Australians. Spec Care Dentist 1999;19:20-23. 16. Locker, D. Dental status, xerostomia and the oral health-related quality
of life of an elderly institutionalized population. Spec Care Dent 2003 23:86-93.
17. So JS, Chung SC, Kho HS Kim, YK Chung JW. Dry mouth among the elderly in Korea: a survey of prevalence, severity, and associated factors. Oral Surg Oral Med Oral Pathol Oral Radiol Endod 2010;110:475-483. 18. Narhi TO Ainamo, A; Meurman, JH. Salivary yeasts, saliva, and oral
mucosa in the elderly. J Dent Res 1993;72:1009-1014.
Braz Dent J 29(6) 2018
618
B
. A. Agostini.
M; et al. Findings from the oral health study of the Danish Health Examination Survey 2007-2008. Acta Odontol Scand 2013;71:1560-1569.
20. Osterberg T Birkhed D, Johansson C; Svanborg A. Longitudinal study of stimulated whole saliva in an elderly population. Scand J Dent Res 1992;100:340-345.
21. Thomson, WM. Subjective Aspects of Dry Mouth, in: Carpenter, Guy. (Ed.), Dry Mouth. A Clinical Guide on Causes, Effects and Treatments. 2015. Springer, Heidelberg, pp 103-115.
22. Ryberg, M; Moller, C; Ericson, T. Saliva composition and caries development in asthmatic patients treated with beta-2 adrenoceptor agonists: A 4-year follow-up study. Scand J Dent Res 1991; 99:212–8. 23. Global Initiative for Asthma (GINA), Global Strategy for Asthma
Management and Prevention. 2017.
24. Orellana MF, Lagravere MO, Boychuk DG, et al. Prevalence of xerostomia in population-based samples: a systematic review. J Public Health Dent 66;152-158.
25. DerSimonian R, Laird N. Meta-analysis in clinical trials, Control Clin Trials 1986;7:177-188.
26. Hay EM, Thomas E, Pal B, Hajeer A, Chambers H, Silman AJ. Weak association between subjective symptoms or and objective testing for dry eyes and dry mouth: results from a population based study. Ann Rheum Dis 1998;57:20-24.
27. Ohara Y, Hirano H, Yoshida H. Prevalence and factors associated with xerostomia and hyposalivation among community-dwelling older people in Japan. Gerodontology 2016;33:20-27.
28. Caplan DJ, Hunt RJ. Salivary flow and risk of tooth loss in an elderly population. Community Dent Oral Epidemiol 1996;24:68-71. 29. Lee YS, Kim HG, Moreno K. Xerostomia among older adults with low
income: nuisance or warning? J Nurs Scholarsh 2016;48:58-65. 30. Ranganath L, Shet R, Rajesh A, Saliva: a powerful diagnostic tool for
minimal intervention dentistry. J Contemp Dent Pract 2012;13:240– 245.
31. Mazzoleni S Stellini E, Cavaleri E, Angelova Volponi A, Ferro R, Fochesato Colombani S. Dental caries in children with asthma undergoing treatment with short-acting beta2-agonists. Eur J Paediatr
Dent 2008;9:132–138.
32. Silva MF, Leite FRM, Ferreira LB, Pola NM, Scannapieco FA, Demarco FF, et al.. Estimated prevalence of halitosis: a systematic review and meta-regression analysis. Clin Oral Invest 2018;2247-55.
33. Locker D, Xerostomia in older adults: a longitudinal study. Gerodontology 1995;12:18-25.
34. Rawal Hoffman, HJ Bainbridge KE. Prevalence and Risk Factors of Self-Reported Smell and Taste Alterations: Results from the 2011-2012 US National Health and Nutrition Examination Survey (NHANES). Chem Senses 2016;41,69-76.
35. da Silva L, Kupek E, Peres KG. General health influences episodes of xerostomia: a prospective population-based study. Community Dent Oral Epidemiol 2017;45:153-159.
36. Quandt, SA; Savoca, MR; Leng, X; et al. Dry mouth and dietary quality in older adults in North Carolina. J Am Geriatr Soc 2011;59:439-445. 37. Nederfors T Isaksson, R Mornstad H; et al. Prevalence of perceived
symptoms of dry mouth in an adult Swedish population-relation to age, sex and pharmacotherapy. Community Dent Oral Epidemiol 1997;25: 211-216.
38. Tootla R Toumba, KJ Duggal MS. An evaluation of the acidogenic potential of asthma inhalers. Arch Oral Biol 2004;49:275–283. 39. Sag C Ozden, FO Acikgoz G. The effects of combination treatment
with a long-acting b2-agonist and a corticosteroid on salivary flow rate, secretory immunoglobulin A, and oral health in children and adolescents with moderate asthma: a 1-month, single-blind clinical study. Clin Ther 2007;29:2236–2242.
40. Osterberg T, Landahl S, Hedegard B. Salivary flow, saliva, pH and buffering capacity in 70-year-old men and women. Correlation to dental health, dryness in the mouth, disease and drug treatment. J Oral Rehabil 1984;11:157-170.
41. Mochida Y, Yamamoto T, Fuchida S, Aida J, Kondo, K. Does poor oral Health status increase the risk of falls?: The JAGES project longitudinal study. Plos One 2018;13:e0192251.