Rev Bras
Cineantropom
Hum
DOI: http://dx.doi.org/10.5007/1980-0037.2018v20n1p82
original article
Profiling and predicting performance of indoor
rock climbers
Perfil e predição do desempenho de escaladores indoor
Hamid Arazi1
Amir Rashidlamir2
Mohammad Zahed Abolhasani1
Somayeh Askari Hosaini2
Abstract – The aim of this study is to establish somatotype and profile the anthropometric and biomotor characteristics of indoor rock climbers. Fourteen elite level male and ten recreational female Iranian indoor rock climbers completed a battery of tests. All anthro-pometric measurements were performed according to the recommendations of interna-tional standards for anthropometric assessment. Upper body strength and endurance were assessed by isometric tests. Explosive power and balance were also evaluated by Sargent jump and Star Excursion Balance Test (SEBT), respectively. Samples’ somatotypes were calculated by the method of Heath and Carter. Pearson’s correlation coefficient and partial correlations were calculated and stepwise multiple regression analyses were implemented to determine a set of best predictors of elite male climbers’ ability. Shoulder width, body fat content, upper-body strength and endurance for females, showed the most correlation with the climbing ability (range: r = 0.46–0.7, p ≤ 0.05), while among the male samples, these correlations with the climbing ability were mostly between WHR, absolute and relative to body mass handgrip strength, SEBT performance and the left-hand digit ratio. The results of stepwise multiple regression revealed that the SEBT performance in the posterior direction of right foot stance and Upper Extremity Girth Index are able to explain 62% of the variance of climbing ability. It is likely that decreasing the fat mass has no direct impact on the climbers’ performance. Also, SEBT performance is able to predict 35% of climbing performance. Hence, it seems balance exercises could be effective in improvement of climbing performance.
Key words: Anthropometry; Sports medicine; Postural balance; Muscle strength; Moun-taineering.
Resumo – O objetivo do estudo foi estabelecer o somatotipo, o perfil antropométrico e neuromotor de escaladores indoor. Quatorze atletas do sexo masculino de elite e 10 atletas recreacionais do sexo feminino do Irã da modalidade escalada indoor participaram da pesquisa. Todas as medidas antropométricas foram coletas conforme padronizações internacionais. Força e resistência dos membros superiores foram avaliadas por teste isométrico. Força explosiva e equilíbrio foram avaliados pelos testes Sargent jump e Star Excursion Balance (SEBT), respectivamente. O somatotipo foi calculado pelo método Heath e Carter. O coeficiente de correlação de Pearson, cor-relações parciais e a análise de regressão múltipla foram utilizados. Largura do ombro, percentual de gordura corporal, força e resistência dos membros superiores para as mulheres apresentaram correlação positiva com a capacidade de escalar (ranque: r = 0,46–0,70, p ≤ 0,05). Para os homens, a habilidade de escalar foi associada com a razão cintura estatura, força de preensão manual absoluta e relativa à massa corporal, ao equilíbrio e a proporção digital da mão esquerda. O desempenho no SEBT e o índice de circunferência dos membros superiores tiveram o poder de explicar 62% na variação da capacidade de escalar. É provável que diminuir a massa de gordura não tenha impacto direto no desempenho dos escaladores. Além disso, o desempenho do SEBT é capaz de prever 35% do desempenho de escalada. Portanto, parece que os exercícios de equilíbrio podem ser eficazes na melhoria do desempenho de escalada.
1 University of Guilan. Faculty of Sport Sciences. Department of Exer-cise Physiology. Rasht. Iran. 2 Ferdowsi University of Mashhad. Faculty of Physical Education and Sport Sciences. Department of Exer-cise Physiology. Mashhad. Iran.
Received: 10 May 2017
INTRODUCTION
According to the International Federation of Sport Climbing (IFSC) reports, the number of people who are climbing regularly amounts to 25
million people from 62 countries on five continents1. Moreover, the rate
of development is noticeable with daily number of 3000 people climbing for the first time, also the number of climbing gyms have experienced an
increase of 50 percent from 2007 to 20121.
The number of scientific researches on sport climbing, had a steady increase over the last decade. Many of these studies conducted surveys on
the anthropometric and physiologic characteristics of climbers2-5, specific
climbing training6 and analysis of climbing performance7. Direct
compari-son between studies regarding anthropometry and physiologic profiles, is however difficult due to various measured variables and different methods of assessment. Nevertheless, many of the articles characterize the elite
climbers as being small in stature, with low percentage body fat8,9 and high
ratio of hand grip strength to body mass and high dynamic and isometric
muscular endurance9. However, there are different results leading to
rela-tive ambiguity in the success factors in climbing10,11. Therefore, further
investigation required in order to determine these factors.
To the authors’ knowledge much of the scientific literature on climbing focuses on the male adults. Furthermore, it may be other variables like static and dynamic balance, 2D:4D ratio, lower body explosive power and somatotype of climbers are effective in the better understanding of climb-ing performance. Despite the significant development of sport climbclimb-ing in
Asia, there are scarce researches in this field, including Wong et al.12 studied
on the strength profiles of shoulder rotators in healthy sport climbers and
non-climbers and Askari et al13 studied the prevalence of sport injuries
in Iranian climbers. Regarding ethnic differences, black people have
rela-tively long limbs in comparison to Asian ones14, therefore determination
of anthropometric and biomotor profile of Asian climbers is necessary. The primary objective of this study is to establish somatotype and profile the anthropometric and biomotor characteristics of young elite male and recreational female climbers. Secondly, this study is aimed to predicting of elite climbers’ performance. The results of the present study will provide an improved understanding about the indoor rock climbing performance that will assist coaches to plan efficient training programs and identify talented climber.
METHODOLOGICAL PROCEDURES
Subjects
were having at least one year experience in climbing, regular training in the last six months, reaching to complete puberty, no sport injuries and chronic disease. Lack of national climbing competition experience and using progesterone drugs were the exclusion criteria for male and female, respectively. Accordingly, six men and two women were excluded.
Experimental design
Testing was performed in the subjects’ climbing gyms, during their train-ing season in the eventrain-ing (3 to 8 PM). This was done in sprtrain-ingtime. The sequence of testing was based on recommended sequence in American
Col-lege of Sports Medicine guidelines15. Warm up was consisted of 10-minute
jogging, upper and lower body muscle stretching with emphasis on the adductor leg muscles. Climbing ability was determined as the most dif-ficult climb completed on boulder rated by the Yosemite Decimal System
(YDS)16. For this study, climbing ability was converted into a standard
numerical scale, according to recommended climbing grade metric scale
of International Climbing and Mountaineering Federation (UIAA)16.
Anthropometric Assessment
All anthropometric measurements were performed according to the recom-mendations of International Standards for Anthropometric Assessment by International Society for the Advancement of Kinanthropometry (ISAK) and the American College of Sports Medicine (ACSM) by well-trained technicians. These measurements included standing and sitting height, body mass, nine skinfold thicknesses, arm span, eight girths and six bone breadths. The 2D:4D ratio was also determined according to the method of
Manning et al.17 by utilizing Mitutoyo electronic digital calipers (Mitutoyo,
Model 500-151-20, China) measuring 0.01 mm. Nine skinfold measure-ments were done by means of calibrated skinfold calipers (Lafayette, Model 1127, USA) measuring 0.01 mm. Climbers’ body density were estimated
by two different methods including four site Durnin and Womersley18
method for both sexes; the procedures of seven site Jackson and Pollock19
and Jackson et al.20 were used for males and females respectively. Body
fat percentage was calculated by the Brozek equation21. Somatotypes
were calculated by the method of Heath and Carter22. Eight indices were
calculated by the measured anthropometric variables23.
Biomotor Assessment
In order to estimate the static and dynamic balance, standing Stork and Star Excursion Balance tests were applied, respectively. For standing Stork test, the subject stood on one leg with the contralateral hip and knee flexed such that the toes were touching the opposite knee. Hands remained on the hips. Upon “go,” the climber plantar flexed onto his/her toes and the tester began timing with a stopwatch. The subject remained in this position for
as long as they could. The longest time among three trials was recorded15.
leg with maximum reach of the opposite leg. The four lines represented the anterior, medial, posterior, and lateral directions. The athlete kept a single-leg stance while reaching with the contralateral leg as far as possible
for each taped line lightly touches the furthest point possible15,24.
For evaluation of lower-body explosive power, Sargent jump test was performed. The test was performed from countermovement with the arm
swing as suggested by the original protocol25; the athlete jumped as high
as possible and touched the highest possible point on the wall.
Bent arm hang test was performed base on procedure of Eurofit26
which is used in the study of Grant et al.3. The subjects gripped the ‘mini
jug holds’ with dimension of 4.5×9×13 cm which was on the climbing wall. Time was calculated when subjects positioned elbow joints in angle of ap-proximately 90 degree so they had to lift their chin in the same height of
the holds. In order to estimate maximum number of pull-ups3, participants
gripped the ‘mini jug holds’ with hanging from full arm extension. Then, they pulled the body up until the chin had reached a point on the holds (elbow joints flexed completely).
Leg span was measured according to study of Grant et al.3. The subject’s
leg span was determined while they laid flat in a supine position and placed their feet as far apart as possible with straight knees.
For estimation of maximum isometric strength, a set of three dy-namometers (Saehan Corporation, Masan, South Korea) were utilized. Tests were performed in an extended forearm positions, and also both hands were examined subsequently with the resting time of 30 sec. Grip strength was measured by using the digital hand dynamometer (Saehan, Model SH5000DP) with measuring 0.1 Kg. This device was adjustable so that the middle phalanx lined up with the handle. Pincer strength was determined by a pincer dynamometer (Pinch Gauge, Model SH5000DP). Squeezing strength was estimated by means of bulb dynamometer (Squeeze, Model SH5008); the highest values of these dynamometers were recorded.
Statistical analyses
The data were tested for the normal distribution by Shapiro wilk test. All variables are reported in mean ±SD format. In order to identify possible relationships between climbing ability and independent variables, Pearson’s correlation coefficient and partial correlations were calculated. Stepwise multiple regression analyses were also employed to determine a set of best elite male climbers’ ability predictors. Statistical analyses were carried out using a Statistical Package for Social Sciences (SPSS 16.0 for windows). The significance level was set as p ≤ 0.05.
RESULTS
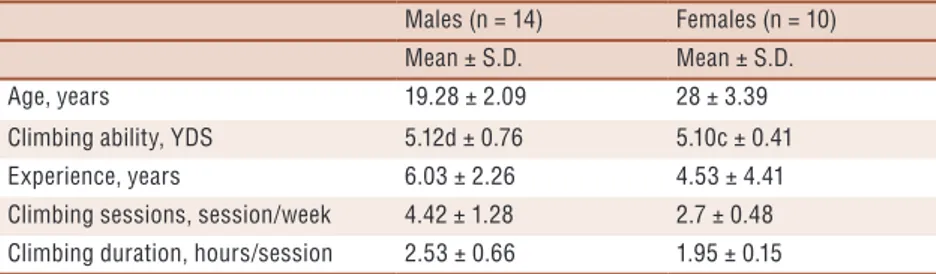
Demographic data are presented in table 1. The average age of male subjects
Table 1. Demographic characteristics of participants in the study
Males (n = 14) Females (n = 10)
Mean ± S.D. Mean ± S.D.
Age, years 19.28 ± 2.09 28 ± 3.39
Climbing ability, YDS 5.12d ± 0.76 5.10c ± 0.41
Experience, years 6.03 ± 2.26 4.53 ± 4.41
Climbing sessions, session/week 4.42 ± 1.28 2.7 ± 0.48
Climbing duration, hours/session 2.53 ± 0.66 1.95 ± 0.15
S.D.: standard deviation.
Table 2 presents the data about somatotype and anthropometric characteristics of climbers and their resulting indices. This table shows male and female climbers were mesomorph-ectomorph and mesomorphic-endomorph, respectively.
Table 2. Anthropometric characteristics of participants. The values are in mean and standard deviation.
Females (n = 10) Males (n = 14)
Mean ± S.D. Mean ± S.D.
General characteristics
Body mass, kg 53.32 ± 5.58 62.30 ± 5.66
Height, cm 160 ± 5.89 174.64 ± 6.08
Sitting height, cm 85 ± 3.68 91.45 ± 2.96
Arm span, cm 159.67 ± 6.44 176.68 ± 8.41
Girths, cm
Ankle, minimum 20.24 ± 0.98 21.47 ± 1.14
Calf, maximum 33.88 ± 2.44 33.52 ± 1.25
Gluteal, hips 93.45 ± 4.43 88.77 ± 3.30
Waist, minimum 69.81 ± 4.91 71.30 ± 3.05
Wrist, distal styloids 15.01 ± 0.84 16.57 ± 0.73
Forearm, maximum 22.86 ± 0.97 26.83 ± 1.16
Arm girth, relaxed 24.77 ± 1.66 27.62 ± 1.21
Arm girth, flexed and tensed 26.77 ± 2.02 29.95 ± 1.90
Bone breadths, cm
Biacromial 29.65 ± 1.88 39.33 ± 3.77
Biilocristal 25.27 ± 2.2 27 ± 2.13
humerus 5.78 ± 0.35 6.61 ± 0.34
Femur 8.78 ± 0.58 9.95 ± 0.88
Bone lengths, cm
Foot 23.5 ± 1.10 25.61 ± 1.17
Lower limb 89.05 ± 3.87 91.28 ± 4.56
Midstylion-dactylion 17.07 ± 0.73 18.87 ± 0.84
Upper limb 73.82 ± 3.09 76.51 ± 3.12
Somatotype characteristics
Endomorphic 5.16 ± 1.41 1.87 ± 0.52
Mesomorphic 3.59 ± 1.00 4.03 ± 0.50
Females (n = 10) Males (n = 14)
Mean ± S.D. Mean ± S.D.
Somatic indices
BMI 20.19 ± 1.94 20.45 ± 1.09
WHR 0.74 ± 0.03 0.79 ± 0.01
Ape index 0.99 ± 0.02 1 ± 0.03
Rohrer’s index 1.29 ± 0.13 1.16 ± 0.07
Left-hand 2D:4D 1.01 ± 0.05 0.97 ± 0.02
Right-hand 2D:4D 0.99 ± 0.05 0.98 ± 0.02
Arm length index 0.45 ± 0.00 0.43 ± 0.01
Manouvrier’s index 1.4 ± 0.03 0.99 ± 0.04
Hip-to-shoulder ratio 0.85 ± 0.08 0.68 ± 0.6
Upper extremity girth index 0.91 ± 0.03 0.96 ± 0.04
S.D.: standard deviation.
In order to make comparison with the other surveys, the body fat content was estimated in three different forms (percentage body fat, the skinfold thickness measurements and the sum of four, seven and nine skinfolds) which are observable in table 3.
Table 3. Body fat content characteristics of participants in the study
Males (n=14) Female (n=10)
Mean ± S.D. Mean ± S.D.
Fat mass, %a 9.81 ± 2.23 19.63 ± 3.46
Fat mass, % b 6.17 ± 1.65 25.96 ± 4.59
Sum of 4 skinfolds, mmc 22.91 ± 4.98 56.7 ± 17.7
Sum of 7 skinfolds, mmd 47.32 ± 10.99 142.95 ± 36.33
Sum of 9 skinfolds, mme 55.80 ± 12.18 168.98 ± 40.72
Skinfolds, mm
Triceps 7.24 ± 1.55 `18.49 ± 6.3
Biceps 2.87 ± 0.68 6.73 ± 1.74
Subscapular 8 ± 1.72 15.7 ± 5.61
Abdominal 9.09 ± 3.3 24.99 ± 6.29
Chest 3.96 ± 1.07 16.78 ± 4.99
Midaxillary 5.41 ± 0.93 14.29 ± 5.12
Medial calf 5.60 ± 1.02 19.29 ± 4.94
Thigh 8.83 ± 3.24 35.82 ± 6.96
Suprailiac 4.80 ± 1.5 15.91 ± 5.37
S.D.: standard deviation. a Measured using Durnin and Womersley. b Measured using Jackson et al for female and Jackson and Pollock for male. c 4 sites: biceps, triceps, subscapular and suprailiac. d 7 sites: thigh, suprailiac, triceps, subscapular, chest, abdomen and midaxillary. e 9 sites: thigh, suprailiac, triceps, subscapular, chest, abdomen, midaxillary, biceps and medial calf.
The results of biomotor characteristics are illustrated in the table 4. Table 5 presents the results of Pearson correlation test with the aim of explanation the correlation between selected variables and the climbing ability. Infor-mation about the stepwise multiple regression analysis and the prediction
equation of elite male climbers’ performance present below. In this equation, standard error of the estimation was 0.50 and the result of Durbin-Watson test was also calculated as 2.03. The present survey reveals that, for the first time, SEBT performance and circumference of forearm play an important role in the prediction of climbers’ performance; they are able to explain 62% of climbers’ performance. After adjusting, the percentage reached to 56%.
Climbing performance = - 5.14 + 0.04 (SEBT R [Posterior]) + 8.64 (Upper extremity girth index)
Table 4. Biomotor characteristics of participants.
Males (n = 14) Females (n = 10)
Mean ± S.D. Mean ± S.D.
Grip strength (kg) 56.90 ± 8.19 33.15 ± 3.52
Grip strength/body mass 0.91 ± 0.12 0.61 ± 0.07
Diff grip strength (kg)a 2.43 ± 1.73 2.83 ± 2.04
Pincer strength (kg) 11.29 ± 1.45 7.08 ± 1.94
Pincer strength/body mass 0.17 ± 0.03 0.12 ± 0.03
Diff pincer strength(kg)a 0.89 ± 0.68 1.01 ± 0.81
Squeeze strength (kg) 36.96 ± 5.87 20.61 ± 4.34
Squeeze strength/body mass 0.58 ± 0.08 0.38 ± 0.06
Diff squeeze strength (kg)a 2.17 ± 1.86 2.37 ± 2.41
Leg span (cm) 140.64 ± 15.28 125.95 ± 12.31
Vertical jump height (cm) 51.23 ± 6.24 32.65 ± 5.45
Pull-ups (n) 24.85 ± 5.43 5.4 ± 3.94
Bent arm hang (s) 58.33 ± 16.19 27.14 ± 17.46
Static balance R (s)b 27.17 ± 16.26 16.83 ± 18.76
Static balance L (s)c 23.47 ± 15.71 15.43 ± 13.32
SEBT Rd, b
Anterior 87.64 ± 5.62 92.5 ± 4.76
Lateral 91.28 ± 9.92 91 ± 12
Posterior 115.36 ± 9.65 104.2 ± 6.59
Medial 108.29 ± 6.28 95.5 ± 7.01
SEBT Ldc
Anterior 89 ± 5.56 92.1 ± 4.3
Lateral 93.64 ± 10.16 87.2 ± 10.01
Posterior 117.14 ± 8.96 98.9 ± 8.63
Medial 105.64 ± 5.69 98.3 ± 5.9
S.D.: standard deviation. a Different left to right hand. b Right limb stance. c Left limb stance. d Normalized by percentage of leg length.
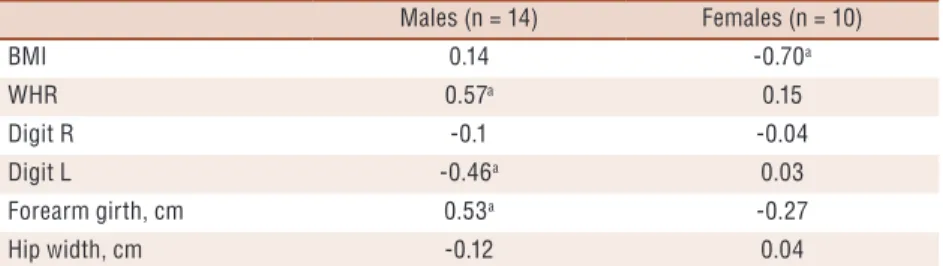
Table 5. Correlation between selected characteristics and climbing ability in participants of the study
Males (n = 14) Females (n = 10)
BMI 0.14 -0.70a
WHR 0.57a 0.15
Digit R -0.1 -0.04
Digit L -0.46a 0.03
Forearm girth, cm 0.53a -0.27
Hip width, cm -0.12 0.04
Males (n = 14) Females (n = 10)
Shoulder width, cm 0.15 0.68a
Leg span, cmb 0.29 0.31
Rohrer’s index 0.12 -0.70a
Manouvrier’s index -0.41 0.36
Ape index -0.15 -0.45
Upper extremity girth index 0.53a 0.33
Hip-to-shoulder ratio -0.26 -0.44
Fat mass, % -0.04 -0.61a
Vertical jump height, cm 0.23 0.33
Grip strength, kg 0.53a 0.1
Grip strength/body mass 0.52a 0.51
Diff grip strength, kg 0.2 -0.27
Pincer strength, kg 0.27 0.41
Squeeze strength, kg 0.34 -0.14
Bent arm hang, s 0.23 0.3
Pull-ups, n 0.08 0.57a
SEBT R, cm
Anterior 0.22 0.51
Lateral 0.53a 0.2
Posterior 0.59a -0.03
Medial 0.59a -0.1
SEBT L, cm
Anterior 0.18 -0.03
Lateral 0.49a 0.1
Posterior 0.49a 0.18
Medial 0.47a 0.21
Endomorphic -0.12 -0.64a
Mesomorphic -0.09 -0.71a
Ectomorphic -0.13 0.72a
a P ≤ 0.05. b Adjusted for leg length of each subject by means of partial correlation.
DISCUSSION
In spite of the fact that previous surveys have emphasized on static and
dynamic balance in the climbers’ performance as an imperative factor5,8, but
they have not estimated these variables in climber. Probably, one of possible reasons is that there is not any reliable and specific test for evaluation of climber’s balance. In the present study, SEBT and Stork test are assisted similar to estimate the climber’s balance, since they are simple, inexpensive and accessible; also, they are more similar to the climbing movement pat-tern than other tests. The results indicate that SEBT performance have significant correlation with the ability of male climber in all directions; with exception of anterior. In respect of movement patterns, these tests are identity to climbing technique so this correlation is understandable. Furthermore, WHR in male subjects showed a significant correlation (r = 0.57) with the SEBT performance; indeed, when hip circumference lower
than waist circumference, the score of SEBT performance increased. It is assumed that fat surrounding the hip affects the hip range of motion. This assumption is reinforced, since the correlation between WHR and SEBT performance in the posterior and lateral are stronger than the ante-rior and medial directions (r = 0.67 and r = 0.75 VS. r = 0.53 and r = 0.61, respectively). Conversely, there was a weak correlation between SEBT performance and climbing ability in females. It is interesting that female subjects were slightly stronger in the anterior direction of both limbs than males; however, the posterior direction of both limb of male subjects were stronger. The probable reasons for this difference could be the cumulative body fat in the hip area in female climbers. It is possible that SEBT per-formance in the anterior direction has lower impact on body fat of hip area.
Males’ performances are significantly higher than that of females in the Stork test of both limbs. However, there is no correlation between the Stork performance and the climbers’ ability in both genders regarding the weak performance of subjects in this test. Consequently, Stork test is not proper for the estimation of climbing ability.
The present study supported the results of Mermier et al.4 declaring
that the fat percentage in females is more than 2 times higher than that of males; however, when it is compared with the reported data of Grant
et al.2, female subjects of our study showed less body fat percentage (19.63
± 3.46% VS. 24.8 ± 3.7%). Comparison with the results of Grant et al.2
seems more logical as it is relatively similar in subjects’ age, climbing ability and the method used in fat estimation. Body fat percentage in
males was similar to the results of Mermier et al.4, while it was lower
than that of Grant et al.3 (9.81 ± 2.23% VS. 9.8 ± 3.5% and 14 ± 3.7%,
respectively). In addition, body fat percentage for male subjects was
slightly more than that of the results of Watts et al.5 (6.17 ± 1.65% VS.
4.7 ± 1.3%). Moreover, the correlation between body fat percentage and climbing ability in female was significant (r = -0.66); while there was no correlation between them in the case of male subjects. Also, the correla-tion between females’ climbing ability and weight (r = -0.48, p = 0.07) and BMI (r = -0.66, p < 0.05) were moderate and strong, respectively. In spite of strong correlation among all females’ body fat variables and climbing ability, and also the maximum value related to the Suprailiac (r = -0.75), these correlations for males were not significant. However, in a study of semifinalists at World Cup sport climbing competition it was shown that body fat percentage and the ratio of grip strength to body
mass were the best predictors for climbing ability5. It is noticeable that,
low body fat percentage could not has direct effect on the improvement of climbing performance.
In this study, male subjects were shorter than the male subjects in the
work of Watts et al.5 and Grant et al.3, also their body mass was lower.
Likewise, females of this study were shorter than their counterparts in the
studies of Mermier et al.4 and Grant et al.3, and also their body mass were
lower. Thus, similar to previous studies, low body mass and short stature of climbers were confirmed.
In this research, ape index was almost equal with that of subjects in
previous studies4,27. Similar to the results of watts et al.27, this variable did
not show a significant correlation with the climbing ability. They stated that the reason of no correlation is small variability of ape index among subjects (SD = 0.02) and they considered the possibility of the ape index as an important indicator, when the other traits are equal. According to the present study, WHR with small variability (SD = 0.01) among subjects shows the significant correlation between this variable and climbing ability, so it is possible that the small variability of one variable could not be an acceptable reason for explaining no correlation.
Previous studies emphasized on the upper-body strength and
endur-ance in climbers8,9. For instance, there are studies which showed the
performance of elite climber in the bent arm hang and pull-up tests were
markedly higher than recreational climbers and non-climbers2,3. However,
the subjects of present study showed higher values than that of the previous researches in these two tests.
Digit ratio (2D:4D), a measurement of prenatal testosterone exposure, is weakly-to-moderately associated with increased physical performance,
although the evidence is far stronger for males than females28. In recent
years, several studies have evaluated the associations of the 2D:4D ratio with
athletic abilities28,29. In this study, as shown in the results of the other studies,
this ratio in men was lower than women. In addition, the only significant correlation was related to left-hand 2D:4D ratio with climbing ability for men (r = -0.46), although after modification of climbing experience by par-tial correlation, this correlation coefficient was not statistically significant
(r = -0.42, p = 0.07). In the recent study on female competitive rowers28 it
was reported that there are weak to-moderate correlations between right and left hand 2D:4Ds and race time (range: r = 0.29–0.32). Concerning that researchers have never conducted a study on the digit ratio in climb-ers, the results of this study could be valuable. Nevertheless, considering the small number of sample in this study, further research with the larger sample volume and expanded various abilities is necessary in the future.
It was for the first time that the explosive power was estimated by conducting the present study; it was shown that both groups of elite and recreational climbers have weak lower-body explosive power. Limited studies were carried out on anaerobic power of rock climber stating the
importance of this variable4. However, these studies have used Wingate
specificity for the climbers. Thus, it is not possible to conclude on it. Previous studies showed that handgrip strength in rock climbers is an
important factor5,8,9. Possibly, these are intrinsic muscles which transmit
the produced force by flexor muscles for more effective hold. Study of
Goldmann et al.30 assists to better understanding of this conjecture. They
asserted that seven week training for improvement of the toe flexor muscles strength, by itself could provoke to increase the performance of horizontal jump significantly in comparison with the control group. Consequently, It could be concluded that strengthening the intrinsic muscles of hand (without concerning the climbing movement pattern) results in more ef-ficient transmission of force to the climbing holds and it could help climber to the gripping the hold longer.
Watts9 believes that handgrip dynamometry is only similar to the
pinch grip position in climbing. Thus, he states that the measurement of hand strength via grip dynamometry may lack specificity with most hand
positions required during actual rock climbing9. In addition, there are
sev-eral differences between handgrip test and gripping the hold in climbing. First of all, most of the time the two hands of climber grip holds located on the top of their head, whilst in the test, two hands are never tested at the same time; also, dynamometer is in front of the climbers. Moreover, depending on the climbers’ positions on the climbing wall, whole or part of body mass is tolerated by hands, whereas body mass is never involved in the handgrip test by dynamometer. In spite of these differences, the present study showed that there is a significant correlation between hand-grip strength and climbing ability in male subjects. It is noticeable that in the interview with the Iranian elite climbers it was stated that they had showed stronger muscle than climbers of the other countries, whilst they had weak climbing technique in the international events.
The analysis of multiple regressions indicated that the SEBT perfor-mance in the posterior direction of right foot stance and Upper Extremity Girth Index are the best predictors for the climbing ability and they can
explain 62% of it. The study of semifinalists5 at World Cup sport
climb-ing competition revealed that ‘grip strength to body mass ratio’ and ‘body fat percentage’ are able to estimate 32% of climbing ability by means of stepwise regression analysis. The reason for this distinction in the results of these two studies is that in the present study, handgrip strength showed strong correlation with Upper Extremity Girth Index (r = 0.55, p = 0.02), although it was excluded from the regression analysis because of explaining
lower variance. Hence, it supported the results of Watts et al.5, in which
handgrip strength is one of the predicators of climbing ability which explains 24% of climbing ability exclusively. The present study only used the male climbers’ data for regression analysis, as there is considerable difference between men and women in the most of variables, and one of aims of this study was to identify characteristics that predict elite climbers’ performance. Thus, when males’ and females’ data are used in the analysis,
fat percentage will be identified as a climbing ability predictor.
One of the limitations of the studies in this area is the small number of subjects and the present study was not an exception. Furthermore, concerning the previous literature studies, it is likely that if psychological factors were concerned, different results could be achieved which is not accessible in the study. It should be claimed that the generalisability of the finding of this study is low as the age and ability of subjects in this study were limited.
CONCLUSION
In conclusion, anthropometric profile, upper-body strength and endurance characteristics of Iranian climber are similar to other studied climbers; also, females were more endomorph than males. Shoulder width, body fat content, upper-body strength and endurance for females, and WHR, absolute and relative to body mass handgrip strength, SEBT performance and the left-hand digit ratio in males, showed the most correlation with the climbing ability. However, the results of this study reveal that a large portion of the variance in climbing ability can be attributed to trainable variables, but the amount of unexplained variance is noticeable.
Acknowledgements
The authors would like to express their gratitude to all the rock climbers who participated in the study they also acknowledge Ali Kavoosi for his assistance. The authors have no professional relationships with companies or manufacturers that might benefit from the results of this study. There was no financial support for this project.
REFERENCES
1. International Federation of Sport Climbing. 2014; Available from: <http://www. ifsc-climbing.org/index.php/about-ifsc/what-is-the-ifsc/key-figures> [2014 dec 15)
2. Grant S, Hasler T, Davies C, Aitchison TC, Wilson J, Whittaker A. A comparison of the anthropometric, strength, endurance and flexibility characteristics of female elite and recreational climbers and non-climbers. J Sports Sci 2001;19(7):499-505.
3. Grant S, Hynes V, Whittaker A, Aitchison T. Anthropometric, strength, endur-ance and flexibility characteristics of elite and recreational climbers. J Sports Sci 1996;14(4):301-9.
4. Mermier CM, Janot JM, Parker DL, Swan JG. Physiological and anthropometric determinants of sport climbing performance. Br J Sports Med 2000;34(5):359-65.
5. Watts, PB, Martin DT, Durtschi S. Anthropometric profiles of elite male and female competitive sport rock climbers. J Sports Sci 1993;11(2):113-7.
6. López-Rivera E, González-Badillo JJ. The effects of two maximum grip strength training methods using the same effort duration and different edge depth on grip endurance in elite climbers. Sports Tech 2012;5(3-4):100-10.
7. Bertuzzi RCM, Franchini E, Kokubun E, Kiss MA. Energy system contributions in indoor rock climbing. Eur J Appl Physiol 2007;101(3):293-300.
CORRESPONDING AUTHOR Hamid Arazi
Department of Exercise Physiology, Faculty of Sport Sciences, University of Guilan
P.O. Box: 41635-1438, Rasht, Iran.
Email: [email protected]
9. Watts PB. Physiology of difficult rock climbing. Eur J Appl Physiol 2004;91(4):361-72.
10. Morrison AB, Schöffl VR. Physiological responses to rock climbing in young climbers. Br J Sports Med 2007;41(12):852-61.
11. Sheel A. Physiology of sport rock climbing. Br J Sports Med 2004;38(3):355-9.
12. Wong EK, Ng GY. Strength profiles of shoulder rotators in healthy sport climbers and nonclimbers. J Athl Train 2009;44(5):527-30.
13. Askari Hosaini S, Ebrahimi Atri A. Injuries at the Iranian championship in indoor rock climbing. Wilderness Environ Med 2013;24(2):167-83.
14. Rimoin DL, Borochowitz Z, Horton WA. Short stature - physiology and pathol-ogy. West J Med 1986;144(6):710-21.
15. Ratamess NA. Assessment and evaluation. In: ACSM’s foundations of strength training and conditioning; Lippincott Williams & Wilkins: Michigan, IN 2012. p. 451-88.
16. Schöffl V, Morrison A, Hefti U, Ullrich S, Küpper T. The UIAA Medical Com-mission injury classification for mountaineering and climbing sports. Wilderness Environ Med 2011;22(1):46-51.
17. Manning JT, Scutt D, Wilson J, Lewis-Jones DI. The ratio of 2nd to 4th digit length: a predictor of sperm numbers and concentrations of testosterone, luteinizing hormone and oestrogen. Hum reprod 1998;13(11):3000-4.
18. Durnin JVGA, Womersley J. Body fat assessed from total body density and its estimation from skinfold thickness: measurements on 481 men and women aged from 16 to 72 years. Br J Nutr 1974;32(01):77-97.
19. Jackson AS, Pollock ML. Generalized equations for predicting body density of men. Br J Nutr 1978;40(03):497-504.
20. Jackson AS, Pollock ML, Ward A. Generalized equations for predicting body density of women. Med Sci Sports Exerc 1979;12(3):175-81.
21. Brozek J, Grande F, Anderson JT, Keys A. Densitometric analysis of body composition: revision of some quantitative assumptions. Am NY Acad Sci 1963;110(1):113-40.
22. Heath BH, Carter J. A modified somatotype method. Am J Phys Anthropol 1967;27(01):57-74.
23. Tomaszewski P, Gajewski J, Lewandowska J. Somatic profile of competitive sport climbers. J Hum Kinet 2011;29:107-13.
24. Olmsted LC, Carcia CR, Hertel J, Shultz SJ. Efficacy of the star excursion balance tests in detecting reach deficits in subjects with chronic ankle instability. J Athl Train 2002;37(4):501-6.
25. Sargent DA. The physical test of a man. Am Phys Educ Rev 1921;26(4):188-94.
26. Adam C. Handbook for the eurofit tests of physical fitness. Italian national olympic committee, central direction for sport’s technical activities documentation and information division: Rome, Italy 1988.
27. Watts PB, Joubert L, Lish A, Mast J, Wilkins B. Anthropometry of young com-petitive sport rock climbers. Br J Sports Med 2003;37(5):420-4.
28. Hull MJ, Schranz NK, Manning JT, Tomkinson GR. Relationships between digit ratio (2D: 4D) and female competitive rowing performance. Am J Hum Biol 2015;27:157-63.
29. Hsu C-C, Su B, Kan N-W, Lai S-L, Fong T-H, Chi C-P, Chang C-C, Hsu M-C. Elite collegiate tennis athletes have lower 2D:4D ratios than those of nonathlete controls. J Strength Cond Res 2014;29(3):822-5.