ABSTRACT: The aim of this study was to determine the optimum plot size to evaluate the fresh matter of aerial part of dwarf pigeon pea
(Cajanus cajan (L.) Millsp), cultivar IAPAR 43 (Aratã), in scenarios formed
by combinations of numbers of treatments, number of replications,
and precision levels. The fresh matter of aerial part was weighed on
basic experimental units of 1 m × 1 m in three uniformity trials with
size of 24 m × 12 m (288 m2 in each trial). The soil heterogeneity index
of Smith was estimated. Also, the optimum plot size was determined
by Hatheway’s method in scenarios formed by combinations of
BASIC AREAS -
Article
Plot size related to numbers of treatments and
replications, and experimental precision in
dwarf pigeon pea
Alberto Cargnelutti Filho1*, André Lavezo2, Cláudia Marques de Bem2, Fernanda Carini2, Denison Esequiel Schabarum2, Cirineu Tolfo Bandeira2, Jéssica Andiara Kleinpaul2,
Cleiton Antonio Wartha3, Daniela Lixinski Silveira2, Rafael Vieira Pezzini2, Rosana Marzari Thomasi1,
Fernanda Martins Simões1, Ismael Mario Márcio Neu2
1.Universidade Federal de Santa Maria - Departamento de Fitotecnia - Santa Maria (RS), Brazil.
2.Universidade Federal de Santa Maria - Programa de Pós-Graduação em Agronomia - Santa Maria (RS), Brazil. 3.Universidade Federal de Viçosa - Programa de Pós-Graduação em Fitotecnia - Viçosa (MG), Brazil.
*Corresponding author: [email protected]
Received: Mar. 15, 2017 – Accepted: May 29, 2017
i treatments (i = 5, 10, 15, and 20), r replications (r = 3, 4, 5, 6, 7 8, 9,
and 10), and d precision levels (d = 5%, 10%, 15%, 20%, 25%, and
30%). In experiments designed on randomized block design with 5
to 20 treatments and four replications, plots with 9 m2 were enough to
identify significant differences among treatments regarding the fresh
matter of aerial part in dwarf pigeon pea at 5% probability of 30% of
the experiment overall mean.
INTRODUCTION
The dwarf pigeon pea (Cajanus cajan (L.) Millsp) belongs to the Fabaceae family. It is a woody plant with annual or perennial cycle and height of 1 to 1.5 m. It is used as cover crop due to its nitrogen fixation capacity. Moreover, in some continents, such as Africa and Asia, it is used as feed and food (Castro 1984).
Studies with an important cultivar of dwarf pigeon pea (IAPAR 43, Aratã) focusing on aspects related to crop rotation (Ferrari Neto et al. 2012), soil compaction (Farias et al. 2013), influence on soil characteristics (Cardoso et al. 2014), and nitrogen fixation (Rufini et al. 2014) showed promising characteristics of this pea. Dwarf pigeon pea’s fresh matter of 23.80 t·ha-1 at 92 days after sowing demonstrates
its potential as a cover crop (Pereira et al. 2016).
In the area of Agricultural Sciences, it is important that field experiments are planned adequately in order to have reliability on research results. Thus, from the number of treatments and available experimental area, it is necessary to define the experimental design according to the homogeneity of the area. Subsequently, it is necessary to adjust the plot size and number of replications in order to obtain the desired experimental precision.
With data collected from basic experimental units (BEU) of uniformity trials (experiments without treatments), it is possible to estimate the coefficient of variation (CV) between BEU and the soil heterogeneity index (b) of Smith (1938). The optimum plot size (Xo) can be determined by the method of Hatheway (1961), according to experimental design, number of treatments, number of replications, and precision levels. This approach has been used for crop traits, such as cassava (Viana et al. 2003), maize (Alves and Seraphin 2004), wheat (Henriques Neto et al. 2004), and common bean (Mayor-Durán et al. 2012). Moreover, it has also been used to evaluate the fresh matter of soil cover crops, such as velvet bean (Cargnelutti Filho et al. 2014a) and forage turnip (Cargnelutti Filho et al. 2014b). In addition, the plot size and number of replications for pigeon pea (cultivar ‘BRS Mandarim’) have been investigated by Santos et al. (2016). It is possible that the experimental design for cultivar ‘IAPAR 43 (Aratã)’ is distinct from the one for cultivar ‘BRS Mandarim’, mainly by the distinct height of these cultivars.
The aim of this study was to determine the optimum plot size to evaluate the fresh matter of aerial part of dwarf pigeon pea (Cajanus cajan (L.) Millsp), cultivar IAPAR 43
(Aratã), in scenarios formed by combinations of numbers of treatments, number of replications, and precision levels.
MATERIAL AND METHODS
Three uniformity trials (experiments without treatments, in which the crop and all procedures performed during the experiment are homogeneous in the experimental area) were carried out with dwarf pigeon pea (Cajanus cajan (L.) Millsp), cultivar IAPAR 43 (Aratã), in an area of 30 m × 54 m (1620 m2) located in southern Brazil at lat
29º42’S, long 53º49’W, and altitude of 95 m. According to Köppen climate classification, the climate is Cfa, humid subtropical with warm Summers and without a dry season defined (Heldwein et al. 2009).
Each uniformity trial was carried out on an experimental area of 30 m × 18 m (540 m2). Basic fertilization of 25 kg·ha-1
of N, 100 kg·ha-1 of P
2O5, and 100 kg·ha -1 of K
2O (only NPK
in proportion of 05-20-20) and sowing were performed on January 13, 2016. The area one, 30 m × 18 m (uniformity trial one), was sown with broadcast sowing; areas two, 30 m × 18 m (uniformity trial two), and three, 30 m × 18 m (uniformity trial three), were sown with row sowing. There was a 0.5 m spacing between rows. As recommended for uniformity trials by Storck et al. (2016), cultural practices were carried out homogeneously in the experimental area.
In each uniformity trial, the central area with size of 24 m × 12 m (288 m2) was divided into 288 BEU of 1 m × 1 m,
forming a matrix with 24 rows and 12 columns. In the crop flowering period – i.e., on April 16, 2016 (94 days after broadcast sowing) for uniformity trial one, on April 16, 2016 (94 days after row sowing) for uniformity trial two, and on April 30, 2016 (108 days after row sowing) for uniformity trial three –, the plants were cut at the soil surface in each BEU of 1 m2. Hereafter, the fresh matter of aerial part (FM)
was obtained by weighing in g·m-2. The number of plants
was counted in each BEU. The plant density obtained was 322,535 plants·ha-1, 191,181 plants·ha-1, and 180,868 plants·ha-1,
for uniformity trials one, two, and three, respectively. In each uniformity trial, plots with XR adjacent BEU in
the row and XC adjacent BEU in the column were designed
based on FM data of 288 BEU. The plots with different sizes and/or shapes were designed as (X = XR × XC), i.e., (1×1),
(4×6), (6×1), (6×2), (6×3), (6×4), (6×6), (8×1), (8×2), (8×3), (8×4), (8×6), (12×1), (12×2), (12×3), (12×4), and (12×6). Abbreviations XR, XC and X represent respectively the number
of adjacent BEU in the row, number of adjacent BEU in the column, and plot size in number of BEU.
Hereafter, n – number of plots with X BEU of size (n = 288/X), M(X) – mean of plots with X BEU of size,
V(X) – variance between plots with X BEU of size, CV(X) –
coefficient of variation (in percentage) between plots with X BEU of size, and VU(X) – variance by BEU between plots
with X BEU of size [VU(X) = V(X)/X
2] – were determined for
each plot size (X).
Subsequently, two parameters were estimated: V1 (estimate of variance by BEU between plots with one BEU size) and b (estimate of soil heterogeneity index). Moreover, the coefficient of determination (r2) of the function
VU(X) = V1/X
b of Smith (1938) was also determined. These
parameters were estimated by logarithmic transforma- tion and, consequently, linearization of the function VU(X) = V1/X
b, i.e., logVU
(X) = logV1 - b logX, whose
estimation is weighed by the degrees of freedom (DF = n-1) associated to each plot size. The observed values of dependent [VU(X)] and independent (X) variables and the function
VU(X) = V1/X
b (Smith 1938) were plotted.
Experimental designs were simulated in a randomized block design (commonly used in field experiments) for scenarios formed by combinations of i treatments (i = 5, 10, 15, and 20), r replications (r = 3, 4, 5, 6, 7, 8, 9, and 10), and d differences between treatment means, detected as significant at 5% probability and expressed as a percentage of the mean, i.e., different precision levels (d = 5%, 10%, 15%, 20%, 25%, and 30%). In this case, d = 5% indicates more precision and the other extreme d = 30% indicates smaller precision.
Xo was calculated, in number of BEU (rounded to the greater whole number), using the Equation 1 (Hatheway 1961):
test power (P = 0.80, in this study), with DF; CV is the estimate of coefficient of variation between plots of one BEU size, in percentage; r is the number of replications; and d is the difference between treatment means detected as significant at 5% probability and expressed as a percentage of the overall mean of the experiment (precision). The DF to obtain the critical values (tabulated) of Student’s t distribution were obtained by the equation DF = (i-1)(r-1), where i is the number of treatments and r is the number of replications. In this study, values of t1 and t2 were obtained
with Microsoft Office Excel® application, through the functions t1 = INVT(0.05; DF) and t2 = INVT(0.40; DF),
respectively. Statistical analysis were performed using Microsoft Office Excel® application.
RESULTS AND DISCUSSION
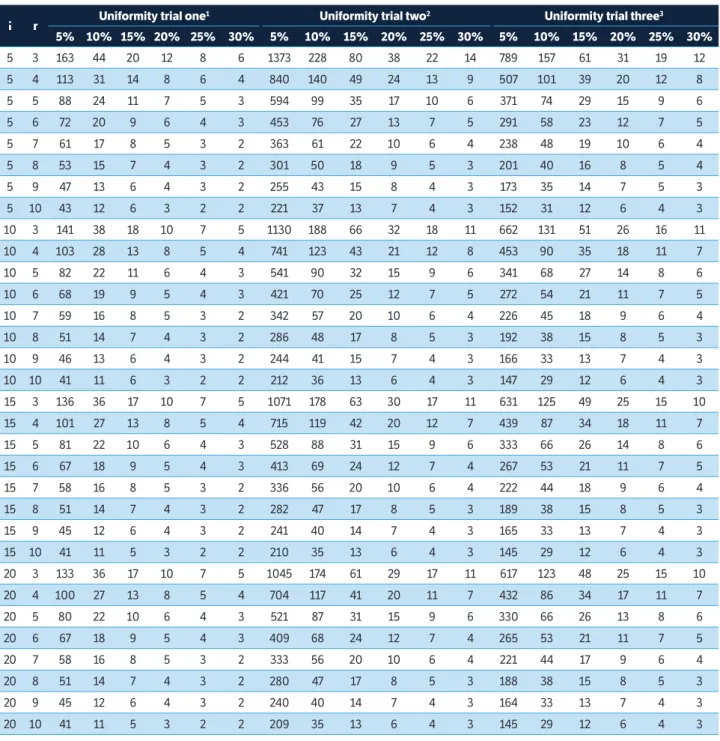
The mean of the fresh matter of aerial part in dwarf pigeon pea (Cajanus cajan (L.) Millsp), cultivar IAPAR 43 (Aratã), between 288 BEU of 1 m2 in uniformity trial one
(21.2776 t·ha-1) was higher than the means in uniformity
trials two (15.4097 t·ha-1) and three (16.1748 t·ha-1)
(Table 1). The greater plant density in uniformity trial one (322,535 plants·ha-1) when compared to uniformity trials
two (191,181 plants·ha-1) and three (180,868 plants·ha-1) can
explain the greater fresh matter values obtained in uniformity trial one. These elevated amounts of fresh matter similar to the 23.80 t·ha-1 obtained in study performed by Pereira
et al. (2016) suggest proper growth and development of dwarf pigeon pea. Furthermore, they also reveal the impor- tance of continuing studies on the feasibility of dwarf pigeon pea, cultivar IAPAR 43 (Aratã), use as a cover crop specie, as already performed by Ferrari Neto et al. (2012), Farias et al. (2013), Cardoso et al. (2014), and Rufini et al. (2014).
The CV of fresh matter of aerial part among the 288 BEU of 1 m2 was 27.54%, 31.12%, and 33.28%,
respectively, for uniformity trials one, two, and three (Table 1). These values were relatively higher than the CV of 21.78% observed in the evaluation of fresh matter of aerial part of velvet bean (Cargnelutti Filho et al. 2014a). Meanwhile, they were similar to the CV of 30.54% obtained by Pereira et al. (2016) in the evaluation of fresh matter of dwarf pigeon pea and other five cover crop species. Variability among the 288 BEU where the where b is the estimate of soil heterogeneity index; t1 is the
critical value of Student’s t distribution for the significance level of the test (type I error) of α = 5% (5% of two-tailed test) with DF; t2 is the critical value of Student’s t
distribution, corresponding to 2(1-P) (two-tailed test), P is the probability of obtaining significant result, i.e., the
FM was evaluated is important to study the optimum plot size and it reflects the real conditions of field areas. Therefore, proper growth and development of dwarf pigeon pea plants in the three uniformity trials and the
wide variability among the BEU provide credibility to this database for the proposed study.
Soil heterogeneity index (b) of Smith (1938) was 1.0474, 0.7716, and 0.8558, respectively, for trials one, two, and three
XR XC X n
Uniformity trial one1 Uniformity trial two2 Uniformity trial three3
M(X) CV(X) M(X) CV(X) M(X) CV(X)
1 1 1 288 2127.76 27.54 1540.97 31.12 1617.48 33.28
1 2 2 144 4255.53 18.76 3081.94 21.92 3234.97 21.72
1 3 3 96 6383.29 15.14 4622.92 18.24 4852.45 18.26
1 4 4 72 8511.06 14.03 6163.89 15.85 6469.93 16.94
1 6 6 48 12766.58 10.61 9245.83 13.59 9704.90 11.55
2 1 2 144 4255.53 19.61 3081.94 22.45 3234.97 26.64
2 2 4 72 8511.06 12.80 6163.89 15.82 6469.93 16.62
2 3 6 48 12766.58 9.73 9245.83 12.83 9704.90 13.69
2 4 8 36 17022.11 8.72 12327.78 11.53 12939.86 13.31
2 6 12 24 25533.17 6.39 18491.67 10.16 19409.79 8.44
3 1 3 96 6383.29 17.44 4622.92 19.70 4852.45 24.98
3 2 6 48 12766.58 10.76 9245.83 13.96 9704.90 14.29
3 3 9 32 19149.88 7.64 13868.75 10.82 14557.34 12.02
3 4 12 24 25533.17 6.75 18491.67 9.87 19409.79 12.47
3 6 18 16 38299.75 3.73 27737.50 9.05 29114.69 7.36
4 1 4 72 8511.06 15.96 6163.89 18.70 6469.93 23.21
4 2 8 36 17022.11 10.37 12327.78 13.35 12939.86 12.96
4 3 12 24 25533.17 6.54 18491.67 10.51 19409.79 10.52
4 4 16 18 34044.22 6.21 24655.56 9.31 25879.72 11.04
4 6 24 12 51066.33 3.83 36983.33 8.85 38819.58 5.98
6 1 6 48 12766.58 14.52 9245.83 16.66 9704.90 22.46
6 2 12 24 25533.17 8.97 18491.67 12.28 19409.79 12.50
6 3 18 16 38299.75 5.92 27737.50 9.42 29114.69 9.43
6 4 24 12 51066.33 5.69 36983.33 8.81 38819.58 11.51
6 6 36 8 76599.50 2.25 55475.00 8.20 58229.38 6.25
8 1 8 36 17022.11 13.55 12327.78 15.13 12939.86 21.19
8 2 16 18 34044.22 8.63 24655.56 11.65 25879.72 10.40
8 3 24 12 51066.33 5.21 36983.33 9.48 38819.58 6.72
8 4 32 9 68088.44 5.29 49311.11 8.66 51759.44 9.46
8 6 48 6 102132.67 2.19 73966.67 8.37 77639.17 1.89
12 1 12 24 25533.17 11.75 18491.67 14.91 19409.79 21.00
12 2 24 12 51066.33 7.36 36983.33 11.48 38819.58 10.77
12 3 36 8 76599.50 4.50 55475.00 8.79 58229.38 6.76
12 4 48 6 102132.67 4.29 73966.67 8.63 77639.17 10.18
12 6 72 4 153199.00 2.13 110950.00 7.89 116458.75 3.23
Table 1. Designed plot size (X = XR × XC) in basic experimental units (BEU) with XR adjacent BEU in the row and XC adjacent BEU in the column; number of plots with X BEU of size (n = 288/X); mean of plots with X BEU of size [M(X)], in grams; and coefficient of variation (in percentage) between plots with X BEU of size [CV(X)]. Data of fresh matter of aerial part of dwarf pigeon pea (Cajanus cajan (L.) Millsp), cultivar IAPAR 43 (Aratã), in three uniformity trials with 288 BEU of 1.00 m2.
.
1Uniformity trial one - broadcast sowing was carried out on January 13, 2016 and harvest in April 16, 2016; 2Uniformity trial two - row sowing was carried out on
(2)
(Figure 1). Alves and Seraphin (2004) have discussed that in the Equation 2 (Hatheway 1961),
where b interferes differently in the estimate of Xo.
Visually, for the three uniformity trials, accentuated decreases of variance per BEU [VU(X)] in plots of six BEU
(6 m2), intermediate decreases between six and 12 BEU, and
stabilization trend with plots greater than 12 BEU (Figure 1) were observed. Similar behavior was observed in velvet bean (Cargnelutti Filho et al. 2014a) and forage turnip (Cargnelutti
Filho et al. 2014b). Therefore, in order to evaluate the fresh matter of aerial part of dwarf pigeon pea, plots of up to 12 BEU (12 m2) are suggested because the gain in experimental
precision (decrease of VU(X)) with incremental increases in
plot sizes from 12 BEU was inexpressive.
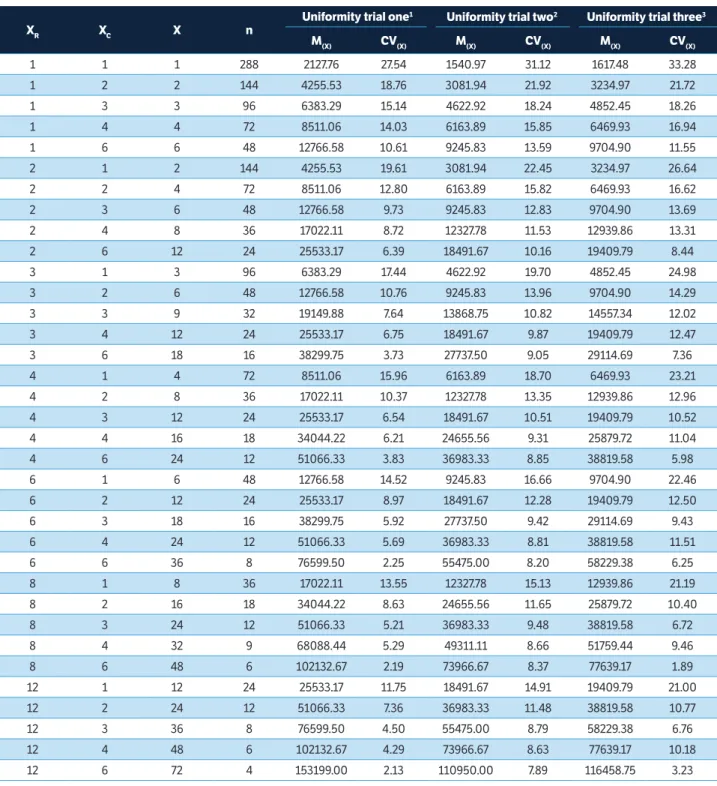
In the three uniformity trials, Xo in BEU for a fixed number of treatments (i) and replications (r) increases with increased desired precision (d). With fixed number of i and d, Xo decreases with the increase in number of r. Meanwhile, with fixed values of r and d, there is a reduction of Xo with increased number of i (Table 2). These findings agree with inferences of Cargnelutti Filho et al. (2014 a,b). These authors explained that the larger the number of
Figure 1. Graphical representation of the relation between the variance by basic experimental unit (BEU) among plots with X BEU size [VU(X) = V(X)/X2] and the designed plot size (X) in BEU and estimates of the function parameters VU(x) = V1/Xb of Smith (1938). Data of fresh
matter of aerial part of dwarf pigeon pea (Cajanus cajan (L.) Millsp), cultivar IAPAR 43 (Aratã), in three uniformity trials with 288 BEU of 1.00 m2 in each trial.
Uniformity trial one – broadcast sowing was carried out on January 13, 2016 and harvest in April 16, 2016
Uniformity trial two – rwo sowing was carried out on January 13, 2016 and harvest in April 16, 2016
Uniformity trial three – rwo sowing was carried out on January 13, 2016 and harvest in April 30, 2016 0
0 90000 180000 270000 360000
0 6 12 18 24 30 36 42 48 54 60 66 72
VU
(X
)
90000 180000 270000 360000
VU
(X
)
Plot size (in BEU)
0 6 12 18 24 30 36 42 48 54 60 66 72 Plot size (in BEU)
VU(X) = 291803/X0.8558
r2 = 0.8176
VU(X) = 206448/X0.7716
r2 = 0.9434
VU(X) = 361620/X 1.0474
r2 = 0.9214
0 90000 180000 270000 360000
VU
(X
)
treatments and number of replications, the greater is the number of degrees of freedom of error and, consequently, the lower is the estimate of the residual variance (mean square error), i.e., the greater is the experimental precision.
Among the uniformity trials for the same i, r, and d, Xo was decreasing in the following order: trial two, trial three, and trial one (Table 2). Thus, opting for the experimental design based on trial two (greater plot size) is an appropriate procedure. For example, in order to evaluate the FM in an
i r Uniformity trial one
1 Uniformity trial two2 Uniformity trial three3
5% 10% 15% 20% 25% 30% 5% 10% 15% 20% 25% 30% 5% 10% 15% 20% 25% 30%
5 3 163 44 20 12 8 6 1373 228 80 38 22 14 789 157 61 31 19 12
5 4 113 31 14 8 6 4 840 140 49 24 13 9 507 101 39 20 12 8
5 5 88 24 11 7 5 3 594 99 35 17 10 6 371 74 29 15 9 6
5 6 72 20 9 6 4 3 453 76 27 13 7 5 291 58 23 12 7 5
5 7 61 17 8 5 3 2 363 61 22 10 6 4 238 48 19 10 6 4
5 8 53 15 7 4 3 2 301 50 18 9 5 3 201 40 16 8 5 4
5 9 47 13 6 4 3 2 255 43 15 8 4 3 173 35 14 7 5 3
5 10 43 12 6 3 2 2 221 37 13 7 4 3 152 31 12 6 4 3
10 3 141 38 18 10 7 5 1130 188 66 32 18 11 662 131 51 26 16 11
10 4 103 28 13 8 5 4 741 123 43 21 12 8 453 90 35 18 11 7
10 5 82 22 11 6 4 3 541 90 32 15 9 6 341 68 27 14 8 6
10 6 68 19 9 5 4 3 421 70 25 12 7 5 272 54 21 11 7 5
10 7 59 16 8 5 3 2 342 57 20 10 6 4 226 45 18 9 6 4
10 8 51 14 7 4 3 2 286 48 17 8 5 3 192 38 15 8 5 3
10 9 46 13 6 4 3 2 244 41 15 7 4 3 166 33 13 7 4 3
10 10 41 11 6 3 2 2 212 36 13 6 4 3 147 29 12 6 4 3
15 3 136 36 17 10 7 5 1071 178 63 30 17 11 631 125 49 25 15 10
15 4 101 27 13 8 5 4 715 119 42 20 12 7 439 87 34 18 11 7
15 5 81 22 10 6 4 3 528 88 31 15 9 6 333 66 26 14 8 6
15 6 67 18 9 5 4 3 413 69 24 12 7 4 267 53 21 11 7 5
15 7 58 16 8 5 3 2 336 56 20 10 6 4 222 44 18 9 6 4
15 8 51 14 7 4 3 2 282 47 17 8 5 3 189 38 15 8 5 3
15 9 45 12 6 4 3 2 241 40 14 7 4 3 165 33 13 7 4 3
15 10 41 11 5 3 2 2 210 35 13 6 4 3 145 29 12 6 4 3
20 3 133 36 17 10 7 5 1045 174 61 29 17 11 617 123 48 25 15 10
20 4 100 27 13 8 5 4 704 117 41 20 11 7 432 86 34 17 11 7
20 5 80 22 10 6 4 3 521 87 31 15 9 6 330 66 26 13 8 6
20 6 67 18 9 5 4 3 409 68 24 12 7 4 265 53 21 11 7 5
20 7 58 16 8 5 3 2 333 56 20 10 6 4 221 44 17 9 6 4
20 8 51 14 7 4 3 2 280 47 17 8 5 3 188 38 15 8 5 3
20 9 45 12 6 4 3 2 240 40 14 7 4 3 164 33 13 7 4 3
20 10 41 11 5 3 2 2 209 35 13 6 4 3 145 29 12 6 4 3
Table 2. Optimum plot size (Xo) in basic experimental units of 1 m2, estimated by Hatheway’s method (1961), for experimental design in
randomized blocks in scenarios formed by combinations of i treatments, r replications, and d differences between treatment means to be detected as significant at 5% probability, expressed as a percentage of the experiment overall mean (d = 5%, 10%, 15%, 20%, 25%, and 30%) for data of fresh matter of aerial part of dwarf pigeon pea (Cajanus cajan (L.) Millsp), cultivar IAPAR 43 (Aratã), in three uniformity trials.
.
1Uniformity trial one - broadcast sowing was carried out on January 13, 2016 and harvest in April 16, 2016; 2Uniformity trial two - row sowing was carried out on
experiment with five treatments (i = 5) and three replications (r = 3), aiming that in 80% of the experiments (power = 0.80) differences among treatments (d = 30%) of the experiment overall mean (lower precision) are detected as significant at 5% probability, the plot size should be 14 BEU (14 m2). This
plot size is suitable in field experiments but the experimental precision is low. Thus, in these same conditions, at the other extreme, plots with 1373 BEU (1373 m2) would be necessary
for d = 5% (greater precision). The experimental precision is greater in this situation but performing a field experiment with plot size of 1373 m2 is impracticable. Therefore, high
experimental precisions (low percentages of d) are difficult to obtain due to the elevated plot size (Cargnelutti Filho et al. 2014 a,b).
The method of Hatheway (1961) is based on the fixed value of the soil heterogeneity index (b) of Smith (1938); Xo is dependent on the number of treatments (i), number of replications (r), and precision (d). Therefore, based on the number of treatments and the desired precision, a researcher can use the information from this study to plan the plot size and number of replications to be used. For example, if the researcher wants to evaluate the FM of ten treatments with precision of 25%, among the various options, plots of 18 BEU (18 m2) and three replications, 12 BEU (12 m2) and
four replications, 9 BEU (9 m2) and five replications, or 7 BEU
(7 m2) and six replications can be used (Table 2). In these
four options, the experimental area would be respectively 540, 480, 450, and 420 m2. Thus, for the same precision
(d = 25% in this case), smaller plots and more replications are more efficient in the experimental area use, as discussed in Alves and Seraphin (2004), Henriques Neto et al. (2004), Cargnelutti Filho et al. (2014 a,b), and Storck et al. (2016). It is important to consider that with increased number of replications, larger number of evaluations are required, and being the trait difficult to measure and/or of high cost to be assessed, the use of larger plot sizes and lower replications can be advantageous, as there is enough experimental area. Therefore, the researcher should investigate considering the available experimental area, the number of treatments to be evaluated, and the desired precision, which combination of plot size and number of replications is more appropriate.
The information provided in this study enable these investigations for 192 scenarios consisting of combinations of i treatments (i = 5, 10, 15, and 20), r replications (r = 3, 4, 5, 6, 7, 8, 9, and 10), and d differences among treatment means to be detected as significant at 5% probability (d =
5%, 10%, 15%, 20%, 25%, and 30%) (Table 2). Alternatively, from uniformity trial two, other scenarios can be simulated by the Eq. 3 (Hatheway 1961) based on the estimates of b = 0.7716 index of soil heterogeneity of Smith (1938) (Figure 1) and on the coefficient of variation (CV = 31.12%) among the 288 BEU (Table 1).
For example, in order to evaluate the FM of eight treatments with four replications, and d = 25% in a randomized block design (RBD), it is obtained: b = 0.7716; DF = (8-1)(4-1) = 21; t1 = INVT(0.05;21) = 2.07961383; t2 = INVT(0.40;21) =
0.85907403; CV = 31.12%; r = 4; and d = 25%. Therefore:
In order to simulate scenarios in a completely randomized design (CRD), only the equation for calculating the number of degrees of freedom changes, i.e., for this design, DF = i(r-1), where i is the number of treatments and r is number of replications. For this example: b = 0.7716; DF = (8)(4-1) = 24; t1 = INVT(0.05;24) = 2.06389854; t2 = INVT(0.40;24) =
0.85685545; CV = 31.12%; r = 4; and d = 25%. Thus:
CONCLUSION
In experiments designed on randomized block design with 5 to 20 treatments and four replications, plots with 9 m2 are
enough to identify significant differences among treatments regarding the fresh matter of aerial part in dwarf pigeon pea at 5% probability of 30% of the experiment overall mean.
ACKNOWLEDGEMENTS
We thank the Brazilian National Council for Scientific and Technological Development (CNPq), the Coordination
(3)
(4)
for the Improvement of Higher Education Personnel (CAPES), and the Rio Grande do Sul Research Foundation (FAPERGS) for granting scholarships.
ORCID IDS
A. Cargnelutti Filho
https://orcid.org/0000-0002-8608-9960 A. Lavezo
https://orcid.org/0000-0003-2691-5447 C. M. de Bem
https://orcid.org/0000-0002-6326-8720 F. Carini
https://orcid.org/0000-0001-6000-7747 D. E. Schabarum
https://orcid.org/0000-0003-0356-0276
C. T. Bandeira
https://orcid.org/0000-0001-5019-5959 J. A. Kleinpaul
https://orcid.org/0000-0001-7550-6012 C. A. Wartha
https://orcid.org/0000-0001-5184-0518 D. L. Silveira
https://orcid.org/0000-0003-0993-0100 R. V. Pezzini
https://orcid.org/0000-0003-4134-2499 R. M. Thomasi
https://orcid.org/0000-0001-9248-0213 F. M. Simões
https://orcid.org/0000-0002-3189-5068 I. M. M. Neu
https://orcid.org/0000-0002-9186-2532
Alves, S. M. F. and Seraphin, J. C. (2004). Soil heterogeneity
coefficient and plot size. Pesquisa Agropecuária Brasileira, 39,
105-111. http://dx.doi.org/10.1590/S0100-204X2004000200002.
Cardoso, R. A., Bento, A. S., Moreski, H. M. and Gasparotto, F. (2014).
Influence of green manure in physical and biological properties of
soil and productivity in the culture of soybean. Semina: Ciências
Biológicas e da Saúde, 35, 51-60.
Cargnelutti Filho, A., Toebe, M., Alves, B. M., Burin, C., Neu, I. M.
M. and Facco, G. (2014a). Plot size to evaluate the mass of plants
of velvet bean. Comunicata Scientiae, 5, 196-204.
Cargnelutti Filho, A., Toebe, M., Burin, C., Casarotto, G. and Alves,
B. M. (2014b). Experimental designs in turnip sown to haul and in
line. Bioscience Journal, 30, 677-686.
Castro, T. A. P. (1984). Recomendações técnicas para o cultivo do
guandu anão. Embrapa. (Comunicado Técnico, 14).
Farias, L. N., Silva, E. M. B., Souza, W. P., Vilarinho, M. K. C., Silva,
T. J. A. and Guimarães, S. L. (2013). Morphological and productive
characteristics of the dwarf pigeonpea cultivated in compacted
soil. Revista Brasileira de Engenharia Agrícola e Ambiental, 17,
497-503. http://dx.doi.org/10.1590/S1415-43662013000500005.
Ferrari Neto, J. Crusciol, C. A. C., Soratto, R. P. and Costa, C. H. M.
(2012). Pigeonpea and millet intercropping: phytomass persistence
REFERENCES
and release of macronutrients and silicon. Bragantia, 71, 264-272.
http://dx.doi.org/10.1590/S0006-87052012005000017.
Hatheway, W. H. (1961). Convenient plot size. Agronomy Journal, 53,
279-280. https://doi.org/10.2134/agronj1961.00021962005300040025x.
Heldwein, A. B., Buriol, G. A. and Streck, N. A. (2009). O clima de
Santa Maria. Ciência e Ambiente, 38, 43-58.
Henriques Neto, D., Sediyama, T., Souza, M. A., Cecon, P. R.,
Yamanaka, C. H., Sediyama, M. A. N. and Viana, A. E. S. (2004).
Plot size in experiments with wheat irrigated under no-tillage and
conventional tillage. Pesquisa Agropecuária Brasileira, 39, 517-524.
http://dx.doi.org/10.1590/S0100-204X2004000600001.
Mayor-Durán, V. M., Blair, M. and Muñoz, J. E. (2012). Metodología
para estimar el coeficiente de heterogeneidad del suelo, el número
de repeticiones y el tamaño de parcela en investigaciones con frijol
(Phaseolus vulgaris L.). Acta Agronomica, 61, 32-39.
Pereira, N. S., Soares, I. and Miranda, F. R. (2016). Biomass and
nutrient accumulation of leguminous green manure species
in the Jaguaribe-Apodi region, Ceará, Brazil. Revista Verde de
Agroecologia e Desenvolvimento Sustentável, 11, 11-14. https://
doi.org/10.18378/rvads.v11i2.3945.
Rufini, M., Oliveira, D. P., Trochmann, A., Soares, B. L., Andrade,
symbiosis with dwarf pigeon pea under greenhouse and field
conditions. Pesquisa Agropecuária Brasileira, 49, 197-206. http://
dx.doi.org/10.1590/S0100-204X2014000300006.
Santos, G. O., Cargnelutti Filho, A., Alves, B. M., Burin, C., Facco,
G., Toebe, M., Kleinpaul, J. A., Neu, I. M. M. and Stefanello, R.
B. (2016). Plot size and number of repetitions in pigeonpea.
Ciência Rural, 46, 44-52. http://dx.doi.org/10.1590/0103-8478cr
20150124.
Smith, H. F. (1938). An empirical law describing heterogeneity in
the yields of agricultural crops. Journal of Agricultural Science, 28,
1-23.http://dx.doi.org/10.1017/S0021859600050516.
Storck, L., Garcia, D. C., Lopes, S. J. and Estefanel, V. (2016).
Experimentação vegetal. 3. ed. Santa Maria: UFSM.
Viana, A. E. S., Sediyama, T., Lopes, S. C., Cecon, P. R. and Silva, A.
A. (2003). Study on plot size in cassava (Manihot esculenta Crantz)
![Figure 1. Graphical representation of the relation between the variance by basic experimental unit (BEU) among plots with X BEU size [VU (X) = V (X) /X 2 ] and the designed plot size (X) in BEU and estimates of the function parameters VU(x) = V1/X b of](https://thumb-eu.123doks.com/thumbv2/123dok_br/16005403.691881/5.892.89.805.395.1006/graphical-representation-relation-variance-experimental-designed-estimates-parameters.webp)