www.ccarevista.ufc.br ISSN 1806-6690
Optimum plot size for experiments with the sunflower
1Tamanho ótimo da parcela para experimentação com girassol
Roberto Pequeno de Sousa2*, Paulo Sérgio Lima e Silva2, Janilson Pinheiro de Assis2, Paulo Igor Barbosa e Silva3
e Júlio César do Vale Silva4
ABSTRACT -The aim of this study was to determine a suitable plot size for field experiments with the sunflower. An experiment was carried out in a randomised complete block design with 14 sunflower cultivars and 10 replications. The plots consisted of four rows, six metres in length, spaced 0.7 m apart with 0.3 m between plants. The working area of the plot (7.56 m2), consisting of the two central rows, was divided into 12 basic units, each consisting of three plants
per row (0.63 m2), from where the yield of the sunflower seeds was obtained. Suitable plot size was estimated using
the intraclass correlation coefficient method. The detectable difference between treatments was also estimated (d). The optimum plot size for the evaluation of grain yield in the sunflower was 2.52 m2 (working area), considering a boundary
of one row on each side. Greater gains in experimental precision (16%) with increases in plot size, occurred up to eight basic units (5.04 m2) using seven replications. Increasing the number of replications and the plot size was more efficient
in increasing experimental precision, than increasing the number of cultivars.
Key words:Helianthus annuus L.. Intraclass correlation coefficient. Breeding.
RESUMO - O objetivo desse trabalho foi determinar o tamanho adequado de parcela para experimentação de campo com girassol. Foi realizado um experimento no delineamento em blocos completos casualizados com 14 cultivares de girassol e 10 repetições. As parcelas foram constituídas de quatro fileiras de seis metros de comprimento, espaçadas de 0,7 m e entre plantas de 0,3 m. A área útil da parcela (7,56 m2), composta das duas fileiras centrais, foi dividida em
12 unidades básicas, cada uma constituída de três plantas na fileira (0,63 m2), onde a produção de grãos do girassol
foi obtida. O tamanho adequado da parcela experimental foi estimado através do método do coeficiente de correlação intraclasse. Estimou-se também a diferença detectável entre tratamentos (d). O tamanho ótimo de parcela para avaliação do rendimento de grãos de girassol foi de 2,52 m2 (área útil), considerando bordadura de uma linha nas laterais. Maiores
ganhos em precisão experimental (16%), com incrementos no tamanho da parcela, ocorreram até oito unidades básicas (5,04 m2), utilizando-se sete repetições. O aumento do número de repetições e do tamanho da parcela foram mais
eficientes para aumentar a precisão experimental, que o incremento no número de cultivares.
Palavras-chave:Helianthus annuusL.. Coeficiente de correlação intraclasse. Melhoramento genético.
*Autor para correspondênicia
1Recebido para publicação em 25/11/2013; aprovado em 06/11/2014
Parte da Tese de Doutorado do primeiro autor apresentada na Universidade Federal Rural do Semi-Árido/UFERSA, projeto financiado pela Petrobras
2Departamento de Ciências Vegetais, Universidade Federal Rural do Semi-Árido/UFERSA, Av. Francisco Mota, s/n, Km 47 da BR 110,
Mossoró-RN, Brasil, 59.500-900, rpequeno@ufersa.edu.br; paulosergio@ufersa.edu.br; janilson@ufersa.edu.br
3Engenheiro Agrônomo, doutor em Fitotecnia, Brasil, pauloigorbs@gmail.com
INTRODUCTION
Among oilseeds, the sunflower (Helianthus
annuus L.) is the crop with the fastest growth rate in
the world (SMIDERLE, 2010). The demand for sunflower cultivars with better adaptation has given direction to the
breeding program ofEmbrapa Tabuleiros Costeiros, which
has sought to evaluate and indicate cultivars adapted to different areas of the northeast of Brazil (OLIVEIRA, 2010).
For a breeding program to be successful, it is necessary for experiments to be able to detect ever smaller variations, since the trend is for differences between new cultivars to decrease. For this reason, the challenge for breeders is to increase the precision of experiments, which would result in genetic advances and, as a consequence, materials which are more productive and of better quality (SILVA, 2009).
However, for conducting experiments of high precision, planning is needed, and within that context, one of the basic issues that always comes up in the experiments concerns the proper size of the plot or experimental unit (SILVA, 2009).
Plot size tends to increase with the progress of the breeding program, i.e. the more advanced the population, the larger the plot size needed for the experiment, because as the generations advance there is a reduction in variation between the selected materials, requiring a larger number of plants for such variations to be detected and for selections to be made. From the point where increasing the size of the plot does not result in increased precision, additional increases in precision can be obtained through the use of a greater number
of replications (CARGNELUTTI FILHOet al., 2012).
Several factors are involved in determining the size and shape of the plot. Among them, the heterogeneity of the soil is the most important; information about the area in which the experiments will be conducted being
essential (STORCKet al., 2006).
Many methods have been used to estimate the optimum plot size, either from tests of uniformity or from experiments that include the effects of treatments. Among the methods used to estimate the optimum plot size from the use of experimental data from the tests of treatments, the intraclass correlation coefficient method proposed by Pimentel Gomes (1984) should be mentioned. This method was initially applied to tree species, but the theory also applies to annual plants, as long as they are considered as lines or unitary sub-plots instead of trees, and the number of working unitary sub-plots, which gives the minimum variance for the means of treatments, is determined from the intraclass correlation coefficient.
The literature on plot size involves many crops and different situations. However, for the sunflower few studies on experimental plot size were found.
The aim of this work was to determine the plot size for experiments with the sunflower using the method proposed by Pimentel Gomes (1984).
MATERIAL AND METHODS
The experiment was conducted from May to July of 2011 at the Rafael Fernandes Experimental Farm of the Federal Rural University of the Semi-Arid (UFERSA), 20 km from the town of Mossoró, in the state of Rio Grande do Norte (RN), Brazil (5°11’ S, 37°20’ W, at an altitude of 18 m).
A randomised complete block design was used, with 14 sunflower cultivars and 10 replications. The plots consisted of four rows, each six metres long, with an area of 16.8 m² (2.8 m x 6.0 m). Spacing between rows was 0.7 m, with 0.3 m between plants. The working area of a plot consisted of the two central rows, eliminating a plant at each end, giving an area of 7.56 m² (1.4 m x 5.4 m). To collect data on grain yield for the sunflower, the working area of the plot was divided into 12 basic units, each consisting of three plants in a row and an area of 0.63 m².
Based on Pimentel Gomes (1984), the statistical model adopted was (equation1):
Yijk = m + ci + bj + eij + eijk (1)
referring to a randomised block design with k samples
(basic units) per plot, where:Y
ijk grain yield obtained in the
basic unit k, from cultivar i, in block j; m = general mean;
ci = effect from cultivar i (i = 1, 2, ..., I cultivars); bj =
effect from block j (j = 1, 2, ..., J blocks); eij= experimental
error between plots and eijk= experimental error between
basic units in the plot (k = 1, 2, ..., K basic units per plot). From the adopted statistical model, variance analysis was carried out, considering the experimental error between plots (residual (a)) and between basic units in the plot (residual (b)) (Table 1).
The intraclass correlation coefficient was estimated from the variance analysis (Table 1), with the residual mean squares being equal to the respective mathematical expectations, in this case giving (Equation 2):
(2)
estimate of the intraclass correlation coefficient; V1 =
residual mean square between plots; V2 = residual mean
square between basic units in the plot; and K = number of basic units in the plot (12 basic units).
Table 1 - Variance analysis with K basic units per plot, and mathematical expectations of the mean squares. Mossoró RN, UFERSA, 20131
1V
1 = residual mean square between plots; V2 = residual mean square in the plot;
2= variance relative to the experimental error between the basic units in the plot; = Intraclass correlation coefficient due to the basic units in the plot
Source of Variation Degrees of Freedom Mean Square (MS) Expectation (MS)
Blocks J-1
Cultivars I-1
Residual (a) (J-1)(I-1) V1 2[1 + (K - 1) ]
Residual (b) JI(K-1) V2 2(1 - )
working basic units (k) is: a) if recommended
is k = 2; b) if , the solution given by
expression 3:
(3)
with k a natural number, or for one of the values
of k, even natural numbers nearest to the root value; c), k
should be the greatest possible natural number, consistent with a reasonable number of degrees of freedom for the residual (usually at least 10 g.1.).
The difference between two means of the cultivars, expressed as a percentage of the expected detected mean, was calculated using Hatheway’s method (1961), by the formula 4:
(4)
where: t1is the critical value for Student’s t-distribution
at 5%; t2 the tabulated value of Student’s t without the
probability of obtaining a significant result (80%) from
P; CV1the coefficient of variation of the plots making
up a basic unit; r the number of replications; and b the heterogeneity coefficient of the soil obtained after linearization of Smith’s equation (1938):
(5)
where VX is the variance per unit area of plots of X BUs
in size, V1 is the variance of plots consisting of one
BU, and X is the number of BUs that make up the plot
(plot size). The values for b and CV1 were estimated in
each of the 140 plots (14 cultivars and 10 replications), using the 12 BUs of the working area of the plot.
To estimate the detectable difference (d) an experiment was considered of a randomised complete block design with 4, 8, 12 and 16 cultivars; 3, 5 and 7 replications; and plot sizes of 2, 4, 6, 8, 10 and 12 basic units.
RESULTS AND DISCUSSION
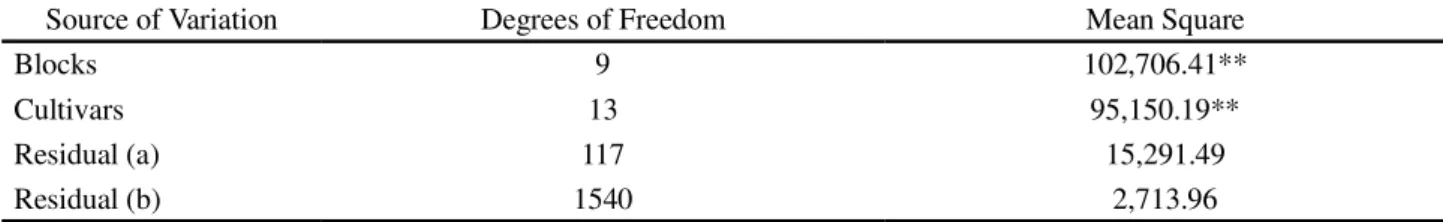
Variance analysis was performed (Table 2) to estimate the intraclass correlation coefficient ( ) and then to estimate the optimum number of basic units per plot (Table 3).
From analysis of the data (Table 3), it was found that the residual mean square between plots was greater than in the plot. This means that there was more variability between plots and less variability between basic units in the plot, consequently resulting in a positive value not close to zero (0.2786) for the
intraclass correlation coefficient ( ) for the basic
units in the plot. This shows that there was some correlation between the basic units in the plot, which helped in the use of reasonably small plots, in this
case of 4 (four) working basic units (2.52 m2). This
result agrees with that of Lorentz et al. (2010) who
Table 2 - Summary of the variance analysis of grain yield in sunflower cultivars. Mossoró RN, UFERSA, 20131
Source of Variation Degrees of Freedom Mean Square
Blocks 9 102,706.41**
Cultivars 13 95,150.19**
Residual (a) 117 15,291.49
Residual (b) 1540 2,713.96
1basic unit = 0,7 m x 0,9 m
Table 3 - Optimum plot size in basic units for grain yield in the sunflower, estimated by the intraclass correlation coefficient method. Mossoró RN, UFERSA, 20131
Residual Mean Square between Plots
Residual Mean Square in the Plot
Intraclass Correlation Coefficient ( )
Optimum Number of Working Basic Units per Plot (k)
15,291.49 2,713.96 0.2786 4.00
conducted an experiment with the sunflower and found
an optimum plot size of 2.4 m2.
An experiment conducted by Oliveira et al.
(2010) to evaluate the yield of sunflower cultivars,
used plots with a working area of 8.64 m2. However,
according to the results obtained in this study, the size for the plot could be significantly reduced without compromising the data being collected, since plot
sizes with a working area of 2.52 m2 proved
well-suited to the evaluation of grain yield in sunflower cultivars.
According to Pimentel Gomes (1988), when >0.15, the solutions obtained are excellent (in this
experiment = 0.2786), but in the case of low positive
values for ( 0.15), the number of working plants
in a plot of optimum size can increase, i.e. become overestimated, and then the number of working rows to be used should also be studied. This information
was confirmed by Silvaet al. (2003) when conducting
clonal tests with eucalyptus. These same authors also attribute the possibility of inconsistent values occurring to another factor, the presence of only one coefficient ( ), that of the plot which was actually analysed. In this case, this may result in the number of working plants in the plot being underestimated, since this estimate of from which the others are inferred, may confuse the expected intraclass correlation coefficient in a design with a small number of trees and with a possible different degree of competition in relation to the plot used when calculating .
To estimate the true detectable difference (d) between the cultivar means, using the formula proposed by Hatheway (1961), values for b (heterogeneity coefficient of the soil ) and CV (coefficient of variation of plots of one basic unit in size) were used considering all the cultivars, adopting a significance level of 5% probability, for plot sizes ranging from 2 to
12 basic units (from 1.26 to 7.56 m2 respectively) and
considering an experiment in a randomised complete block design of 4, 8, 12 and 16 cultivars, and 3, 5 and 7 replications.
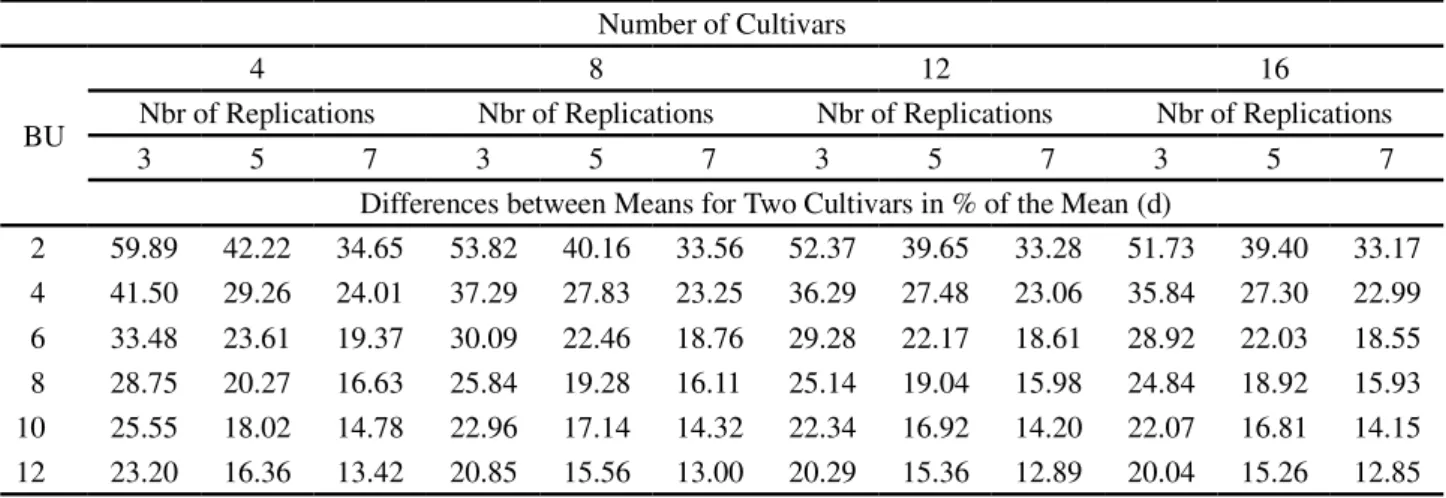
Table 4 shows values for the estimates of d in accordance with the pre-established conditions. Analysing this table, significant decreases can be seen in the values of d (gains in experimental precision) with increases in the size of small plots, although this increase in precision is small with additional increases in the area of plots over a certain size limit, agreeing
with the results obtained by various authors (BRUMet
al., 2008; DONATOet al., 2008; HENRIQUES NETO
et al., 2004; LÚCIOet al., 2011; LÚCIOet al., 2012;
MARTINet al., 2004;; SANTOSet al., 2012).
It was also seen that the greatest gains in experimental precision (a reduction in the values of d) with increases in plot size (Table 4) occurred up
to eight basic units (5.04 m2). It is important to note
that differences of around 20% (of the mean) between the means for cultivars can be detected using plots
of six basic units (3.78 m2), seven replications and
four or more cultivars; using plots of eight basic units
(5.04 m2), five replications and four or more cultivars;
or with plots of twelve basic units (7.56 m2), three
replications and eight or more cultivars. Differences of around 15% can be detected with the use of plots of eight
basic units (5.04 m2), seven replications and 12 or more
cultivars; using plots of ten basic units (6.30 m2), seven
replications and four or more cultivars; or twelve basic
units (7.56 m2), five replications and eight or more
cultivars. Similar results were obtained by Lorentz et
al. (2010) who, with a sunflower crop, and using plots
of 4.00 m2, with five replications and four treatments,
obtained a value for d of 24.51%, very close to that obtained in this work of d = 23.61%, when using plots
of 3.78 m2 with the same number of replications and
treatments.
It is worth noting that an increase in the number of replications was more efficient in reducing the value of d (increased experimental precision), when compared to an increase in the number of cultivars
(Table 4), a fact also demonstrated by Donato et al.,
2008, Storck, Bisognin and Oliveira, 2006 and Storck
CONCLUSIONS
1. The optimum plot size for evaluation of grain yield in the
sunflower was 2.52 m2 (working area) considering a border
of one row at the sides, this being smaller than the size
generally used in research with sunflower crops (8.64 m2);
2. Greater gains in experimental precision (16%) with
increases in plot size, occurred up to 8 basic units (5.04 m2),
using seven replications;
3. An increase in the number of replications and in plot size were more efficient in increasing experimental precision than an increase in the number of cultivars.
REFERENCES
BRUM, B.et al. Tamanho ótimo de parcela para ensaios com
sorgo granífero em duas épocas de semeadura.Ciência Rural, v. 38, n. 2, p. 315-320, 2008.
CARGNELUTTI FILHO, A. et al. Medidas de precisão
experimental e número de repetições em ensaios de genótipo de arroz irrigado.Pesquisa Agropecuária Brasileira, v. 47, n. 3, p. 336-343, 2012.
DONATO, S. L. R. et al. Estimativas de tamanho de parcelas para avaliação de descritores fenotípicos em bananeira.Pesquisa Agropecuária Brasileira, v. 43, n. 8, p. 957-969, 2008. HATHEWAY, E. H. Convenient plot size.Agronomy Journal, v. 53, n. 4, p. 279-280, 1961.
HENRIQUES NETO, D. et al. Tamanho de parcelas em
experimentos com trigo irrigado sob plantio direto e convencional.Pesquisa Agropecuária Brasileira,v. 39, n. 6, p. 517-524, 2004.
LORENTZ, L. H.et al. Plot size and experimental precision
for sunflower production.Scientia Agrícola, v. 67, n. 4, p. 408-413, 2010.
LÚCIO, A. D. et al. Estimativa do tamanho de parcela para experimento com alface.Horticultura Brasileira, v. 29, n. 4, p. 510-515, 2011.
LÚCIO, A. D. et al. Tamanhos de amostras e de parcelas para variáveis de crescimento e produtivas de tomateiro.
Horticultura Brasileira, v. 30, n. 4, p. 660-668, 2012. MARTIN, T. N.et al. Definição de plano experimental para comparações de cultivares de milho em áreas limitadas.
Revista Brasileira de Milho e Sorgo, v. 3 n. 3, p. 325-332, 2004.
OLIVEIRA, I. R. et al.. Avaliação de cultivares de girassol
em municípios dos Estados da Bahia, Alagoas, Sergipe e Rio Grande do Norte: ensaios realizados no ano agrícola de 2008.
Comunicado Técnico, n. 105, 2010. 6 p.
PIMENTEL GOMES, F. Novos aspectos do problema do tamanho ótimo das parcelas em experimentos com plantas arbóreas.Pesquisa Agropecuária Brasileira, v. 23, n. 1, p. 59-62, 1988.
PIMENTEL GOMES, F. O problema do tamanho das parcelas em experimentos com plantas arbóreas. Pesquisa Agropecuária Brasileira, v. 19, n. 12, p. 1507-1512, 1984. SANTOS, D.et al. Tamanho ótimo de parcela para a cultura
do feijão-vagem.Revista Ciência Agronômica, v. 43, n. 1, p.119-128, 2012.
SILVA, J. R. da.Tamanho de parcela e efeito de bordadura em experimentos com meloeiro. 2009. 142 f. Tese (Doutorado em Fitotecnia) - Universidade Federal Rural do Semi-Árido, Mossoró, 2009.
Table 4 - Difference between the means for two cultivars as a percentage of the expected detected mean, in the evaluation of grain yield in the sunflower, considering different plot sizes (BU), number of cultivars and replications, estimated by Hatheway’s method. Mossoró RN, UFERSA 20131
¹BU (Basic Unit) = 0,7 m x 0,9 m; b = heterogeneity coefficient of the soil = 1,0585; CV1 = CV of plots made up of one BU = 31,57%
Number of Cultivars
BU
4 8 12 16
Nbr of Replications Nbr of Replications Nbr of Replications Nbr of Replications
3 5 7 3 5 7 3 5 7 3 5 7
Differences between Means for Two Cultivars in % of the Mean (d)
2 59.89 42.22 34.65 53.82 40.16 33.56 52.37 39.65 33.28 51.73 39.40 33.17
4 41.50 29.26 24.01 37.29 27.83 23.25 36.29 27.48 23.06 35.84 27.30 22.99
6 33.48 23.61 19.37 30.09 22.46 18.76 29.28 22.17 18.61 28.92 22.03 18.55
8 28.75 20.27 16.63 25.84 19.28 16.11 25.14 19.04 15.98 24.84 18.92 15.93
10 25.55 18.02 14.78 22.96 17.14 14.32 22.34 16.92 14.20 22.07 16.81 14.15
SILVA, R. L. et al. Determinação do tamanho ótimo da parcela experimental pelos métodos da máxima curvatura modificado, do coeficiente de correlação intraclasse e da análise visual em testes clonais de eucalipto.Revista Árvore, v. 27. n. 25, p. 669-676, 2003. SMIDERLE, J. O. Efeito residual de doses de calcário na produtividade, teor e acidez de óleo do girassol produzido em cerrado de Roraima.Comunicado Técnico, n. 57, 2010. 5 p. SMITH, H. F. An empirical law describing heterogeneity in yields of agricultural crops.Journal Agricultural Science, v. 28, n. 1, p. 1-23, 1938.
STORCK, L.; BISOGNIN, D. A.; OLIVEIRA, S. J. R. Dimensões dos ensaios e estimativas do tamanho ótimo de parcela em batata.Pesquisa Agropecuária Brasileira, v. 41, n. 6, p. 903-909, 2006.
STORCK, L. et al. Experimentação vegetal. 2. ed. Santa
Maria: UFSM, 2006. 198 p.
STORCK, L. et al. Persistência do plano experimental em