© 2018 Sociedade Brasileira de Zootecnia ISSN 1806-9290
www.sbz.org.br
R. Bras. Zootec., 47:e20180018, 2018 https://doi.org/10.1590/rbz4720180018
Forage crops
Beef cattle performance in response to Ipyporã and Marandu brachiariagrass
cultivars under rotational stocking management
Valéria Pacheco Batista Euclides1 , Nayana Nazareth Nantes2 , Denise Baptaglin Montagner1* , Alexandre Romeiro de Araújo1 , Rodrigo Amorim Barbosa1, Ademir Hugo Zimmer1,
Cacilda Borges do Valle1
1 Embrapa Gado de Corte, Campo Grande, MS, Brasil.
2 Universidade Federal de Mato Grosso do Sul, Programa de Pós-graduação em Ciência Animal, Campo Grande, MS, Brasil.
Abstract - The objective of this two-year study was to evaluate live weight gain per animal and per area and their relationships with the characteristics of BRS Ipyporã (Brachiaria ruziziensis × Brachiaria brizantha) and Marandu (Brachiaria brizantha) pastures. A completely randomized block design was used with two treatments and four replicates. The grazing method was rotational stocking, with variable stocking rate. Stocking rate was adjusted twice a week during the grazing period (six or seven days) and post-grazing canopy height target of 15 cm. Animals were weighed every 28 days. Pastures were evaluated pre-grazing to estimate forage accumulation rate, forage mass (FM), leaf (LP) and stem (SP) percentages, and nutritive value. In the post-grazing, FM, LP, and SP were evaluated. Marandu palisadegrass pastures had greater FAR, pre-grazing FM, and hence, a greater SR when compared with BRS Ipyporã. However, compared with Marandu, BRS Ipyporã showed greater LP, leaf:stem ratio, crude protein, and in vitro organic matter digestibility, resulting in greater individual live weight gain. The lesser stocking rate in Ipyporã pastures was compensated, providing a greater individual live weight gain of steers, resulting in a similar live weight gain per area
for the two cultivars. Thus, BRS Ipyporã is a good alternative for the diversification of pastures in the Cerrado region.
Key Words: canopy structure, forage accumulation, nutritive value, stocking rate
Received: January 26, 2018
Accepted: June 22, 2018
*Corresponding author: [email protected]
Copyright © 2018 Sociedade Brasileira de Zootecnia. This is an Open Access article distributed under the terms of the Creative Commons Attribution License (http://creativecommons.org/licenses/by/4.0/), which permits unrestricted use, distribution, and reproduction in any medium, provided the original work is properly cited.
Introduction
Despite the significant efforts of Brazilian research institutions to release grass cultivars, with traits that contribute to greater animal production efficiency, the number of cultivars effectively used is still small. Thus, few cultivars are grown over extensive areas in Central Brazil, leading to the high vulnerability of production systems, due to factors related to biotic and abiotic stresses (Valle et al., 2009; Jank et al., 2011). Examples of the vulnerability of Brazilian pastures include the significant reduction in B. decumbens cv. Basilisk due to attack by spittlebugs in the
1970s (Valério and Nakano, 1988). In the last two decades, spittlebugs of the genus Mahanarva have caused significant
damage in the central-northern Mato Grosso, southern Pará, northern Tocantins, Rondônia, and Acre (Valério, 2006) states mainly on Marandu palisadegrass (Valério, 2009).
The damage to pastures attacked by spittlebugs is a significant problem for Brazilian beef and dairy production. According to Valério and Koller (1993), chemical control has both ecological and economic limitations; therefore, the use of resistant cultivars is the best alternative to control this pest. In this context, the interspecific hybrid
of Brachiaria BRS Ipyporã was developed by crossing a
genotype of B. ruziziensis and an accession of B. brizantha,
with the objective of introgressing resistance to spittlebugs in the new cultivar (MAPA, 2015). Valério et al. (2011, 2012) evaluated the resistance of Brachiaria spp. hybrids to the following species of spittlebugs: Notozulia entreriana,
Deois flavopicta, Mahanarva fimbriolata, and Mahanarva
sp. They observed a high level of antibiosis in BRS Ipyporã, with low percentages of spittlebug survival and prolonged nymphal periods, which indicate the inadequacy of this cultivar as a host plant for these pests. Marandu palisadegrass has presented resistance to attack of these species of spittlebugs, but this cultivar is not resistant to the insects of the Mahanarva genus (Valério, 2009).
B. brizantha. According to Lopes et al. (2010), the better
nutritive value of B. ruziziensis cv. Comum compared
with that of B. brizantha cv. Marandu could be attributed to greater rates of degradation and effective ruminal degradability of dry matter and crude protein, in addition to the lower concentration of neutral detergent fiber associated to its greater degradation rate. Based on these results, we can assume that B. ruziziensis, parent of Ipyporã grass, may have influenced the noteworthy nutritive value of this hybrid.
The objective of the present study was to evaluate two cultivars of Brachiaria spp. (Ipyporã and Marandu) to compare their canopy structure, herbage accumulation, nutritive value, and animal performance.
Material and Methods
The work was conducted in accordance with ethical standards and approved by the Ethics and Biosafety Committee. Research on animals was conducted according to the local committee on animal use (case no. 739/2015).
The experiment was conducted in Campo Grande, MS, Brazil (20º27′ S, 54º37′ W, and elevation of 530 m) from October 2012 until September 2014. According to the Köppen classification (1948), the climate is rainy tropical savannah, corresponding to Aw subtype, characterized by a seasonal distribution of rainfall, with a well-defined occurrence of the dry period during the colder months. Average annual rainfall is about 1500 mm, of which 80% falls during the seven-month rainy period
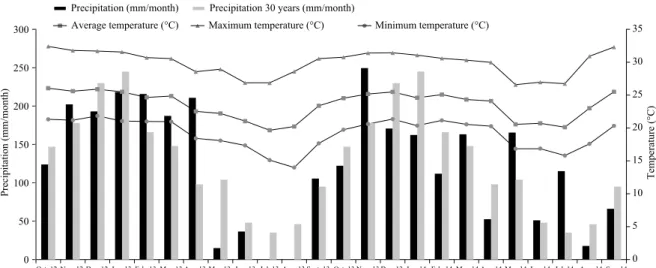
(October-April). Weather data during the experimental period were collected from a meteorological station located 2 km from the research site (Figure 1). The average temperature and monthly precipitation were used to calculate the water balance (Figure 2). The soil water storage capacity was determined to be 75 mm.
The soil in the experimental area is a Dystrophic Red Latosol (FAO, 2006). Before pasture establishment, soil samples were collected from the 0-20 cm layer. Soil chemical characteristics were as follows: pH (CaCl2), 5.34; 53.1%
base saturation; 0.6% aluminum saturation; 3.5% organic matter; 7.8 mg dm−3 P (Mehlich 1); and 108.5 mg dm−3 K (Mehlich 1).
In January 2012, the soil was fertilized with 70 kg ha−1 of P2O5 (triple superphosphate), 70 kg ha−1 of K2O (KCl), and 36 kg ha−1 of FTE (35 g kg−1 of Zn, 35 g kg−1 of Cu, 15 g kg−1 of B, and 4 g kg−1 of Mo). Then, 5.0 kg ha−1 pure viable seeds of Brachiaria cultivars BRS Ipyporã and Marandu were sown, in a no-tillage system, with spacing of 30 cm between rows. In April 2012, a lenient grazing was carried out to stimulate appearance of new tillers. The animals were kept out of the paddocks and, in May, fences started to be built, and drinking troughs were installed. The grazing trial started in October 29, 2012.
The maintenance fertilization was carried out under covering in September 2013, with application of 80 kg ha−1 of P2O5 and K2O. Nitrogen fertilization consisted of 150 kg ha−1 per year of nitrogen applied as urea, divided into three applications performed in November, January, and March.
Experimental period from 10/29/2012 to 09/26/2014.
Figure 1 - Precipitation and average, minimum, and maximum temperatures during the experimental period and average rainfall for the last 30 years.
0 5 10 15 20 25 30 35
0 50 100 150 200 250 300
Oct. 12 Jul. 13 Apr. 14
Temperature (°C)
Precipitation (mm/month)
Precipitation (mm/month) Precipitation 30 years (mm/month)
Average temperature (°C) Maximum temperature (°C) Minimum temperature (°C)
The experimental area was 7.6 ha, divided into eight pastures of 0.94 ha each, and these pastures were subdivided into five paddocks of 0.19 ha each. The grazing method was rotational stocking, with fixed and predefined grazing and rest periods, respectively, of 7 and 28 days during the spring, winter, and autumn and 6 and 24 days in the summer. A completely randomized block experimental design was used, with two treatments and four replicates. The treatments were the interspecific hybrid of Brachiaria
ruziziensis and Brachiaria brizantha BRS Ipyporã and
Brachiaria brizantha cv. Marandu.
Each experimental unit (set of five paddocks) was grazed by three Brangus (½ Brahman (Bos indicus) × ½ Angus (Bos taurus)) tester steers, which were approximately nine months old and had an initial average weight of 200±23 kg. The steers were distributed according to weight so that the average weight in each pasture was the same. These animals remained in the same pastures for one year as tester animals, when they were replaced with other animals of the same breed and category. Sixty-six grazer steers similar to the tester steers in weight, age, background, and breeding were kept in the reserve pasture (7.5 ha Marandu grass) and were used to adjust the stocking rates. Grazer steers were added to or removed from all the paddocks aiming to reach the predetermined post-grazing height (15 cm) and a fixed grazing period (six or seven days), according to herbage accumulation rate in each season.
All pasture measurements, in pre- and post-grazing, were estimated in one selected randomized paddock out of five paddocks in each pasture (experimental unit), at each grazing cycle. For forage mass (FM) determination, nine samples (1 m2) were randomly selected and harvested at
soil level, using a manual mower, in each paddock. The nine samples were weighed to determinate the green weight and then each one was divided into two sub-samples. One sub-sample was weighed, placed in paper bags, dried in a
Figure 2 - Water deficit and excess in the soil during the experimental period from 10/29/2012 to 09/26/2014. -100
-50 0 50 100 150
Water balance (mm)
Deficit Excess
Oct. 12Nov. 12Dec. 12Jan. 13Feb. 13Mar. 13Apr. 13May. 13Jun. 13Jul. 13Aug. 13Sep. 13Oct. 13Nov. 13Dec. 13Jan. 14Feb. 14Mar. 14Apr. 14May.14Jun. 14Jul. 14Aug. 14Sep. 14
forced-air oven at 55 ºC to constant weight, and weighed again for estimation of the forage mass results (nine sub-samples). The other sub-samples were grouped each three, totaling three samples by paddock, and then separated into leaf (leaf blade), stem (true stems plus leaf sheath), and dead material; the percentage of the total dry weight for each component was determined, and the leaf:stem ratio (LSR) calculated. The daily forage allowance (DFA) (Allen et al., 2011) was calculated by dividing the FM by the total live weight of animals per paddock and divided by the number of days between samplings.
The forage accumulation rate (FAR) was calculated as the difference between the current pre-grazing and preceding post-grazing sampling of FM, considering only the green portion (leaves and stems) divided by the number of days between samples. For leaf blade accumulation rate (LBAR), we used the same procedure, considering the percentage of leaf blades in the samples.
In a second paddock out of the five of each pasture, three stratified samples were collected, in pre-grazing. The frame (1 m2) was allocated in areas that were
representative of the average canopy condition (based on visual assessment of height and forage mass). The forage was cut into two vertical strata: 0-15 cm height and above 15 cm. An adjustable frame was used to cut the forage at the required height. Samples from each stratum were weighed and handled in a similar way as described above to estimate FM and its morphological components. Bulk density (BD) was calculated by dividing the FM by the height of each stratum.
measured immediately before animals entered and as soon as the animal left each paddock.
Leaf blade and stem provided from pre-grazing forage mass and two vertical strata samples were dried at 55º C during 72 h, then ground, passed through a 1-mm screen, and analyzed for crude protein (CP), neutral detergent fiber (NDF), acid detergent lignin (ADL), and in vitro organic matter digestibility (IVOMD) via near-infrared reflectance spectroscopy (NIRS) according to Marten et al. (1985). The curves were calibrated in a FOSS NIRSystems Model 5000, using ISI WINISI II Project Manager V1.02 software. The IVOMD analysis was performed according to the Tilley and Terry (1963) method.
Tester and grazer animals were weighed monthly following a 16-h fast. The average daily gain (ADG) was calculated as the increase in live weight difference of the testers divided by the number of days between weighing.
The stocking rate (SR) per cycle was calculated as the sum of days the animals (tester and grazer steers) remained in each of five paddocks (0.19 ha) divided by the total number of grazing days of a complete cycle and divided by the pasture area (0.94 ha). It was expressed in animal units (450 kg live weight) per hectare. The live weight gain per area (GPA) was calculated as the product of average daily live weight gain of tester steers and the total number of animals (tester and grazer) per pasture and grazing cycle.
The data were grouped by season (summer, autumn, winter, and spring) based on the calendar. The experimental unit for both vegetation and animal data was the pasture (set of five paddocks). The data were subjected to an analysis of variance using the MIXED procedure in SAS (Statistical Analysis System, version 9.4). The Akaike information criterion was used to select the covariance matrix (Wolfinger, 1993). The applied model included the random effect of blocks and fixed effects of grass cultivar, experimental year, season of the year, and their interactions. For the stratified forage samples, the same model was applied, but the effect of the strata was added and considered fixed. Average daily gain was analyzed using multivariate repeated measures analysis according to Littell et al. (2000). Averages were compared using the Tukey test at P<0.05. When the interactions were significant, averages were compared using the probability of difference and the Tukey test at P<0.05.
Results
No cultivar × season, cultivar × year, or cultivar × season × year interactions on variables associated with pastures traits, in pre- and post-grazing conditions, were
observed (P<0.05). Significant effect was observed (P>0.05) by cultivar, season, and years in pre-and post-grazing forage variables and on animal responses.
Forage mass, total forage accumulation (TFA), FAR, CH, and stem (SP) and dead material (DMP) percentages of Ipyporã grass were lower compared with Marandu, in pre-grazing condition (Table 1). However, leaf percentage (LP) and LSR were greater for Ipyporã pastures compared with those for Marandu. Leaf accumulation rate (P = 0.2648), forage allowance (FA; P = 0.7485) and BD (P = 0.7226) were similar by cultivars. The mean and standard errors of the means were 27.1±1.3 kg ha−1 per day; 8.2±1.4 kg dry mater per 100 kg live weight per day, and 123.9±8.4 kg ha−1
per cm, respectively.
Forage accumulation rate (P = 0.0338) and LP (P= 0.0433) had significant effect of season × experimental year interaction (Table 2), in pre-grazing condition. Forage accumulation rate was greater during spring and summer in the first experimental year than in the second; however, there was no difference between the two years during autumn and winter. Regardless of the experimental year, FAR was greater in summer, lesser in winter, and intermediate in spring and autumn. Leaf percentage in pre-grazing was similar for the two years, independently of the seasons (Table 2). The highest LP was recorded in summer and lowest in winter, whereas intermediate values were observed in autumn and spring of the first experimental year. During the second year, LP was greater in spring and summer in comparison with autumn and winter.
Interaction (P>0.05) between season × experimental year was not observed for the other variables; however, a seasonal effect was detected (Table 3). In pre-grazing condition, FM was greater in summer and autumn than in winter and spring. Forage allowance was greater in winter, lesser in summer and autumn, and intermediate in spring. Canopy height was greater in spring and summer than in autumn and winter. Bulk density was lower in spring compared with the other seasons. Stem percentage was highest in autumn, intermediate in summer and winter, and lowest in spring. Dead material percentage was greater in winter, followed by spring, autumn, and summer. The leaf:stem ratio was highest in spring, intermediate in summer, and lowest in autumn and winter.
Greater FM, TFA, and SP in pre-grazing were recorded in the first experimental year compared with the second. The opposite was recorded for DMP (Table 4).
2304±52 kg ha−1, and 55.5±0.8%. However, post-grazing
LP was lower (P = 0.0071) and SP was greater (P = 0.0001) in Marandu than in Ipyporã pasture. The means and their
standard errors were 20.7 and 18.6±0.6% of leaf, 22.9 and 26.8±0.5% of stem for Ipyporã and Marandu pastures, respectively.
There was no interaction (P>0.05) between season and experimental year for the variables evaluated in post-grazing. However, a seasonal variation was observed for some characteristics (Table 7). Canopy height was greater in summer, intermediate in spring and autumn, and lowest in winter. Forage mass was greater in summer when compared with the other seasons. Leaf percentage was greater in summer, intermediate in spring, and lowest during autumn and winter. Greater SP was observed in summer and autumn than in spring and winter. Dead material percentage was greater in winter, followed by spring, autumn, and summer.
Likewise, differences were observed between the experimental years in post-grazing condition (Table 8). Forage mass, CH, and SP were greater in the first experimental year compared with the second. The opposite was observed for DMP. However, LP was similar
Table 1 - Means for pre-grazing forage characteristics, leaves and stems nutritive values, and animal responses in BRS Ipyporã and Marandu pastures
Variable Cultivar SEM P-value
Ipyporã Marandu
Plant responses Forage mass (kg ha−1) 3,205 3,795 90 0.0025
Total forage accumulation
(kg ha−1 year) 13,260 15,470 315 0.0256
Forage accumulation rate (kg ha−1 day) 40.1 46.8 2.3 0.0058
Canopy height (cm) 27.0 31.0 0.7 0.0350
Leaf (%) 46.3 38.8 1.1 0.0001
Stem (%) 19.0 22.2 0.6 0.0135
Dead material (%) 34.7 39.0 1.2 0.0261
Leaf:stem ratio 2.4 1.7 0.1 0.0001
Nutritive value
Crude protein in leaves (g kg−1) 126 111 3.0 0.0454
In vitro organic matter digestibility in
leaves (g kg−1) 680 620 7.0 0.0014
Neutral detergent fiber in leaves (g kg−1) 677 700 4.0 0.0039
Crude protein in stems (g kg−1) 80 60 2.0 0.0105
In vitro organic matter digestibility in
stems (g kg−1) 587 525 7.0 0.0081
Neutral detergent fiber in stems (g kg−1) 743 772 5.0 0.0054
Animal responses Stocking rate (AU ha−1)1 3.0 3.6 0.14 0.0036 Average daily gain (kg animal−1) 0.675 0.580 0.01 0.0001
SEM - standard error of mean; AU - animal unit.
1 AU = 450 kg body weight.
P-value = significance level.
Table 2 - Means for forage accumulation rate, leaf percentage in pre-grazing condition, and stocking rate in Brachiaria
spp. Ipyporã and Marandu pastures subjected to rotational grazing for different seasons and experimental years
Experimental year Season
Spring Summer Autumn Winter
Forage accumulation rate (kg ha−1 day)
First 58.1Aab
(3.5)
60.1Aa (2.1)
49.4Ab
(3.4) 8.3Ac(3.2)
Second 37.7Bb (2.8) 53.0Ba (2.9) 43.1Aab (2.8) 9.5Ac (3.7) Leaf (%) First 42.7Ab (3.0) 55.3Aa (1.7) 44.5Ab (2.6) 26.8Ac (3.5) Second 48.0Aa (1.9) 50.9Aa (1.9) 37.9Ab (1.9) 27.8Ac (1.7) Stocking rate (AU ha−1)1
First 4.3Ab (0.2) 5.2Aa (0.1) 3.8Ab (0.2) 1.4Ac (0.1) Second 2.7Bc (0.2) 4.3Ba (0.2) 3.5Ab (0.1) 1.5Ad (0.2)
AU - animal unit.
1 AU = 450 kg body weight.
Means followed by same lowercase letter within rows or means followed by the same uppercase letter in columns do not differ (P>0.05) by the Tukey’s test.
Values in parentheses are standard errors of the mean.
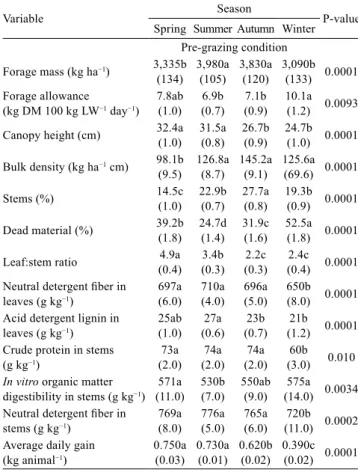
Table 3 - Means for forage characteristics, forage components, nutritive value of forage in leaves and stems in pre-grazing condition, and average daily gain in Brachiaria
spp. Ipyporã and Marandu pastures subjected to rotational grazing for seasons
Variable Season P-value
Spring Summer Autumn Winter Pre-grazing condition
Forage mass (kg ha−1) 3,335b(134) 3,980a (105) 3,830a (120) 3,090b (133) 0.0001 Forage allowance
(kg DM 100 kg LW−1 day−1) 7.8ab (1.0) 6.9b (0.7) 7.1b (0.9) 10.1a (1.2) 0.0093
Canopy height (cm) 32.4a
(1.0) 31.5a (0.8) 26.7b (0.9) 24.7b (1.0) 0.0001
Bulk density (kg ha−1 cm) 98.1b (9.5) 126.8a (8.7) 145.2a (9.1) 125.6a (69.6) 0.0001
Stems (%) 14.5c
(1.0) 22.9b (0.7) 27.7a (0.8) 19.3b (0.9) 0.0001
Dead material (%) 39.2b (1.8)
24.7d (1.4) 31.9c(1.6)
52.5a (1.8) 0.0001
Leaf:stem ratio (0.4)4.9a 3.4b (0.3)
2.2c (0.3)
2.4c
(0.4) 0.0001
Neutral detergent fiber in
leaves (g kg−1)
697a (6.0)
710a
(4.0) 696a(5.0) 650b (8.0) 0.0001 Acid detergent lignin in
leaves (g kg−1)
25ab (1.0) 27a (0.6) 23b (0.7) 21b (1.2) 0.0001
Crude protein in stems
(g kg−1)
73a (2.0) 74a (2.0) 74a (2.0) 60b (3.0) 0.010 In vitro organic matter
digestibility in stems (g kg−1) 571a (11.0) 530b (7.0) 550ab (9.0) 575a (14.0) 0.0034 Neutral detergent fiber in
stems (g kg−1)
769a (8.0) 776a (5.0) 765a (6.0) 720b (11.0) 0.0002 Average daily gain
(kg animal−1)
0.750a (0.03) 0.730a (0.01) 0.620b (0.02) 0.390c (0.02) 0.0001
DM - dry matter; LW - live weight;
Means followed by same letter within rows do not differ (P>0.05) by the Tukey’s test. Values in parentheses are standard errors of the mean.
Table 4 - Means for forage characteristics, forage components, and nutritive value of stems and leaves in pre-grazing; body weight gain per area; forage characteristics and components in post-grazing in Brachiaria spp. Ipyporã and Marandu pastures subjected to rotational grazing for different experimental years
Variable Experimental year P-value
First Second
Pre-grazing condition
Forage mass (kg ha−1) 3,815 (103) 3,185 (76) 0.0001
Total forage accumulation (kg ha−1 year) 15830 (465) 12900 (390) 0.0079
Stem (%) 22.7 (0.7) 19.5 (0.5) 0.0007
Dead material (%) 34.5 (1.4) 40.0 (1.1) 0.0028
Crude protein in leaves (g kg−1) 110 (0.3) 126 (0.3) 0.0001
In vitro organic matter digestibility in leaves (g kg−1) 634 (7.0) 667 (7.0) 0.0001
Neutral detergent fiber in leaves (g kg−1) 713 (4.0) 664 (4.0) 0.0001
Acid detergent lignin in leaves (g kg−1) 27 (0.6) 22 (0.6) 0.0001
Crude protein in stems (g kg−1) 65 (2.0) 75 (2.0) 0.0001
In vitro organic matter digestibility in stems (g kg−1) 522 (8.0) 591 (7.0) 0.0001
Neutral detergent fiber in stems (g kg−1) 782 (5.0) 734 (5.0) 0.0001
Acid detergent lignin in stems (g kg−1) 37 (0.7) 34 (0.7) 0.0002
Body weight gain per area (kg ha−1 per year) 1,260 (19) 1,080 (19) 0.0001
Values in parentheses are the standard errors of the mean. P-value = significance level.
Table 5 - Means for leaf and stem percentages and leaf:stem ratio in vertical strata of Brachiaria spp. Ipyporã and Marandu pastures subjected to rotational grazing
Strata Ipyporã Marandu SEM
Leaf (%)
0-15 cm 31.3Ba 26.5Ba 2.8
>15 cm 79.5Aa 63.4Ab 1.5
Stem (%)
0-15 cm 22.9Aa 23.7Aa 0.7
>15 cm 9.6Bb 14.9Ba 0.8
Leaf:stem ratio
0-15 cm 1.5Ba 1.2Ba 1.0
>15 cm 8.3Aa 4.2Ab 1.1
SEM - standard errors of the mean.
Means followed by same lowercase letter within rows or means followed by the same uppercase letter in columns do not differ (P>0.05) by the Tukey’s test.
Table 6 - Means for forage characteristics and nutritive value in leaves and stems in the vertical strata in pre-grazing condition of Brachiaria spp. Ipyporã and Marandu pastures subjected to rotational grazing
Variable Strata P-value
0-15 cm >15 cm
Forage condition
Forage mass (kg ha−1) 2.662 (63)1.411 (65) 0.0001 Bulk density (kg ha−1 per cm) 180 (4.2) 82 (4.4) 0.0001 Dead material (%) 50.3 (1.1) 13.7 (1.3) 0.0001
Nutritive value
Crude protein in leaves (g kg−1) 111 (2.0) 125 (2.0) 0.0002
In vitro organic matter digestibility in
leaves (g kg−1) 614 (5.0) 640 (6.0) 0.0007 Acid detergent lignin in leaves (g kg−1) 27 (0.4) 24 (0.3) 0.0003
Crude protein in stems (g kg−1) 62 (2.0) 75 (2.0) 0.0001
In vitro organic matter digestibility in
stems (g kg−1) 523 (5.0) 552 (6.0) 0.0002
Values in parentheses are standard errors of the means. P-value = significance level.
Table 7 - Means for forage characteristics and forage components in post-grazing condition in Brachiaria spp. Ipyporã and Marandu pastures subjected to rotational grazing for seasons
Variable Season P-value
Spring Summer Autumn Winter
Post-grazing condition
Canopy height (cm) 14.8bc
(0.21) 15.9a (0.16)
15.2ab (0.19)
13.9c
(0.22) 0.0001
Forage mass (kg ha−1) 2,230b (80)
2,585a (60)
2,250b (66)
2,145b
(80) 0.0001
Leaf (%) 21.6b
(1.1)
25.7a (0.9)
18.9c (1.0)
16.9c
(0.8) 0.0001
Stem (%) 15.6b
(1.0)
31.0a (0.8)
29.1a (0.9)
16.1b
(1.0) 0.0001
Dead material (%) 61.9b (1.2)
43.7d
(0.9)
50.8c (1.0)
65.5a
(1.1) 0.0001
Means followed by same letter within rows do not differ (P>0.05) by the Tukey’s test.
Values in parentheses are standard errors of the mean. P-value = significance level.
Table 8 - Means for forage characteristics and components in post-grazing condition in Brachiaria spp. Ipyporã and Marandu pastures subjected to rotational grazing for different experimental years
Variable
Experimental year
P-value First Second
Post-grazing condition
Canopy height (cm) 16.1 (0.3) 13.8 (0.2) 0.0001
Forage mass (kg/ha) 2,365 (31) 2,040 (25) 0.0001
Stem (%) 26.5 (0.5) 23.2 (0.4) 0.0004
Dead material (%) 53.1 (0.8) 57.3 (0.7) 0.0001
(P = 0.0559) for both experimental years, with a mean and standard error of 19.7±0.7%.
Greater CP and IVOMD and lesser NDF concentration were observed in Ipyporã grasses, in both leaves and stems, when compared with those of Marandu (Table 1). However, lignin in acid detergent percentage in leaves (P = 0.9009) and stems (P = 0.2189) were similar for both grasses with means and standard errors of the means of 24±0.6 g kg−1
and 35±0.6 g kg−1, respectively.
Season × experimental year interaction was not observed (P>0.05) for nutritional variables, but seasonal variations were observed for some of the variables (Table 3). In the leaf component, the NDF concentration was lowest in winter compared with the other seasons, and ADL percentage was greater during summer, intermediate in spring, and lowest in autumn and winter. However, there was no variation in CP and IVOMD in leaves throughout the year. The means and standard errors of the means were 118±4.0 g kg−1 and 650±10.0 g kg−1, respectively.
In the stem component, CP and NDF concentrations were lowest in winter compared with the other seasons (Table 3). The IVOMD percentage was highest during spring and winter, intermediate in autumn, and lowest in summer. However, there was no seasonal variation in the concentration of ADL, with the mean and its standard error of 38±1.0 g kg−1.
Greater CP and IVDOM and lower NDF and ADL concentrations, for both leaves and stems in pre-grazing condition, were observed in the second experimental year compared with the first (Table 4).
Cultivar × stratum interaction for LP (P = 0.0328) and SP (P = 0.0153), and for LSR (P = 0.0001) were observed (Table 5). Regardless of the cultivar, SP decreased, but LP and LSR increased from the base to the top of the canopy (Table 5). Leaf percentage, SP, and LSR were similar for both cultivars, in the lower strata (0-15 cm). However, in the upper strata (>15 cm), higher LP and LSR and lower SP were observed for Ipyporã than for Marandu pastures.
Cultivar × stratum interaction, or cultivar treatment effects were not observed on FM, BD, and DMP in the vertical profile of the canopy. However, FM, BD, and DMP decreased from the base to the top of the canopy (Table 6) in pre-grazing stratum evaluation.
Crude protein and IVOMD in leaves and stems increased from the base to the top of the canopy, and the inverse was observed for ADL percentages in leaves (Table 6). Furthermore, the content of NDF in leaves (P = 0.0974) and stems (P = 0.6617) and ADL in stems (P = 0.0620) had no difference of stratum, which had means and standard errors of 693±3.0, 777±3.0, and 38±1.0 g kg−1, respectively.
Stocking rate was greater in Marandu than in Ipyporã pasture (Table 1). Conversely, greater average daily gain was observed for Ipyporã compared with Marandu pasture, whereas live weight gain per area was similar (P = 0.1735) for both cultivars. The mean and standard error of the mean were 1,170±19 kg ha−1 per year.
No season × experimental year interaction effect was observed for ADG and GPA (P>0.05), but a significant effect (P = 0.0388) of SR was observed (Table 2). Stocking rate was greater during spring and summer in the first experimental year than in the second; however, there was no difference between the two years during autumn and winter. Regardless of the experimental year, SR was greater in summer, lesser in winter, and intermediate in spring and autumn.
Seasonal effect was observed for ADG (Table 3). Average daily gain was greater in spring and summer, intermediate in autumn, and lowest in winter.
Greater GPA was recorded in the first experimental year compared with the second (Table 4). On the other hand, there was no difference between experimental years for ADG (P = 0.0836), with a mean and standard error of 9.3±1.2 kg dry mater per 100 kg live weight per day and 0.627±0.02 kg animal−1.
Discussion
As the interval between grazing was similar for both cultivars, the greater TFA and FAR in Marandu pastures resulted in greater FM and CH in pre-grazing (Table 1). Consequently, a greater number of animals (Table 1) were required to graze down the canopy to the predetermined post-grazing height of 15 cm. However, greater ADG was observed with animals grazing Ipyporã pastures (Table 1), which in part could be explained by the greater nutritive value of both leaves and stems (Table 1). It is worth mentioning that the number of extra animals (0.6 AU ha−1) used in Marandu pastures did not offset the lower ADG observed in that pasture, resulting in similar GPA for both cultivars (1,170 kg ha−1 per year).
In this context, Sousa Sobrinho et al. (2011) and Rodrigues et al. (2014) observed that the forage production of B. ruziziensis cv. Comum was lower than that of
Marandu. On the other hand, Hughes et al. (2000) and Herrero et al. (2001) observed higher CP and IVOMD and lower concentrations NDF and lignin in the ecotypes of
B. ruziziensis compared with the ecotypes of B. brizantha.
According to Lopes et al. (2010), the better nutritive value of B. ruziziensis cv. Comum compared with that
greater degradation and effective degradability of dry matter and CP, in addition to the lower concentration of NDF associated with the increased degradation rate of the cell wall. Based on those results, it can be suggested that B. ruziziensis, a parent of Ipyporã, influenced both
lower forage accumulation and higher nutritive value of this hybrid.
Thaikua et al. (2015) estimated the broad sense heritability of the IVOMD of leaves and stems of B. brizantha, B. decumbens, and B. ruziziensis genotypes. The
genotypes of B. ruziziensis had higher IVOMD than those of other species. Moreover, the broad sense heritability for digestibility was relatively high, ranging from 0.69 to 0.87 for a single plant. These authors suggested that, among those species, B. ruziziensis is the most appropriate for breeding for high digestibility. In addition, by providing forage of better nutritive value, higher nutrient intake and, consequently, higher animal performance could be expected, which could reduce the beef production cycle by keeping the animals for shorter time under grazing and allowing heifers to be mated at younger ages, contributing to reduction in the greenhouse gas emission per unit of the product (Berndt and Tomkins, 2013)
Besides nutritive value, the canopy structure can significantly influence grazing animal performance (Da Silva et al., 2013; Euclides et al., 2015). Despite the greater FAR observed for Marandu pasture (Table 1), FA and leaf accumulation rate were similar for both cultivars, resulting in greater LP and, consequently, greater LSR for Ipyporã pastures (Table 1). Furthermore, considering the graze horizon (above 15 cm), the LSR for Ipyporã was twice that of Marandu pastures (Table 5), suggesting a more favorable canopy structure for selection and capture by grazing animals. In this context, due to the selectivity of leaves by herbivores (Drescher et al., 2006), the presence of stems in the grazing horizon limits the depth, area, and mass of the bite and, consequently, the instantaneous forage intake (Mezzalira et al., 2014). To maintain the daily forage intake, the animal compensates the low instantaneous intake by increasing the grazing time (Difante et al., 2009; Da Silva et al., 2013). However, this compensation capacity is limited, and the low instantaneous intake of forage can, in many circumstances, restrict the daily intake of the grass (Pérez-Prieto et al., 2011). The animals in Marandu pastures were subjected to a canopy structure with lower nutritive value (Table 1), which probably promoted less daily nutrient intake, resulting in a lower animal performance (Table 1).
The seasonal pattern of FAR (Table 2) is typical of tropical regions, resulting from rainfall seasonality (Figures 1 and 2), in addition to temperature variations
(Figure 1) and photoperiod. A similar pattern in FAR for Marandu pastures was observed by Gimenes et al. (2011) and Da Silva et al. (2013). Regardless of experimental year, the higher FAR during the summer (Table 2) could be explained by the more favorable weather conditions (Figures 1 and 2) and the application of two-thirds of N fertilizer during this season. However, the FM in pre-grazing in that season (Table 3) did not modify by the highest FAR (Table 2), which can be explained by the reduction in the interval between grazing from 28 to 24 days. This adjustment in the management was made to maintain the grazing during the dry season due to the reduction in forage accumulation (Table 2). On the other hand, during wet season, it was possible to reduce the rest period due to the higher FAR (Table 2). This decision was made based on the residue height target. The adjustment in the grazing management was responsible for FA variations during seasons. Because of this, FA was similar during spring, summer, and autumn, but increasing in winter (Table 3).
Throughout the experimental period, SR followed the same pattern of seasonal variation of FAR (Table 2), which was a consequence of the management adopted. Stocking rate was adjusted according to the forage accumulation and to maintain the 15-cm post-grazing target. During summer, the post-grazing height was slightly above 15 cm, resulting in greater FM (Table 3). Therefore, more animals should have been used during the summer to keep the post-grazing height and FM similar to those of the other seasons.
In both years, the marked reduction in FAR during winter (Table 2) resulted mostly from water stress (Figure 2) and from the decrease in temperature (Figure 1) observed during that season. Despite the adjustment of SR (Table 1), CH and FM in pre- and post-grazing still decreased during that season (Table 3). Furthermore, the decreased leaf and increased dead matter presence (Table 3) were related to the low FAR (Table 2) and natural senescence of grasses, which was accelerated by the water deficit during this time of year (Figure 2).
was observed during autumn in the present study (Table 3). These authors also observed that the changes in grazing behavior were not simply a consequence of the decrease in the amount of leaves, but were in part caused by the interference of stems in the selection of the diet. Prache (1997) also observed that reproductive stems reduced the bite mass and increased time per bite area, resulting in lower forage intake than on vegetative structure. These considerations could explain the reduction in animal performance in autumn compared with spring and summer (Table 3), since there was no decrease in nutritive value in autumn compared with the other seasons.
The patterns of variations along the vertical profile of the canopy for FM, canopy structure, and nutritive value for both cultivars (Tables 5, 6) were similar to those found for other tropical grasses (Difante et al., 2009; Euclides et al., 2015). Regardless of the cultivar, the higher nutritional value in the strata above 15 cm (Table 6) could be explained by the removal of this strata during each grazing cycle, consequently greater renewal of leaves and stems.
During spring and summer of the first experimental year, FAR was higher (Table 2), resulting in higher FM (Table 4), SR (Table 2), and GPA (Table 4). This finding may be explained by the better rainfall distribution (Figure 1) in those seasons (October 2012 to March 2013), which resulted in excess of water in the soil from November to March (Figure 2). On the other hand, the rainfall in spring and subsequent summer (2013/2014) was below the historical average, which, coupled with high temperatures (Figure 1), resulted in a positive water balance in the soil only from November to March (Figure 2).
As a result of the increased growth of forage during the first experimental year (Table 2), there were increases in NDF and ADL concentrations and decreases in CP and IVOMD contents in both leaves and stems (Table 4). This finding is consistent with the observations by Van Soest (1994), who demonstrated that with the increased grass growth, there is an increase in cell wall and a decrease in cellular concentration. However, this difference in nutritive value did not reflect on animal performance. Considering that animal performance is a function of nutrient intake, probably the forage intake was lower in the second experimental year. Forage intake is a key determinant of cattle performance in pasture-based production systems. Forage intake depends not only on forage nutritive value, but also on its allowance (Hodgson, 1990; Pérez-Prieto and Delagarde, 2013) and accessibility (Mezzalira et al., 2014), with the latter being directly related to canopy structure. Analyzing the characteristics associated with canopy structure, LSR was similar between years; however, CH in
the post-grazing (Table 8) was lower during the second year (Table 8). According to Amaral et al. (2013) and Mezzalira et al. (2014), CH is the canopy structural characteristic that most strongly influences bite dimensions and forage intake rate. Besides CH in the post-grazing (Table 8), FA also decreased from 9.6 to 7.4 kg of DM per 100 kg of BW per day, respectively, from the first to the second experimental year. It should be noted that FA observed in the second year was lower than the 10-12 kg of DM per 100 kg of BW per day recommended by Hodgson (1990) as FA, in which forage intake would reach its maximum.
The differences between seasons (Table 7) and experimental years (Table 8) for FM, LP, SP, and DMP in the post-grazing sampling (Table 8) reflected the pattern of variation for these variables in the pre-grazing period.
Conclusions
The hybrid BRS Ipyporã (B. ruziziensis x B. brizantha) grass is a good alternative for the diversification of pastures in the Cerrado region, contributing for reducing beef production cycle by keeping the animals for shorter time under grazing and by allowing heifers to mate at younger ages. Additionally, it can be used for feeding nutritionally more demanding categories.
Acknowledgments
Authors thank the Fundação de Apoio ao Desenvolvimento do Ensino, Ciência e Tecnologia do Estado de Mato Grosso do Sul (FUNDECT) and Conselho Nacional de Desenvolvimento Científico e Tecnológico (CNPq), for partial funding of this research; Coordenação de Aperfeiçoamento de Pessoal de Nível Superior (CAPES), for the postgraduation grant of the second author; and CNPq, for the research grant (PQ2) of the third author.
References
Allen, V. G.; Batello, C.; Berretta, E. J.; Hodgson, J.; Kothmann, M.; Li, X.; McIvor, J.; Milne, J.; Morris, C.; Peters, A. and Sanderson,
M. 2011. An international terminology for grazing lands and grazing animals. Grass and Forage Science 66:2-28. https://doi.
org/10.1111/j.1365-2494.2010.00780.x
Amaral, M. F.; Mezzalira, J. C.; Bremm, C.; Trindade, J. K.; Gibb, M. J.; Suñe, R. W. M. and Carvalho, P. C. F. 2013. Sward structure
management for a maximum short-term intake rate in annual ryegrass. Grass and Forage Science 68:271-277. https://doi.
org/10.1111/j.1365-2494.2012.00898.x
Da Silva, S. C.; Gimenes, F. M. A.; Sarmento, D. O. L.; Sbrissia, A. F.;
Oliveira, D. E.; Hernadez-Garay, A. and Pires, A. V. 2013. Grazing behaviour, herbage intake and animal performance of beef cattle heifers on marandu palisade grass subjected to intensities of continuous stocking management. Journal of Agricultural Science 151:727-739. https://doi.org/10.1017/S0021859612000858 Difante, G. S.; Euclides, V. P. B.; Nascimento Júnior, D.; Da Silva, S.
C.; Torres Júnior, R. A. A. and Sarmento, D. O. L. 2009. Ingestive behaviour, herbage intake and grazing efficiency of beef cattle
steers on Tanzania guineagrass subjected to rotational stocking managements. Revista Brasileira de Zootecnia 38:1001-1008. https://doi.org/10.1590/S1516-35982009000600005
Drescher, M.; Heitkönig, I. M. A.; Raats, J. G. and Prins, H. H. T. 2006. The role of grass stems as structural foraging deterrents and their
effects on the foraging behaviour of cattle. Applied Animal Behaviour
Science 101:10-26. https://doi.org/10.1016/j.applanim.2006.01.011
Euclides, V. P. B.; Lopes, F. C.; Nascimento Junior, D.; Da Silva, S. C.;
Difante, G. S. and Barbosa, R. A. 2015. Steer performance on Panicum maximum (cv. Mombaça) pastures under two grazing intensities. Animal
Production Science 56:1849-1856.https://doi.org/10.1071/AN14721.
FAO - Food and Agriculture Organization. 2006. World reference base for soil resources 2006: a framework for international
classification, correlation and communication. FAO, Rome. World Soil Resources Report, 103. 145p.
Gimenes, F. M. A.; Da Silva, S. C.; Fialho, C. A.; Gomes, M. B.; Berndt, A.; Gerdes, L. and Colozza, M. T. 2011. Ganho de peso
e produtividade animal em capim-marandu sob pastejo rotativo e
adubação nitrogenada. Pesquisa Agropecuária Brasileira 46:751-759. https://doi.org/10.1590/S0100-204X2011000700011
Herrero, M.; Valle, C. B.; Hughes, N. R. G.; Sabatel, V. O. and
Jessop, N. S. 2001. Measurements of physical strength and their relationship to the chemical composition of four species of Brachiaria. Animal Feed Science and Technology 92:149-158.
https://doi.org/10.1016/S0377-8401(01)00261-9
Hodgson, J. 1990. Grazing management: science into practice. John Wiley, New York.
Hughes, N. R. G.; Valle, C. B.; Sabatel, V.; Boock, J.; Jessop, N. S. and
Herrero, M. 2000. Shearing strength as an additional selection criterion for quality in Brachiaria pasture ecotypes. Journal of Agricultural
Science 135:123-130. https://doi.org/10.1017/S0021859699008084 Jank, L.; Valle, C. B. and Resende, R. M. S. 2011. Breeding tropical
forages.Crop Breed Applied Biotechnology 11:27-34. https://doi.
org/10.1590/S1984-70332011000500005.
Köppen, W. 1948. Climatologia: con un estudio de los climas de la tierra. Fondo de Cultura Econômica. México. 479p.
Littell, R. C.; Pendergast, J. and Natarajan, R. 2000. Modelling
covariance structure in the analysis of repeated measures data. Statistic in Medicine 19:1793-1819.
https://doi.org/10.1002/1097-0258(20000715)19:13<1793::AID-SIM482>3.0.CO;2-Q
Lopes, F. C. F.; Paciullo, D. S. C.; Mota, E. F.; Pereira, J. C.; Azambuja, A. A.; Motta, A. C. S.; Rodrigues, G. S. and Duque, A. C. A. 2010. Composição química e digestibilidade ruminal
in situ da forragem de quatro espécies do gênero Brachiaria. Arquivo Brasileiro de Medicina Veterinária e Zootecnia
62:883-888. https://doi.org/10.1590/S0102-09352010000400018
MAPA - Ministério da Agricultura, Pecuária e Abastecimento. 2015. National service of cultivars protection. Available at: <http:// extranet.agricultura.gov.br/php/snpc/cultivarweb/cultivares_ protegidas.php> Accessed on: May 16, 2017.
Marten, G. C.; Shenk, J. S. and Barton, F. E. 1985. Near infrared reflectance spectroscopy (NIRS), analysis of forage quality. Agriculture Handbook, 643. 110p.
Mezzalira, J. C.; Carvalho, P. C. F.; Fonseca, L.; Bremm, C.; Cangiano, C.; Gonda, H. L. and Laca, E. A. 2014. Behavioural mechanisms
of intake rate by heifers grazing canopy of contrasting structures. Applied Animal Behaviour Science 153:1-9. https://doi.org/
10.1016/j.applanim.2013.12.014
Pérez-Prieto, L. A. and Delagarde, R. 2013. Meta-analysis of the
effect of pasture allowance on pasture intake, milk production,
and grazing behavior of dairy cows grazing temperate grasslands. Journal of Dairy Science96:6671-6689. https://doi.org/10.3168/
jds.2013-6964
Pérez-Prieto, L. A.; Peyraud, J. L. and Delagarde, R. 2011. Pasture intake, milk production and grazing behaviour of dairy cows grazing low-mass pastures at three daily allowances in winter. Livestock Science 137:151-160. https://doi.org/10.1016/j.livsci.2010.10.013 Prache, S. 1997. Intake rate, intake per bite and time per bite of
lactating ewes on vegetative and reproductive canopys. Applied
Animal Behaviour Science 54:53-64. https://doi.org/10.1016/
S0168-1591(96)01139-2
Rodrigues, R. C.; Sousa, T. V. R.; Melo, M. A. A.; Araújo, J. S.; Lana, R. P.; Costa, C. S.; Oliveira, M. E.; Parente, M. O. M. and Sampaio, I. B. M. 2014. Agronomic, morphogenic and structural
characteristics of tropical forage grasses in northeast Brazil.
Tropical Grasslands – Pasturas Tropicales 2:214-222.
Sousa Sobrinho, F.; Lédo, J. S. and Kopp, M. M. 2011. Estacionalidade
e estabilidade de produção de forragem de progênies de Brachiaria
ruziziensis. Ciência e Agrotecnologia 35:685-691. https://doi.
org/10.1590/S1413-70542011000400006
Thaikua, S.; Ebina, M.; Kouki, K.; Inafuku, M.; Akamine, H.; Shimoda, K.; Suenaga, K. and Kawamoto, Y. 2015. Preliminary evaluation on digestibility and the relation to morphology and water concentration of Brachiaria spp. and their heritability. Grassland Science 61:92-100. https://doi.org/10.1111/grs.12082 Tilley, J. M. A. and Terry, R. A. 1963. A two-stage technique for the
in vitro digestion of forage crops. Journal of the British Grassland
Society 18:104-111. https://doi.org/10.1111/j.1365-2494.1963.tb00335.x Valério, J. R. 2006. Considerações sobre a morte de pastagens de
Brachiaria brizantha cv. Marandu em alguns Estados do Centro
e Norte do país – Enfoque entomológico. p.135-150. In: Morte de pastos de braquiárias. Barbosa, R., ed. Embrapa Gado de Corte, Campo Grande, MS.
Valério, J. R. 2009. Cigarrinhas-das-pastagens. Série Documentos Nº 179. Embrapa Gado de Corte, Campo Grande, MS. Available at: <http://www.cnpgc.embrapa.br/publicacoes/doc/DOC179.pdf>.
Accessed on: Dec. 05, 2017.
Valério, J. R. and Koller, W. W. 1993. Proposição para o manejo integrado das cigarrinhas-das-pastagens. Pasturas Tropicales 15:10-16. Valério, J. R. and Nakano, O. 1988. Danos causados pelo adulto da
cigarrinha Zulia entreriana na produção e qualidade de Brachiaria decumbens. Pesquisa Agropecuária Brasileira 23:447-453.
Valério, J. R.; Torres, F. Z. V.; Silva, L. C.; Rôdas, P. L. and Oliveira,
M. C. M. 2011. Selecting Brachiaria hybrids for resistance to
the pasture Spittlebug Notozulia entreriana (Berg) (Hemiptera:
Cercopidae). p.121-123. In: Proceedings of the International
Symposium on Forage Breeding, 3. Breeding forage for climate
change adaptation and mitigation - eco-efficient animal production.
Bonito, MS.
Valério, J. R.; Torres, F. Z. V.; Silva, L. C.; Rôdas, P. L.; Araújo Neto, A. and Oliveira, M. C. M. 2012. Evaluating and screening hybrids of
the genus Brachiaria as to resistance to the spittlebug Mahanarva
sp. (Hemiptera: Cercopidae). In: Anais da 49a Reunião Annual
da Sociedade Brasileira de Zootecnia. Available at: <http://www. sbz.org.br/visualizar.php?idiom=pt&artigo=20977>. Accessed on: Dec. 05, 2017.
Valle, C. B.; Jank, L. and Resende, R. M. S. 2009. O melhoramento de forrageiras tropicais no Brasil. Revista Ceres 56:460-472.
Van Soest, P. J. 1994. Nutritional ecology of the ruminant. 2nd ed.
Cornell University Press, 476p.