ISPRS Int. J. Geo-Inf. 2020, 9, 308; doi:10.3390/ijgi9050308 www.mdpi.com/journal/ijgi Article
Assessing Equity in the Accessibility to Urban Green
Spaces According to Different Functional Levels
Edorta Iraegui, Gabriela Augusto and Pedro Cabral *
NOVA Information Management School (NOVA IMS), Universidade Nova de Lisboa, 1070-312 Lisboa, Portugal; [email protected] (E.I.); [email protected] (G.A.)
* Correspondence: [email protected]; Tel.: +351213828610
Received: 29 March 2020; Accepted: 4 May 2020; Published: 7 May 2020
Abstract: Accessibility of urban residents to different services and amenities is a growing concern for policy makers. Urban green spaces (UGS) provide services and benefits that are particularly important for people having less mobility, such as children, the elderly or the poor. Practical experience has led to the classification of UGS in hierarchic systems reflecting the type and degree of benefits and services or functions they provide to users, which vary, primarily with their size. It is therefore necessary to ensure equity in the spatial distribution of different classes of UGS in the urban areas. In this work, we explore a methodology based in geographical information systems (GIS) to assess equity of access by different population groups to UGS according to its functional levels in the City of Barcelona, Spain, using a spatial clustering method. Results did not support the existence of overall inequalities in the access to UGS by the different groups of the population. However, indicators of spatial association revealed insufficiencies concerning accessibility to nearby UGS by seniors, children and the less wealthy in some parts of the city. This methodology may be used to inform urban planners dealing with the provision of UGS in an equitable manner to different socioeconomic groups of the resident population.
Keywords: social equity; geographical information systems; local indicators of spatial association; network analysis; Barcelona
1. Introduction
Urban green spaces (UGS), such as parks, urban forests, public gardens or tree lined squares, are known to promote mental and physical health of urban residents [1,2]. The vicinity of UGS can benefit from an improvement of air quality [3] and some alleviation of the urban heat island effect [4]. Parks, gardens and squares are also important places to facilitate social interaction and cohesion [5,6].
UGS are green spaces in urban areas comprising a variety of vegetated spaces, both natural and semi-natural, from green balconies to urban forests [7]. Therefore, it is difficult to find a common definition for UGS [8]. Broadly, ecologists, economists, social scientists and planners, agree that UGS refers to open spaces in urban areas, primarily covered by vegetation, which are directly (e.g., active or passive recreation) or indirectly (e.g., positive influence on the urban environment) available for the users [9]. In order to provide the urban residents with its benefits, UGS must be available and accessible, particularly those offering possibilities of recreation, which are the main concern of this study.
The availability of UGS is commonly assessed by green space ratio which consists of calculating the amount of UGS within a city or neighborhood per capita [10]. This indicator has a serious limitation when applied to districts or neighborhoods which is the modifiable areal unit problem (MAUP) [11,12], i.e., the measures taken are directly dependent of the spatial scale of the unit of analysis. In fact, despite absence of UGS in any given neighborhood another UGS may eventually be found just across the street, in the next administrative area. Still, this indicator offers some
information when applied to the whole city. Therefore, the World Health Organization recommends the availability of a minimum of 9 m2 of green space per individual, with an ideal UGS value of 50
m2 per capita [10]. UGS size is often considered to estimate the availability of UGS by determining its
capability to host adult physical activity [13], allowing for increased biodiversity, traffic noise barrier and offering a nature like environment to users [14], with significant benefits on health and wellbeing of the users [1]. On the other hand, small UGS scattered across the city may also increase the provision of UGS near everyone’s home [15] and, therefore, increasing social equity in the access to UGS.
Accessibility to UGS refers to the proximity of the UGS to potential users which is considered to have important effects in the health of urban residents [16,17]. However, it has also been demonstrated that nearby smaller UGS tend to be much more frequented by users, than larger UGS further way [18]. Proximity or walking distance is the most important predictor of UGS use [9]. Several methodologies have been developed to measure accessibility in urban settings, such as the container approach or the travel-cost method [19]. Network approaches have been proven to produce better estimations of the proximity of public utilities [11,12,20,21]. More recent studies have included different modes of transportation through the use of two-step floating catchment area to better estimate the areas and populations served by a particular utility, such as an UGS [22].
UGS functionalities are closely interrelated with the availability and accessibility [9]. A minimum UGS size may be necessary to support adult physical activity [14], but in compact cities a small garden is invaluable for the elderly seniors, if located in walking distance from their homes, promoting everyday mobility and sociability [23]. It must be noted that UGS of different sizes do not substitute each other, as the nearby small residential green area can be used for recreation by the toddler and their grandparents (e.g., the neighborhood park equipped with a small playground will host the child adventures a few times a week), whereas the teen will autonomously go to the quarter park to meet friends. All of them are likely to enjoy a weekend picnic in the city park where their parents go for a run twice a week. Thus, urban people need to have accessible UGS, at different functional levels [9,24,25].
Social equity refers to the fairness and equality in the access to different urban and ecosystem services by people with different needs, and equity in the accessibility to UGS has been studied by several researchers across the world to examine whether the less favored groups of the population have as much access to UGS as their more privileged neighbors [26–28]. Achieving social equity and the development of policies to mitigate inequality in the access to urban and ecosystem services are common themes of study in urban geography and planning [21,29]. It is believed that the difference of accessibility to different services and activities has a measurable effect in the economic and social opportunities of the urban residents [21,30]. Thus, the concern of the academic community and policy makers with the equity in the accessibility of UGS is justified [21]. This concern has also been extended to regulatory bodies, such as the European Environmental Agency (EEA) that recommends that every urban resident should have a green space within 15 min walking distance from their residence [31], which corresponds to a distance of about 1600 m. However, considering that 400 m is the limit that most people are willing to walk [32], cities around Europe have been aiming for more ambitious targets, as in Berlin where every resident should have 0.5 ha of UGS within 500 m of their residence [33].
Several researchers have studied UGS equity of accessibility in different cities throughout the world [21,25,34]. Comber, Brundson, & Green (2008) analyzed the UGS accessibility for different religious and ethnic groups using a network analysis in a geographical information system (GIS) for an English city. Gupta et al. (2016) used GIS network analysis to assess the accessibility of UGS using different hierarchical levels in East Delhi, India. Xiao et al. (2017) employed a spatial clustering method to evaluate the association between the spatial patterns of accessibility to urban parks among different social groups. However, we found no study combining the accessibility to different categories of UGS by different social groups with spatial clustering methods. This study aims at filling this gap using Barcelona as a case study.
In this study, we combine the use of GIS network-based analysis to study the accessibility of categories of UGS [25] by different social groups with the use of spatial clustering methods [21]. The
focus of the analysis will be on social groups that may derive more benefits from the frequent attendance of UGS, such as the seniors and the children and those residing in the less wealthy neighborhoods of the city. The UGS functional classification is based on the UGS size. Specifically, we propose to answer the following questions:
a) Are UGS in Barcelona equitably distributed to serve the children, the seniors and the less wealthy?
b) Where in the city would an increase in UGS better improve equity of accessibility for children, the seniors and the less wealthy?
Results may provide useful insights for the planning of UGS in an equitable manner. 2. Methods
2.1. Assessing Equity in the Access to UGS According to Different Functional Levels
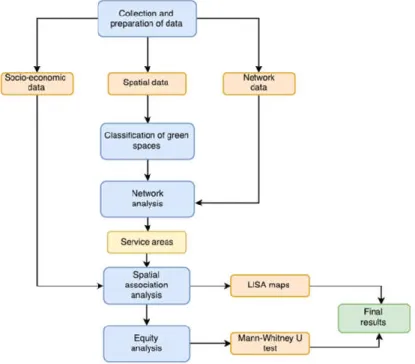
The methods used in this research involved 3 steps (Figure 1). In step 1, we started by establishing the accessible areas for each UGS according to its category through network-based service areas. Then, in step 2, we examined the spatial correlation between these areas and the socioeconomic variables of the neighborhoods, conducting tests searching for local indicators of spatial autocorrelation (LISA). Finally, in step 3, we looked for statistical correlation between accessibility and each of the variables by conducting the Mann–Whitney U test. This last step determined if there was statistical evidence for correlation between the spatial distribution of each variable and the accessibility to UGS. These steps are explained in detail in the following subsections.
Figure 1. Flowchart detailing the methodology.
2.2. Classification of UGS
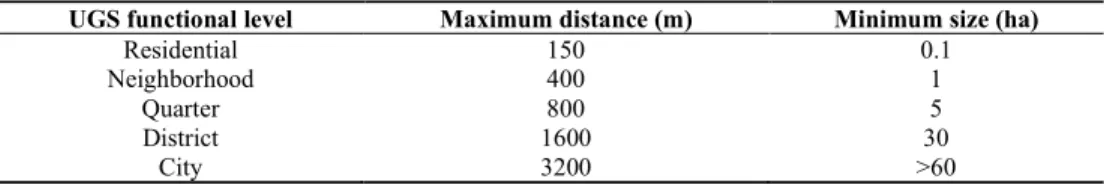
UGS aim to respond to populations expectations while considering constraints due to the nature of the urban fabric of the city itself. That is why cities and city districts developed, based on practical experience and surveys, various hierarchic systems to classify their UGS according to their function [9,14,35]. Based on the minimum standards for UGS proposed by Van Herzele & Wiedemann (2003), we propose 5 hierarchical categories according to their functional level, maximum walking distance and minimum size for UGS (Table 1).
Table 1. Hierarchical classification of urban green spaces (UGS).
UGS functional level Maximum distance (m) Minimum size (ha)
Residential 150 0.1
Neighborhood 400 1
Quarter 800 5
District 1600 30
City 3200 >60
For residential UGS we considered 1000 m2 the minimum area to allow some recreation for users
not motivated for physical activity, like the seniors, the toddlers and young children. Neighborhood UGS would be located within walking distance of residents, with a minimum size to provide some amenities to users, like a small playground or a terrace. Quarter UGS include parks that have size enough to host active recreation for young people and adults. District parks, with over 30 ha, are already outside the walking distance [32] for many potential users (as the city UGS are), however the aesthetic and nature-like environment that can be offered by UGS of such dimensions may well offset the discomfort of taking a public transportation or driving there occasionally. This classification comprehends all open parks and public gardens as well as plazas located within the municipality. Urban forests and green areas smaller than 0.1 ha, linear green spaces (closed gardens across avenues or streets) and green areas of limited or impossible access (private gardens, green spaces between motorways and roundabouts) were excluded from the analysis. The values suggested here were formulated for the specific case-study being addressed in Section 3 and can be changed/adapted for different cities.
2.3. Measuring Accessibility to UGS Through Service Areas
To determine access to UGS for each of the functional levels described earlier we implemented the covering model of accessibility [36] with the changes described by Nicholls (2001) which considers various entry points for each UGS as starting points of the service areas. The model asserts that areas within the city have a suitable access to a park if they are located within the service area of that park. A service area includes all streets that are accessible from any given point in space considering parameters, such as distance or time, as well as any physical barriers or limitations that may exist and that could limit the accessibility [37]. The starting point whence each service area originates is called a “facility” by the ESRI network analyst tool [38]. The facilities were placed on the “access points” which can be the intersections of incoming streets and the park boundary, minimizing the service area underestimation problem [20]. Each green space includes a series of entry points which generate different, independent service areas; each service area covers the area that is the most accessible to that access point. Following this method, service areas were generated for each UGS for each functional level.
2.4. Spatial Association and Equity Analyses
The local indicators of spatial autocorrelation (LISA) as described by Anselin (1995) and following the works of Talen (1997) and Xiao et al. (2017) were used to identify spatial clusters of features with high and low values [39,40]. A test can be used to determine the existence of statistically significant spatial clusters of single and/or bivariate variables [21,41]. The Local Moran I statistic (Ii)
is defined as follows (1):
=
∑
(1)where zi and zj are expressed in deviations from the mean and Wij is the spatial weight [21].
The free open source software GeoDa [42] was used to conduct this test. Since we wanted to find spatial correlations between two variables; accessibility to UGS by category on one side and a socio-economic variable (for example, income) on the other; the bivariate Local Moran I test was the selected option. The Mann–Whitney U statistical test (also referred to as the Wilcoxon test) was
applied to assess if there were statistically significant differences in the socioeconomic variables in the areas deemed as “high access” and those that are “low access” for each green space category (Nicholls, 2001; Talen, 1997; Xiao et al., 2017). This is a nonparametric test as it does not assume normality. The formula of Mann–Whitney U is as follows (2):
=
+
(
+ 1)
2
−
(2)where n1 and n2 refer to the sample size of each group, and Ri is the rank of the sample.
In this test the null hypothesis (p-value > 0.05) is that there is not any statistical difference between the two populations (that could be identical), whereas the alternative hypothesis (p-value < 0.05) establishes that there are statistical differences between the populations. In the context of this research, a rejection of the null hypothesis means that socioeconomic variables are relevant for the distribution of high and low accessibility to UGS. Otherwise, we conclude that such relation cannot be proven to exist. The combined results of these two methodologies will determine whether or not accessibility favors groups with particular socioeconomic characteristics over others (Talen, 1997). 3. Case study: City of Barcelona (Spain)
3.1. Study Area
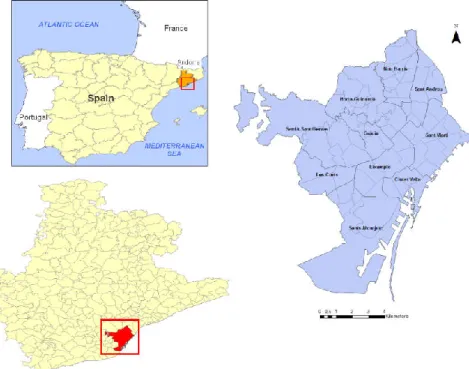
The City of Barcelona is the second largest city of Spain, and the capital and most populated city of the autonomous community of Catalonia. Geographically, it is located by the Mediterranean Sea in the eastern coast of the Iberian Peninsula (Figure 2) on a plain, limited by the mountain range of Collserola the Llobregat river to the southwest and the Besòs river to the north. The city as a Mediterranean climate with hot summers and mild winters. There are only 57 days of rain per year and the total of sun hours is about 2500 per year (http://www.aemet.es). The city UGS are in high demand by its inhabitants and the millions of tourists that visit the city each year.
The Barcelona metropolitan area extends over the limits of the city with a population of around 4.7 million people in the total urban area and over 5 million in the total metropolitan area [43]. This research focuses on the administrative unit that refers to the city itself, which consists of the municipality of Barcelona. The city has about 1.6 million habitants [44] living in 10 districts, subdivided in 73 neighborhoods. Barcelona population has been growing less than 0.05% every year since 2010, but the senior population (over 64) has been increasing ten times as much in the same period, with nearly 200,000 inhabitants reaching seniority each year and accounting for over 21% of the local population. Children younger than 14 account for about 9% of the city residents.
Barcelona is a densely populated city by European standards, with nearly 16,000 habitants per km2 [44]. Population density varies importantly across the city neighborhoods as some
neighborhoods include sparsely populated areas well encroached in the surrounding national parks whereas the city center neighborhoods houses nearly 58,000 habitants for square kilometer [44]. The average income of families across neighborhoods varies between 35% and 250% of the city global average, and in 75% of the neighborhoods the average income per family is below 102% of the city average [44].
Figure 2. The study area.
3.2. Data
Vector data representing the city limits at municipal and neighborhood level were obtained from regional and local geoportals [45,46] in ESRI [38] shapefile format. Shapefiles containing the streets and the green areas of the city of Barcelona were extracted from open street map (OSM) [47] using Mapzen [48] online tool. The MapZen service ‘Metro Extracts’ allowed to extract some files and convert them into ArcGIS shapefile format. Using the ArcGIS Editor for OSM extension, the data were treated and converted into workable features, the network dataset was also built using this tool. In what refers to the urban green spaces, the Mapzen tool allowed the production of custom extractions based on predefined combinations of OSM tags. There was an existing ‘green space’ extraction which included all green areas; it included not only public parks, gardens and plazas, but also any small patch of grass that may exist in traffic islands or as part of road interchanges. This resulting dataset had to be manually compared with the one provided by the geoportal of the City of Barcelona, which was more limited in nature, as it only contained large city parks and plazas. The final dataset was a result of manually filtering the OSM extracted data, often using aerial photography to determine the nature of the ‘green area’ and discard those that were either not accessible to the public (traffic islands, hillsides, private properties) or that, while being green areas, were not meant to be used as such (vacant lots). Public squares and plazas coming from the municipal dataset were included.
The socioeconomic variables used to access equity in the access to UGS refer to neighborhood-level for year 2014, and were obtained from the city hall and regional government websites [49] (Table 2).
Table 2. Socioeconomic data used in the study.
Data Units
Demographic variables
Population density Inhabitants / km2
Population under 15 Percentage of the total population
Population over 60 Percentage of the total population
Socioeconomic characteristics
Income Income by family unit; city average (%) = 100
Income is seen as one of the main social and economic indicators that can be used to explain inequity [50]. The higher population density is, the more important the existence of UGS as the overcrowding of UGS in these areas can affect the quality of the users experience [51,52]. Benefits from proximity of UGS for seniors and children are well documented [23,53–55] and, therefore, the equity of their accessibility must be ensured.
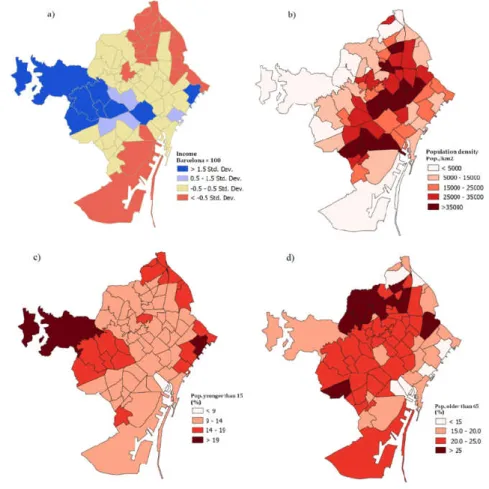
3.3. Assessment of the Equity in the Access to UGS in Barcelona According to Different Functional Levels Figure 3 displays the mapped spatial distribution of the socioeconomic variables. The spatial distribution of income (Figure 3, map top left) shows the neighborhoods below and above the city average using standard deviations. The higher than average income neighborhoods are clustered in the westernmost districts, particularly Les-Corts and Sarrià–Saint Gervasi, whereas the northern, eastern and southern areas of the city seem to concentrate lower than average income neighborhoods. Barcelona is a densely populated city (Figure 3, map in top right), the highest population density areas are concentrated along a corridor in the central Eixample District. The southernmost area of the city is mostly dedicated to the support of the maritime port of Barcelona, therefore very sparsely populated. The neighborhoods having the highest proportion of children (Figure 3, map bottom left) are not the ones where senior population resides (Figure 3, map bottom right).
Figure 3. Spatial distribution of selected socioeconomic variables in Barcelona (2014). (a) Income, (b)
population density (people/km2), (c) population younger than 15 years (5) and (d) population older
than 65 years (5).
It is clear in Figure 4 that UGS are absent in large areas adjacent of the NW and W city administrative borders, it should be noted that those areas are covered by the large Natural Park
Serra de Corserola, very much a green space, but hardly urban. In the south of the city, the Saint Montjuic District south of the city park, UGS are scarce as shown in the map.
Figure 4. Urban green space (UGS) in Barcelona by functional level: residential, neighborhood,
quarter, district and city (see Table 1 for the characteristics of each functional level).
According to our estimations, the city of Barcelona has less about 8% of its area occupied by UGS, which corresponds to 5.13 m2 of UGS per resident, still below the minimum target pointed by
WHO, and only about 10% of the optimum value for this indicator. This value also points to the likeliness of UGS overcrowding which is likely to deteriorate the UGS user experience limiting the UGS attendance [51]. Only 11 neighborhoods in Barcelona have more than 9 m2 of UGS per resident,
and half the neighborhoods offer less than 2.4 m2 of UGS per resident.
To establish which neighborhoods, have high and low accessibility to UGS types, we estimated the percentage of the area covered by the UGS service areas (Figure 5). This estimation was carried out separately for the different UGS categories. The relative coverages were then ordered in quartiles, with the 1st quartile setting the upper threshold of “low accessibility” and the 3rd quartile setting the
Figure 5. Box & Whisker plot of urban green spaces (UGS) services areas overlapping the
neighborhood. Below the box the% of neighborhood covered in low accessibility, above the box the neighborhoods with High Accessibility, the middle trait indicates the median coverage, if is not there more than half of the neighborhoods have no area served by that UGS class.
As depicted in Figure 5, residential UGS are the UGS type most spread across the city; any neighborhood having more than 15% of its area within 150 m of a residential UGS will not be considered to have a low accessibility to residential UGS. Neighborhood UGS have very similar results (median 28.1% and third quartile 50.8%). Not surprisingly, the larger the UGS are, the more skewed their distributions are too. A neighborhood must have more than 63.9% of its area within a service area of a quarter UGS to be considered as having high accessibility despite the median value of the distribution being only 17.3%. For the district and city UGS, the median is 0%, meaning that more than half of the neighborhoods have no overlapping service areas for these UGS categories.
Figure 6 displays in maps the level of accessibility of neighborhoods to different UGS functional categories across the city. It should be noted that all neighborhoods in pink or red in the two top maps—residential and neighborhood UGS—are insufficiently served by UGS in walking distance, meaning in this case that less than 15% of their area is located within 150 m of a tiny residential UGS and less than 8% of their area is within 400 m of small neighborhood UGS.
Figure 6. Level of accessibility by neighborhood to different functional categories of urban green
spaces (UGS). (a) residential parks, (b) neighborhood parks, (c) quarter parks, (d) district parks, and (e) city parks.
Quarter UGS are more evenly distributed across the city, except for the southernmost part of the city that is an area serving the Barcelona Harbor. According to our classification, Barcelona disposes of only two district UGS very close to each other which explains the strong asymmetry in their accessibility. The same explains the extreme asymmetry in the accessibility of the only city park located in the south of the city.
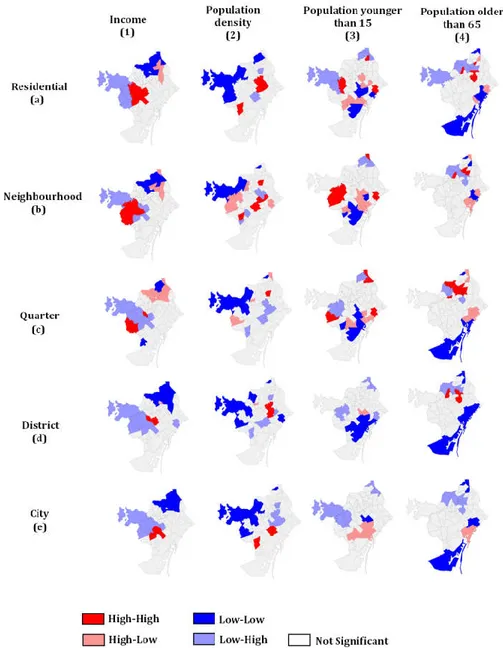
Figure 7 displays LISA maps for each socioeconomic variable (columns) and each one of the UGS categories (rows). Therefore, the first column displays significant co-occurrence of the high/low income and high/low accessibility to different categories of UGS. The neighborhoods shown in dark red (high–high) represent high accessibility and a high value of the socioeconomic variable, whereas those shown in light red (high–low) represent high accessibility, but a low value of the socioeconomic variable. In addition, areas shown in dark blue (low–low) represent a low accessibility and a low value of the socioeconomic variable, while light blue (low–high) represent a low accessibility, but a high value of the socioeconomic variable. Only neighborhoods that are statistically significant are colored.
With the exception of the maps of the first column referring to income, the light blue colored neighborhoods are the ones that should catch our attention, as these are showing the co-occurrence of high values of the variable—seniors, children and population density, where accessibility to UGS functional category is low. For maps referring to income, we are more concerned with dark blue neighborhoods, where low income co-occurs with low accessibility.
The dominant blue of Horta Guinardó and Sárria–Sant Gervasi, NW and W of the maps indicate low accessibility to UGS and must be interpreted considering that those districts have large non-urban areas. Quarter UGS accessibility is low for the dense neighborhoods of the city center, the same areas are well covered by residential and neighborhood parks, but they may be crowded. For the children living in the neighborhoods bordering Sarrià–Sant Gervasi and les Corts, only the neighborhood UGS is accessible. Seniors and children residing in the north of Nou Barri may complain of the lack of residential and neighborhood parks. The good accessibility of the quarter UGS (800 m walking) may not compensate for that insufficiency. The old neighborhoods of the city center have a good accessibility to residential or neighborhood parks or both, but considering their population density these UGS may be overcrowded.
Figure 7. Significant local indicators of spatial autocorrelation (LISA) values of urban green spaces
(UGS) accessibility by functional category, when correlated to the presence of the socioeconomic variable. Pink and red point to good accessibility whereas blue shows low accessibility.
Table 3 shows the results of the Mann–Whitney U test, together with the median values for the “high access” and “low access” neighborhoods for each one of the variables as well as for each one of the UGS categories. Results in Table 3 indicate that for the smaller UGS the only significant inequality of accessibility relates with the population density, as the more populated neighborhoods tend to have better coverage of residential green spaces. Neighborhood and quarter UGS show no inequalities in their accessibility for the targeted variables.
The Mann–Whitney U test detects significant inequalities in the accessibility of district UGS, but these inequalities seem to favor neighborhoods with higher proportion of seniors (median 22.9%) versus neighborhoods with low accessibility (median 19.85%). Children are unequally served by the city UGS, as neighborhoods with more children (median 13.7%) have less accessibility to the city UGS, than the ones served by the city UGS that have a median proportion of children of 11.7%. Neighborhoods having higher incomes have more accessibility to city UGS. However, these inequalities are most likely caused by the limited number of UGS on this category for the whole
municipality: two UGS for the district category (the two adjacent to each other) and located in the northern half of the city and one single UGS located in the south.
Table 3. Mann–Whitney U analysis of urban green spaces (UGS) access equity.
UGS type Variable High access (median)
Low access
(median) Mann-Whitney U p-value* Equity
Residential Income 85.8 77.4 119 0.07472 Yes
Pop. Density 34,791.4 11,577.9921 89 0.006829 No
Younger than 15 12.6 12.7 190.5 0.7811 Yes
Older than 60 22.6 21.9 176.5 0.9186 Yes
Neighborhood Income 76.8 72.7 151.5 0.4054 Yes
Pop. Density 29,252.0817 19,202.6205 137 0.212 Yes
Younger than 15 13 14.1 233 0.2199 Yes
Older than 60 22.3 20.1 148 0.3499 Yes
Quarter Income 76.8 79.6 171 0.7951 Yes
Pop. Density 29,252.0817 25,839.6708 190 0.7951 Yes
Younger than 15 13.8 13.1 174.5 0.8723 Yes
Older than 60 21.2 20.6 166 0.6826 Yes
District Income 83.3 77.2 348 0.4316 Yes
Pop. Density 34,595.1836 20,741.8405 234 0.009549 No
Younger than 15 13.1 13.35 456.4 0.3744 Yes
Older than 60 22.9 19.85 202.5 0.002263 No
City Income 97.8 75.75 233 0.001968 No
Pop. Density 32,856.2615 23,775.7842 351 0.1471 Yes
Younger than 15 11.9 13.7 729.5 1.45E-04 No
Older than 60 21.3 22.5 580.5 0.08445 Yes
* Null hypothesis: p-value > 0.05. Alternative hypothesis: p-value < 0.05.
4. Discussion
UGS accessibility is particularly important for South European cities, such as Barcelona, where the aging demographics and climate conditions emphasize the importance of provisioning UGS for the local population. In fact, traditionally the small public gardens and tree lined squares in cities of Southern Europe are of major social importance for the senior population who use these places to develop several leisure and social activities. Children, who often depend on related adults for mobility, also tend to primarily visit green spaces closer to their homes [9,55]. However, only about 25% of the city is covered by the service areas of each nearby UGS (residential, neighborhood and quarter), therefore justifying all efforts made to increase the provision of residential and neighborhood green spaces.
This research used spatial clustering methods to study the relationship between selected socioeconomic variables and the accessibility to UGS of different functional levels in the city of Barcelona. The Mann–Whitney U test did not distinguish statistically significant inequalities in the overall access of different groups to UGS. However, the spatial association LISA maps show clear evidence of insufficient accessibility to different categories of UGS by different social groups in some neighborhoods demonstrating the advantages of using spatial cluster analysis for this type of study. The methodology tried to capture as accurately as possible the convenience of residents to reach and use UGS, particularly, in defining UGS service areas by walking distances possible even for frail people. However, mobility within cities is a complex factor that requires taking many elements into consideration, some of which, such as path safety and security, location of other services and facilities, public transportation or parking lots are beyond the scope of this research. It is also understood that the choice of visiting one park or another is not necessarily linked exclusively to distance or size (to note that size is not the only parameter that should be considered in the functional classification of UGS, and often each city classifies their own UGS according to its own classification system), but also to other factors, such as quality and conditions of use which includes circumstances that were not
taken into consideration in this research, such as park cleanliness, safety, proximity to other service centers (schools, healthcare), perceived distance (e.g., 400 m with a narrow sidewalk and large car traffic can be perceived as a longer walk than 800 m in a walkable environment), among others [9,41]. We hope to implement these other variables in future work on the topic which may also include fuzzy analysis to deal with park sizes and their functional classification.
The combination of UGS hierarchical levels [25] with the use of spatial clustering methods [21] to study equity in the access to UGS enabled to distinguish existing inequalities in the access to different categories of UGS by targeted social groups, therefore providing local administration with relevant information, even in cities where there are no important heterogeneities in the spatial distribution of the population. However, this methodology cannot help with the crowding of Barcelona UGS, which is likely to be the main challenge of the municipal authorities in the city. This work considered only the publicly owned open green spaces in the city which may underestimate the availability of UGS for residents and tourists.
This methodology presupposes that UGS functional levels are not interchangeable, meaning that the presence of smaller UGS near one’s doorstep cannot be fully compensated by a larger UGS in the same place as smaller UGS are more likely to be used by nearby residents in their daily routines, whereas larger UGS are more likely to attract users from other locations and with, sometimes, conflicting purposes. Moreover, it is well established that gentrification often results in the creation or restoration of UGS, displacing less favored population from the neighborhood [56]. From a planner perspective in the compact cities of the Mediterranean basin, to provide as much as possible small UGS anywhere possible in the city, may be an important strategy to promote equity and counter territory and social imbalances. It is also easier to find 1000 sqm, than 10,000 sqm to green in compact cities like Barcelona.
5. Conclusions
This study proposes a methodology to access equity in the accessibility to different functional classes of UGS, by users of different needs and conditions in Barcelona. The methodology of UGS hierarchical levels [25] with the use of spatial clustering methods [21] to study equity in the access to UGS enabled to distinguish existing inequalities in the access to different categories of UGS by targeted social groups, therefore providing local administration with relevant information, even in cities where there are no important heterogeneities in the spatial distribution of the population. Results indicate that UGS of all functional levels are insufficient and unequally distributed for targeted social groups across the city. The methodology proposed in this study may be of use to help local authorities to detect inequality in the accessibility to different UGS functional levels, by targeted social groups in different cities, with the appropriate local parameters as UGS categories including variables other than size and targeted social groups. Accessibility can also be weighted with factors other than distance, as walkability, safety, traffic pollution levels, climatic comfort and security. As for all other methodologies, models and scenarios, the results here presented can only be validated by participatory policies, to include opinions and concerns of residents and local stakeholders.
Author Contributions: E.I. and P.C. conceived the study. E.I. conducted data acquisition and calculations. E.I., P.C. and G.A. wrote the paper. P.C. revised the paper. All authors contributed critically to the drafts and gave final approval for publication. All authors have read and agreed to the published version of the manuscript.
Funding: APC were covered by the authors’ organization
Acknowledgments: The work was supported by the European Commission, Erasmus Mundus Programme,
M.Sc. in Geospatial Technologies. We would like also to thank the reviewers for their constructive remarks which helped to improve the study.
References
1. Shanahan, D.F.; Bush, R.; Gaston, K.J.; Lin, B.B.; Dean, J.; Barber, E.; Fuller, R.A. Health Benefits from Nature Experiences Depend on Dose. Sci. Rep. 2016, 6, 28551.
2. Kondo, M.; Fluehr, J.; McKeon, T.; Branas, C. Urban Green Space and Its Impact on Human Health. Int. J. Environ. Res. Public Health 2018, 15, 445.
3. Janhäll, S. Review on urban vegetation and particle air pollution—Deposition and dispersion. Atmos. Environ. 2015, 105, 130–137.
4. Bowler, D.E.; Buyung-Ali, L.; Knight, T.M.; Pullin, A.S. Urban greening to cool towns and cities: A systematic review of the empirical evidence. Landsc. Urban Plan. 2010, 97, 147–155.
5. Arnberger, A.; Eder, R. The influence of green space on community attachment of urban and suburban residents. Urban For. Urban Green. 2012, 11, 41–49.
6. Kaźmierczak, A. The contribution of local parks to neighbourhood social ties. Landsc. Urban Plan. 2013, 109, 31–44.
7. Green Cities of Europe; Beatley, T., Ed.; Island Press/Center for Resource Economics: Washington, DC, USA, 2012; ISBN 978-1-59726-220-0.
8. Taylor, L.; Hochuli, D.F. Defining greenspace: Multiple uses across multiple disciplines. Landsc. Urban Plan.
2017, 158, 25–38.
9. Van Herzele, A.; Wiedemann, T. A monitoring tool for the provision of accessible and attractive urban green spaces. Landsc. Urban Plan. 2003, 63, 109–126.
10. Russo, A.; Cirella, G. Modern Compact Cities: How Much Greenery Do We Need? Int. J. Environ. Res. Public Health 2018, 15, 2180.
11. Zhang, X.; Lu, H.; Holt, J.B. Modeling spatial accessibility to parks: A national study. Int. J. Health Geogr.
2011, 10, 31.
12. Fotheringham, A.S.; Wong, D.W.S. The Modifiable Areal Unit Problem in Multivariate Statistical Analysis. Environ. Plan. A 1991, 23, 1025–1044.
13. Coombes, E.; Jones, A.P.; Hillsdon, M. The relationship of physical activity and overweight to objectively measured green space accessibility and use. Soc. Sci. Med. 2010, 70, 816–822.
14. Ibes, D.C. A multi-dimensional classification and equity analysis of an urban park system: A novel methodology and case study application. Landsc. Urban Plan. 2015, 137, 122–137.
15. Caruso, G.; Cavailhès, J.; Peeters, D.; Thomas, I.; Frankhauser, P.; Vuidel, G. Greener and larger neighbourhoods make cities more sustainable! A 2D urban economics perspective. Comput. Environ. Urban Syst. 2015, 54, 82–94.
16. Burkart, K.; Meier, F.; Schneider, A.; Breitner, S.; Canário, P.; Alcoforado, M.J.; Scherer, D.; Endlicher, W. Modification of Heat-Related Mortality in an Elderly Urban Population by Vegetation (Urban Green) and Proximity to Water (Urban Blue): Evidence from Lisbon, Portugal. Environ. Health Perspect. 2016, 124, 927– 34.
17. Zardo, L.; Geneletti, D.; Pérez-Soba, M.; Van Eupen, M. Estimating the cooling capacity of green infrastructures to support urban planning. Ecosyst. Serv. 2017, 26, 225–235.
18. Goméz, A.; Costa, C.; Santana, P. Acessibilidade e utilização dos espaços verdes urbanos nas cidades de Coimbra (Portugal) e Salamanca (Espanha). Finisterra 2014, 49, 49, doi:10.18055/finis4207.
19. Talen, E.; Anselin, L. Assessing spatial equity: An evaluation of measures of accessibility to public playgrounds. Environ. Plan. A 1998, 30, 595–613.
20. Nicholls, S. Measuring the accessibility and equity of public parks: A case study using GIS. Manag. Leis.
2001, 6, 201–219.
21. Xiao, Y.; Wang, Z.; Li, Z.; Tang, Z. An assessment of urban park access in Shanghai—Implications for the social equity in urban China. Landsc. Urban Plan. 2017, 157, 383–393.
22. Dony, C.C.; Delmelle, E.M.; Delmelle, E.C. Re-conceptualizing accessibility to parks in multi-modal cities: A Variable-width Floating Catchment Area (VFCA) method. Landsc. Urban Plan. 2015, 143, 90–99. 23. Tilley, S.; Neale, C.; Patuano, A.; Cinderby, S. Older People’s Experiences of Mobility and Mood in an Urban
Environment: A Mixed Methods Approach Using Electroencephalography (EEG) and Interviews. Int. J. Environ. Res. Public Health 2017, 14, 151.
24. Dunnett, N.; Swannnick, C.; Woolley, H. Improving Urban Parks, Play Areas and Green Spaces; Department for Transport, Local Government and the Regions, London, UK, 2002.
hierarchical levels of urban green spaces. Urban For. Urban Green. 2016, 18, 198–211.
26. Rich, R.C. Equality and Urban Policy: The Distribution of Municipal Public Services. Am. Political Sci. Rev.
1978, 72, 1421–1423.
27. Byrne, J.; Wolch, J.; Holt, J.B.; Brooks, J.; McKenzie, T.; Lara, R.; Lurie, N.; Donovan, R.; Catellier, D. Nature, race, and parks: Past research and future directions for geographic research. Prog. Hum. Geogr. 2009, 33, 743–765.
28. Matthew McConnachie, M.; Shackleton, C.M. Public green space inequality in small towns in South Africa. Habitat Int. 2010, 34, 244–248.
29. Wüstemann, H.; Kalisch, D.; Kolbe, J. Access to urban green space and environmental inequalities in Germany. Landsc. Urban Plan. 2017, 164, 124–131.
30. Wang, C.-H.; Chen, N. A GIS-based spatial statistical approach to modeling job accessibility by transportation mode: Case study of Columbus, Ohio. J. Transp. Geogr. 2015, 45, 1–11.
31. Barbosa, O.; Tratalos, J.A.; Armsworth, P.R.; Davies, R.G.; Fuller, R.A.; Johnson, P.; Gaston, K.J. Who benefits from access to green space? A case study from Sheffield, UK. Landsc. Urban Plan. 2007, 83, 187–195. 32. Yang, Y.; Diez-Roux, A.V. Walking Distance by Trip Purpose and Population Subgroups. Am. J. Prev. Med.
2012, 43, 11–19.
33. Cvejić, R.; Eler, K.; Pintar, M.; Železnikar, Š.; Haase, D.; Kabisch, N.; Strohbach, M. A Tipology of Urban Green Spaces, Ecosystem Provisioning Services and Demands; Green Surge project (2013–2017), Copenhagen, Denmark: 2015.
34. Comber, A.; Brunsdon, C.; Green, E. Using a GIS-based network analysis to determine urban greenspace accessibility for different ethnic and religious groups. Landsc. Urban Plan. 2008, 86, 103–114.
35. Li, L.; Du, Q.; Ren, F. Assessing Spatial Accessibility to Hierarchical Urban Parks by Multi-Types of Travel Distance in. Int. J. Environ. Res. Public Health 2019, 16, 1038.
36. Hodgart, R.L. Optimizing Access to Public Services: A Review of Problems, Models and Methods of Locating Central Facilities. Prog. Geogr. 1978, 2, 17–48.
37. ESRI Service Area Analysis. Available online:
https://desktop.arcgis.com/en/arcmap/latest/extensions/network-analyst/service-area.htm (accessed on 15 January 2017).
38. ESRI ArcGIS Desktop. Avaialable online: https://www.esri.com/ (accessed on 1 October 2016) 39. Anselin, L. Local Indicators of Spatial Association-LISA. Geogr. Anal. 1995, 27, 93–115.
40. ESRI How Cluster and Outlier Analysis (Anselin Local Moran’s I) Works. Available online: http://desktop.arcgis.com/en/arcmap/latest/tools/spatial-statistics-toolbox/cluster-and-outlier-analysis-anselin-local-moran-s.htm (accessed on 1 June 2017).
41. Talen, E. The social equity of urban service distribution: An exploration of park access in Pueblo, Colorado, and Macon, Georgia. Urban Geogr. 1997, 18, 521–541.
42. GeoDa GeoDa on GitHub, Version 1.6.7. Available online: http://geodacenter.github.io/index.html (accessed on 20 January 2017).
43. Demographia World Urban Area: 12th Annual Edition. Available online: www.demographia.com/db-worldua.pdf (accessed on 6 January 2017).
44. IDESCAT Official Statistics Website of Catalonia. Available online:
http://www.idescat.cat/emex/?lang=en&id=080193 (accessed on 1 June 2017).
45. ICGC Cartographic and Geologic Institute of Catalonia. Available online: http://www.icgc.cat/ (accessed on 1 October 2016).
46. BCN Geoportal of the City of Barcelona. Available online:
http://www.bcn.cat/geoportal/en/presentacio.html (accessed on 1 October 2016).
47. OSM, OpenStreetMap. Available online: https://www.openstreetmap.org (accessed on 1 October 2016) 48. MapZen MapZen. Available online: https://mapzen.com/ (accessed on 1 October 2016).
49. Departament d’Estadística Department of statistics of the city of Barcelona. Available online: http://www.bcn.cat/estadistica/castella/index.htm (accessed on 12 January 2017).
50. Gerrish, E.; Watkins, S.L. The relationship between urban forests and income: A meta-analysis. Landsc. Urban Plan. 2018, 170, 293–208.
51. Arnberger, A. Urban Densification and Recreational Quality of Public Urban Green Spaces—A Viennese Case Study. Sustainability 2012, 4, 703–720.
ecosystem services? A user-friendly and inclusive tool for improved urban management. Land Use Policy
2017, 68, 574–584.
53. Flouri, E.; Midouhas, E.; Joshi, H. The role of urban neighbourhood green space in children’s emotional and behavioural resilience. J. Environ. Psychol. 2014, 40, 179–186.
54. Jennings, V.; Bamkole, O. The Relationship between Social Cohesion and Urban Green Space: An Avenue for Health Promotion. Int. J. Environ. Res. Public Health 2019, 16, 452.
55. Hillman, M.; Adam, J.; Whitelegg, J. One False Move: A Study of Children’s Independent Mobility; Policy Studies: London, UK, 1990.
56. Anguelovski, I.; Connolly, J.; Brand, A.L. From landscapes of utopia to the margins of the green urban life. City 2018, 22, 417–436.
© 2020 by the authors. Licensee MDPI, Basel, Switzerland. This article is an open access article distributed under the terms and conditions of the Creative Commons Attribution (CC BY) license (http://creativecommons.org/licenses/by/4.0/).