www.nature.com/scientificreports
HDNetDB: A Molecular Interaction
Database for Network-Oriented
Investigations into Huntington’s
Disease
Ravi Kiran Reddy Kalathur
1,6, José Pedro Pinto
1, Biswanath Sahoo
2, Gautam Chaurasia
3&
Matthias E. Futschik
1,4,5Huntington’s disease (HD) is a progressive and fatal neurodegenerative disorder caused by an expanded CAG repeat in the huntingtin gene. Although HD is monogenic, its molecular manifestation appears highly complex and involves multiple cellular processes. The recent application of high throughput platforms such as microarrays and mass-spectrometry has indicated multiple pathogenic routes. The massive data generated by these techniques together with the complexity of the pathogenesis, however, pose considerable challenges to researchers. Network-based methods can provide valuable tools to consolidate newly generated data with existing knowledge, and to decipher the interwoven molecular mechanisms underlying HD. To facilitate research on HD in a network-oriented manner, we have developed HDNetDB, a database that integrates molecular interactions with many HD-relevant datasets. It allows users to obtain, visualize and prioritize molecular interaction networks using HD-relevant gene expression, phenotypic and other types of data obtained from human samples or model organisms. We illustrated several HDNetDB functionalities through a case study and identified proteins that constitute potential cross-talk between HD and the unfolded protein response (UPR). HDNetDB is publicly accessible at http://hdnetdb.sysbiolab.eu.
Huntington’s disease is an inherited neurodegenerative disorder that results from a trinucleotide (CAG) repeat expansion (>35) in the first exon of the huntingtin (HTT, IT15) gene1. Human HTT codes for a large protein
of 3144 amino acids, which is ubiquitously expressed in various tissues and is present in several sub-cellular locations. Studies indicate that both loss of function of normal HTT as well as gain of function of mutant HTT contribute to neuropathological alterations in distinct regions of the brain2, 3. In the initial stages of HD,
degen-eration is detectable mainly in the striatum and cortex, whereas in later stages degendegen-eration is also observed in other brain regions, such as the hypothalamus and hippocampus4, 5. Clinically, the disease is characterized by
complex and variable symptoms that include movement disorders, psychiatric problems and cognitive decline2.
Though HD is caused by mutation of a single gene, the disease development might involve a plethora of genes and processes6. Indeed, large variations in onset, severity and progression of HD suggest the existence of other
influ-ential molecular factors besides the mutation of HTT7–11. In order to identify genes that may modify disease onset
and progression, genome-wide association and gene expression studies have been performed12, 13. Additionally,
a large number of genes and proteins have been catalogued based on different types of experimental evidence6.
Currently, identification of new targets, drugs and therapeutic strategies is at a crucial juncture, which can ulti-mately contribute to a delayed onset or ameliorate progression of HD.
Despite considerable efforts, deciphering the precise pathological mechanisms underlying HD still requires further research. The large number of genes and the diversity of processes involved in the progression of
1SysBioLab, Centre for Biomedical Research (CBMR), University of Algarve, Faro, Portugal. 2TCUBE SOLUTIONS, Bhubaneswar, Odisha, India. 3Institute for Theoretical Biology, Charité, Humboldt-University, Berlin, Germany. 4Centre of Marine Sciences (CCMAR), University of Algarve, Faro, Algarve, Portugal. 5School of Biomedical and Healthcare Sciences, Plymouth University Peninsula Schools of Medicine and Dentistry, Plymouth, Devon, United Kingdom. 6Present address: Department of Biomedicine, University of Basel, Basel, Switzerland. Correspondence and requests for materials should be addressed to R.K.R.K. (email: ravikiranreddy.kalathur@unibas.ch) or M.E.F. (email: matthias.futschik@plymouth.ac.uk)
Received: 13 December 2016 Accepted: 25 May 2017 Published: xx xx xxxx
neurological diseases in general, and HD in specific, emphasizes the need for comprehensive approaches in addi-tional to studies of individual genes14. Integrative network models can provide powerful tools for this. The
mod-els previously been applied to analyze a wide range of human diseases and have rapidly gained popularity15–17.
The use of network-based approaches for examining HD is also motivated by the role of HTT. Several studies indicated that HTT interacts with a diverse array of cellular proteins18–21. These interacting partners play
impor-tant roles in various biological processes such as transcriptional regulation, vesicular transport and apoptosis as well as in signaling pathways such as MAPK, mTOR signaling and NOD-like receptor signaling22, 23. Thus, it
is not surprising that large HTT-focused interaction networks have been derived by independent groups using yeast-two-hybrid (Y2H) screens or affinity purification mass spectrometry (AP-MS)20, 24–26. While being
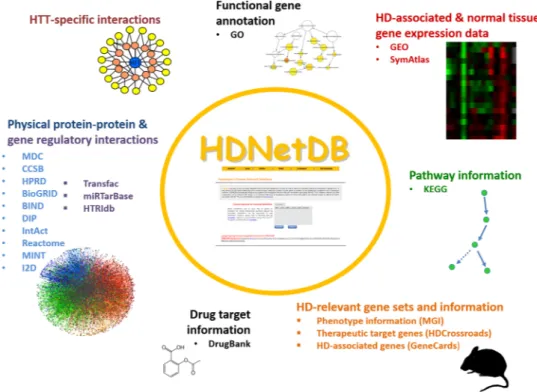
formi-dable approaches, such studies require considerable expertise to assemble and analyze networks, which is a chal-lenging task. In order to assist researchers in their pursuit to understand the disease mechanisms and to identify novel drug targets for HD, we have developed Huntington’s Disease Network DataBase (HDNetDB). It constitutes a versatile platform that integrates several levels of data and information ranging from protein-protein interac-tions, regulatory interactions (microRNA-target gene and transcription factor-target gene), and gene expression to drug-target information about gene, gene ontology and pathway information to phenotype data pertaining to HD (Fig. 1). Besides being a central resource for integrated data and information, HDNetDB also equips users with several querying and visualization options for HD-related networks. HDNetDB is freely accessible at http:// hdnetdb.sysbiolab.eu and requires no login. To illustrate the potential of HDNetDB for network-oriented inves-tigations, we describe an exemplary case study focusing on the unfolded protein response (UPR) in the context of HD.
Results
Case study: a potential connection between unfolded protein response (UPR) and Huntington’s
disease.
To illustrate the application of HDNetDB for network-based investigations, we examined the potential connection between HD and UPR, which is a complex intracellular pathway. UPR is activated upon accumulation of unfolded protein in the endoplasmic reticulum (ER). In mammalian cells, the UPR consists of three principal branches defined by signaling components located in the ER membrane: (i) ERN1 (Endoplasmic Reticulum To Nucleus Signaling 1) also referred to as IRE1 (inositol requiring enzyme 1), (ii) EIF2AK3 (Eukaryotic Translation Initiation Factor 2-Alpha Kinase 3) also referred to as PERK (protein kinase R-like ER kinase), and (iii) ATF6 (activating transcription factor 6). The main role of the UPR is to ensure homeostasis by increasing protein folding capacity within the ER, and by reduction of protein synthesis. If homeostasis cannot be re-established, persistent UPR activation can trigger cell death27. Although the UPR is well studied, its role inmany diseases warrants further elucidation. This is also the case for HD, where different lines of investigation indicated a potential relevance of the UPR for the pathogenesis of HD28, 29.
Figure 1. Data and information integrated in HDNetDB. Many types of complementary data and information
can be accessed, analyzed and visualized in HDNetDB. While the incorporation of generic data like the human interactome provides a backbone for unbiased network construction, the inclusion of many HD-specific data empower researchers to carry out network-oriented investigations targeting molecular processes in HD.
www.nature.com/scientificreports/
To start our network-based investigations, we collected a small set of six key proteins that were reported to be involved in the UPR signaling pathway triggered by ER stress. Besides the three key signaling components mentioned above (ERN1, EIF2AK3, ATF6), we selected transcription factors X-Box Binding Protein 1 (XBP1) and DNA-damage-inducible transcript 3 (DDIT3), also known as CHOP. Both are downstream of ERN1 and EIF2AK3. Additionally, BCL2-associated X protein (BAX) was included, which modulates UPR by a direct inter-action with ERN130, 31. It should be emphasized that numerous other proteins have been associated with the UPR,
but we took only a small set for better illustration. Nevertheless, we would like to obtain a more comprehensive coverage of proteins associated with UPR and more importantly also of proteins that link the UPR to other pro-cesses. Thus, we queried HDNetDB with the six proteins and obtained a set of 354 interacting proteins, which we refer to here as the UPR interactome (Table S1). The workflow and the UPR interactome generated by HDNetDB are presented in Fig. 2. In the network, the six queried proteins serve as “anchor” nodes.
We note that this example shows a common characteristic of network-based investigations: despite starting with a small number of anchor proteins, the retrieved networks are fairly large, especially for well-studied anchor proteins. This makes individual inspection of their components into a highly challenging and time-consuming task. To assist researchers here, HDNetDB offers a series of integrated tools, which enable rapid functional assess-ment of retrieved networks and prioritization of network components for further investigation.
KEGG pathway enrichment analysis in UPR interactome.
To gain insights into the functional com-position of the retrieved networks, we performed statistical enrichment analysis based on KEGG pathways anno-tations using the tool implemented on the Network page of HDNetDB. This type of analysis can identify those pathways curated in KEGG whose components are significantly overrepresented in the UPR interactome. Thus, we can verify whether we indeed obtained more proteins associated with UPR and we can identify other pro-cesses that are linked to the UPR based on the extract interactions. Results of enrichment analysis are returned to the user of HDNetDB as a table listing the detected pathways along with the number of corresponding network proteins and their statistical significance (Fig. 3). For the UPR interactome, the pathway “Protein processing in the ER” achieved expectably the highest significance for overrepresentation (n = 41, FDR = 4.88E−23). Notably,apoptosis (n = 23, FDR = 5.48E−13) and cell cycle (n = 23, FDR = 2.29E−10) were also among the most significant
KEGG pathways indicating a tight connection between the UPR and these processes within our network model of the UPR. Strikingly, we also found proteins associated with HD in the KEGG database (n = 20, FDR = 1.88E−5)
to be strongly overrepresented within the UPR interactome supporting the link between UPR and HD. Besides statistical evaluation, HDNetDB enables the highlighting of proteins associated with the detected pathways and thereby facilitates the individual inspection of pathway components. Examples for this option can be shown in Fig. 3. Alternatively to KEGG annotations, users can carry out functional enrichment analyses based on Gene Ontology (GO) categories for molecular functions, biological processes and cellular compartments.
Linking the UPR interactome to mammalian phenotypes.
Connecting molecular processes to phenotypes is a daunting task in biomedicine. An important help here is provided by extensive cataloging ofFigure 2. HDNetDB workflow. HDNetDB retrieves the physical and regulatory interactions found for the
queried genes or proteins, and generates a network. This is visualized by larger grey and smaller yellow nodes representing the input/query and interacting proteins, while red arrows and blue edges represent regulatory and protein-protein interactions, respectively. Subsequently, the network can be examined and filtered using various complementary datasets and tools integrated in HDNetDB.
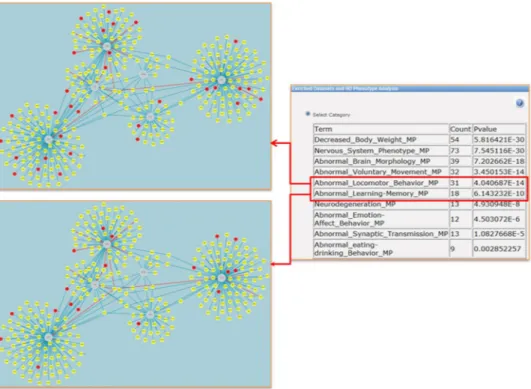
phenotypes observed for gene knockouts in model organisms. For research into human diseases, the systematic phenotype annotations of murine genotypes provided in the Mouse Genome Informatics (MGI) database are a valuable resource. This is also the case in our study of the UPR interactome. Using the relevant tool implemented in HDNetDB, the network was examined for possible enrichment of proteins associated with HD-relevant pheno-types. Remarkably, we found that most of the selected phenotypes are highly overrepresented among the network components (Fig. 4). For instance, the most significant phenotype (n = 54; p = 5.8E-30) was “Decreased body weight”, which is a common characteristics of HD patients already in the early stage of disease32. Intriguingly,
the UPR interactome is also strongly enriched in components linked to abnormal locomotor behavior (n = 31; p = 4.04E-14), which is a classical hallmark of HD. To our knowledge, such a connection between UPR and loss of motor control has not been put forward so far. All in all, the results of the phenotypic analysis carried out in HDNetDB suggest that the UPR interactome includes many genes whose knockout in mice lead to HD-relevant phenotypes. These genes can be readily identified interactively in HDNetDB (Fig. 4).
In silico screens with curated gene lists.
Besides pathways information and functional or phenotypicannotation, HDNetDB includes curated HD-relevant gene lists, which can be used for examination of networks. Overrepresentation of curated genes among network components can readily be assessed. For the UPR network, HDNetDB identified several gene sets as significantly overrepresented (Supplementary Fig. S1). These include HD Therapeutic Target Genes (HDTTG) – a curated set of genes that were previously identified as potential therapeutic targets in HD6. Also, 63 HTT-interacting proteins were identified suggesting not only a functional
but also a direct physical connection between UPR and (mutant) HTT. This is in line with previous findings that wild-type HTT is crucial for the integrity of the ER33. Since the poly-Q expansion results in a distinct binding
behavior of mutant compared to wild-type HTT23, 34–36, the results of our analyses suggests that the HD-causing
mutation might also have a direct impact on the functioning of the UPR through aberrant protein binding. In addition, we identified a large number of genes (n = 94) that have been genetically associated with neurological diseases, supporting a link between UPR and neuropathology in general. Importantly, users can carry out in
silico screens based on their own uploaded gene lists, so they are not limited to the curated genes lists provided
in HDNetDB.
Sequential filtering for prioritization of candidate genes.
Besides the elucidation of the relevance of molecular processes for HD, prioritization of candidate genes for further study and for therapeutic intervention can be carried out efficiently in HDNetDB. Every network produced by application of a filtering procedure can be used as input for another filtering step. In this way, users can define the order and criteria for a sequential fil-tering procedure in a flexible manner. Moreover, complementary data integrated in HDNetDB can be exploited for network-based gene selection – a strategy which has already been used effectively in molecular pharmacol-ogy37. For illustration, we carried out step-wise filtering to identify components in the UPR interactome thatare (i) differentially expressed, (ii) associated previously with HD and (iii) known drug targets. The underlying
Figure 3. KEGG Pathway enrichment analysis. Results of enrichment analyses are returned as table listing
pathways with significant overrepresentation among network proteins (right side). By a mouse click on a table row, components of the selected pathways are highlighted in the network as shown here for “Protein processing in endoplasmic reticulum” and “Huntington’s Disease”.
www.nature.com/scientificreports/
motivation for these criteria was to discover proteins related to the UPR whose dysregulation can play a role in the pathogenesis of HD, and can be readily targeted by existing drugs. In the first step, the UPR interactome was filtered based on expression changes between human HD caudate nucleus and normal caudate nucleus, which are available in HDNetDB as one of many comparisons of HD-related gene expression data (Fig. 5a). This resulted in a network of 37 differentially regulated genes, of which 18 are up-regulated and 19 are down-regulated (Fig. 5b). In the next step, we filtered this network based on the criterion that the included components have been either directly or indirectly implicated in HD as described in Kalathur RK et al.6 (Fig. 5c). This led to the identification
of network with 14 genes that are not only differentially expressed in HD but are also implicated in HD and thus may constitute a link between UPR and HD. Finally, we further filtered this network based on known drug-targets present in HDNetDB (Fig. 5d). Only four proteins remained after the sequential filtering that could possibly play key roles in linking HD and UPR, and can be targeted with existing drugs: histone deacetylase1 (HDAC1), jun proto-oncogene (JUN), solute carrier family 25 member 4 (SLC25A4) and 3-hydroxy-3-methylglutaryl-CoA reductase (HMGCR) (Fig. 5d).
HDAC1 is a component of the histone deactylase complex and plays an important role in regulation of gene expression. It can act as a molecular switch between neuronal survival and death by interacting with HDRP and HDAC3 respectively38. A recent study showed that targeting HDAC1 with HDAC inhibitors resulted in an
improvement in HD related phenotypes in different HD model systems39. The second gene, JUN, is a
transcrip-tion factor and component of the AP-1 transcriptranscrip-tion complex that plays a key in role in neural development. Studies have also shown that there is a strong induction of JUN both at the gene and protein level in several human neurodegenerative diseases such as Alzheimer’s dementia40, 41, Parkinson’s disease42, 43 and amyotrophic
lateral sclerosis44. The third known drug target we identified was SLC25A4 (ANT1), which is a member of a
subfamily of solute carrier proteins that help in translocation of ADP from cytoplasm to mitochondrial matrix as well as of ATP from mitochondrial matrix to cytoplasm. In addition, SLC25A4 also regulates the mitochon-drial permeability transition pore that initiates apoptosis. It has been speculated that increased expression of
SLC25A4 following a brain injury has biphasic consequence: the initial repair of damaged cells and neurons by
increasing ATP export but eventual destruction of damaged cells by apoptosis if the damage is beyond repair45, 46.
The final gene (HMGCR) identified is an ER resident transmembrane glycoprotein and the rate-limiting enzyme for cholesterol synthesis. Perturbations of the cholesterol metabolism have been reported in HD models as well as in HD patients47. HMGCR levels are regulated in response to sterols by ubiquitin-proteasome system through
ER-associated degradation (ERAD) pathway. As mutant HTT has been shown to impair ERAD in cellular models of HD, and thereby to interfere with protein homeostasis in the ER48, it is conceivable that an activated UPR might
have an impact on the cholesterol synthesis in HD patients. Taken together, the reported findings indicate that the identified genes can provide attractive targets in the context of UPR and HD, although a more comprehensive evaluation is certainly warranted.
Figure 4. Phenotypic enrichment analysis. HD-relevant mammalian phenotypes are listed, for which a
significant enrichment among components of the UPR interactome was detected. Highlighted phenotypes are “Abnormal Locomotor Behavior” and “Abnormal Learning Memory”. Red nodes represent the genes or proteins annotated with these HD-relevant phenotypes in MGI.
Discussion
HD is a fatal neurodegenerative disease with no known cure. Although it is caused by mutation of a single gene, its molecular manifestation appears to be highly complex and includes numerous processes. To help researchers better cope with the molecular complexity of HD, we have developed HDNetDB. Its development was motivated by our own experiences in network-oriented analyses of HD. Although a large number of tools for analysis of interaction network exists (including our UniHI database49), they are generally generic and require laborious
data handling to study selected aspects of a specific disease such as HD. HDNetDB can help to overcome these limitations. It is a flexible platform that is customized for HD research. It integrates different types of data rang-ing from molecular interactions, drug-target information, HD associated genes and their expression in different model organisms and in humans.
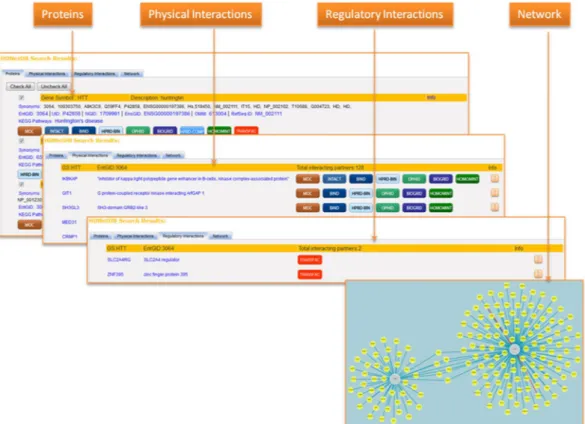
HDNetDB was designed to provide easy access to the results of a query. The retrieved data are presented simultaneously on four pages (Proteins, Physical Interactions, Regulatory Interactions and Network) enabling the user to switch between different types of information (Fig. 6). The Proteins page gives an overview of the genes and proteins matching the query in the database. Proteins, which should not be included as anchor nodes in the generated network, can be excluded. In our case study, for instance, we excluded X-box binding protein 1 pseu-dogene 1 (XBP1P1). It was found because one of its aliases is the same as the gene symbol of our query protein XBP. Such exclusion on the Proteins page will automatically update the network presented on the Network page. The Physical and Regulatory Interactions pages list all interaction partners found at the level of physical protein association or gene regulation for the queried genes and proteins. The sources from which each interaction has been retrieved are shown, and hyperlinks to these sources are provided, if available. In addition, different types of information regarding the individual interaction are given including the methods that were used for identification of the interactions as well as quality scores such as functional co-annotation and co-expression in human tissues. On both Interactions pages, options to download the full set of interactions are provided. Finally, the Network page displays a graphical visualization of the retrieved network. In addition to simple network visualization, a battery of tools for interactive network analysis is available on the side bar of the Network page. First, filtering of interactions can be carried out based on source, type, topology, experimental derivation and number of PubMed references attributed to the interaction. This allows the exclusion of interactions that might be considered less reliable by the user. For instance, setting the required number of PubMed reference to two reduces the net-work interactions to those that have been reported in at least two publications. Alternatively, interactions from throughput experiments or computational prediction can be excluded for network reduction. Second, high-lighting and filtering of network components can be performed on the basis of additional information integrated in HDNetDB such as HD-relevant gene expression data, gene sets, and drug target information. Since all filters
Figure 5. Sequential filtering of UPR interactome. (a) Initial UPR network; (b) Network after filtering by
differential expression in human HD caudate nucleus samples using the criteria log2 fold change ≥ +0.25 and ≤−0.25; (c) Network of dysregulated components which have been indicated as potential therapeutic targets for HD; (d) Final network obtained after filtering using protein-drug target information (DrugBank). Red and green nodes indicate up and down regulated genes, respectively, and large grey nodes represent query proteins.
www.nature.com/scientificreports/
can be applied sequentially, users of HDNetDB can easily develop and apply their own schemes for prioritization as illustrated in our case study. Third, the functional relevance of displayed networks can be explored through enrichment analysis. HDNetDB calculates the statistical significance of overrepresentation of network proteins among GO categories or KEGG pathways and returns a table with significantly enriched categories or pathways. The genes associated with a detected GO category or pathway can be highlighted in the network by clicking on the specific GO category or pathway in the table. Fourth, an equivalent enrichment analysis can be performed for mammalian phenotypes associated with the network components. These types of enrichment analysis can help to assess the functional relevance of the retrieved networks. Fifth, apart from providing functionalities based on data present in the database, the interface also enables users to map or filter networks based on their own gene list or gene expression data after uploading. In this manner, HDNetDB provides a readily extendable platform for data integration to the user. Lastly, the final network can be exported in a simple text tab-delimited file format, or as an image in PNG or PDF format.
Although many HD-relevant data have been integrated in HDNetDB, researcher might want to carry out analyses beyond the scope of HDNetDB. In this context, HDNetDB can serve as a primary resource for (filtered) interaction networks. Our recent meta-analysis of differential gene expression affecting the UPR in HD provides an example50. In that study, we used HDNetDB to define a UPR interactome (in the similar way as presented
here), which was then downloaded and further scrutinized using the GSEA software to detect significant trends in expression changes. In addition, we downloaded interactions of apoptosis genes to detect and visualize links between UPR and apoptosis. For this purpose, we used the standalone Cytoscape software due to the large num-ber of interactions, which prohibits a visualization via the web-application. Two possibilities of downloading HDNetDB interaction data in table format exist: (1) the (filtered) network from the Network page or (2) the listed interactions on the Physical and Regulatory Interactions pages. A word of caution here: The first option should only be used for networks with few interactions because of a time-consuming rendering process that underlies the generation of the table on the Network page. In contrast, the second option is much more efficient and provides rapid downloads for even large number of interactions. Alternatively, the full set of interaction data integrated in HDNetDB can be downloaded from the webpage.
Since HDNetDB integrates data from different dynamic sources, biannual updates are scheduled. Furthermore, we will continue to incorporate data and information with relevance for HD. These can include data from RNA-seq or genome-wide association studies, or information regarding the permeability of the blood-brain barrier for drugs. To facilitate the generation of high-confidence network, we plan to implement further options for filtering based on co-annotation and co-expression as well as on quality scores provided by some primary resources. An additional feature might be the visual indication of physical complexes in the network.
Figure 6. User interface of HDNetDB. After execution of the query, information about proteins and their
interactions are shown and visualized on four different pages. The Network page provides additionally various tools for interactive analysis.
To conclude, HDNetDB provides an array of tools for querying, analyzing and visualizing molecular interac-tions. These tools will not only facilitate better understanding of biological processes, functions and pathways that are involved in HD pathogenesis but will also serve to identify novel molecular targets and the development of new therapeutic strategies in curing HD. Finally, we believe that HDNetDB can serve as a general prototype for a new generation of network-oriented resources that are customized towards specific diseases.
Methods
Database and architecture.
HDNetDB is implemented using platform-independent and open-source software tools. Its architecture comprises two tiers: The database tier consists of a MySQL relational database management system. The application tier complies with an Java 2 Enterprise Edition J2EE architecture and includes Hibernate and Java DataBase Connectivity (JDBC) to connect to the back-end database, Data Access Object (DAO) to interact with the database and accessing data, and JavaServerPages (JSP) to generate web pages. The communication between client and the web application is carried out through Java servlets and JSP, employ-ing an Apache Tomcat server with servlet container.Molecular networks are visualized using Cytoscape Web library, which enables embedded representation of graphs into a webpage51. Performance of Cytoscape Web is a function of graph size, so performance decreases
as the number of elements increases. To prevent the visualization tool from becoming unresponsive, certain automatic filtering and layout procedures have been implemented for larger networks (detailed in Supplementary
Materials).
The HDNetDB database re-utilizes several components that have been developed previously for the Unified Human Interactome (UniHI) database49. In contrast to UniHI, which is a generic database for human molecular
interactions and their annotation, HDNetDB is tailor-made for HD research and includes many additional data-sets and functionalities. In particular, HDNetDB harbors molecular interactions, gene expression data, gene data-sets and phenotype information associated with HD and neurodegeneration.
Statistical network analyses.
For interpretation of the functional relevance of displayed networks, we have implemented a tool performing enrichment analyses of network proteins for GO annotations52 and thepublic version of KEGG pathways53. The statistical enrichment is calculated using the hypergeometric
distri-bution. Enriched terms, along with their significance of enrichment displayed as p-values and false discovery rates (FDR)54, are returned to the browser in a tabular format. Computations are performed via Rserve (TCP/
IP server), which enables the use of R statistical software and several freely available Bioconductor packages at backend.
Data integrated in HDNetDB.
Various types of data and information have been integrated in HDNetDB. Besides molecular interaction, HDNetDB includes gene expression and drug-target data as well as a diverse range of gene annotations and associations with relevance for neurodegeneration and HD.Molecular interaction data.
Molecular interactions in HDNetDB comprise both physical protein-protein interactions and regulatory interactions. Currently, HDNetDB integrates about 370000 unique interactions that were derived from large scale studies, literature curation or computational prediction. In particular, physical interactions identified for (mutant) HTT using high-throughput (HTP) Y2H assays or AP-MS were extracted from corresponding publications and merged into one dataset labeled as HTT-HTP20, 24, 25. In addition, weimported human protein-protein interactions from MDC55, CCSB56, HPRD57, DIP58, BIND59, BioGRID60,
IntAct61, REACTOME62, COCIT63, ORTHO64, MINT(HOMOMINT)65, I2D (OPHID)66 and regulatory
interac-tions from the public version of TRANSFAC67, miRTarBase68 and HTRIdb69 via the UniHI database49. Number of
proteins and interactions from each source are listed in Table 1.
Integrated gene expression data.
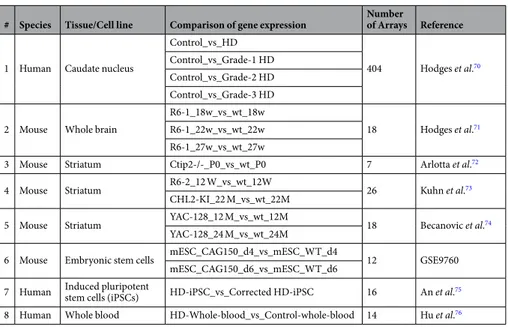
HDNetDB includes various transcriptome datasets, which can be used to analyze molecular networks. They were obtained from microarray measurements of gene expression under-taken for human HD brain or blood and controls samples as well as for different HD mouse models. An over-view of currently included expression datasets is given in Table 270–76. Data were obtained from Gene ExpressionOmnibus and analyzed using the R statistical software and several Bioconductor packages. After preprocessing, log 2 fold changes for different comparisons were calculated from background-corrected and normalized signal intensities and uploaded to HDNetDB. In total, 13 comparisons of expression between HD samples and their corresponding control can be currently accessed. In addition to HD-associated gene expression data, HDNetDB also includes expression profiles for 19 different human tissues obtained from Symatlas77, 78.
Drug target information.
To help rapidly identify known drug targets in molecular networks, relevant information from DrugBank79 was imported. Currently, HDNetDB holds information of about 4203 drugs thattarget about 2139 proteins. In total, 11793 drug target interactions are currently included. If available, the drug’s mode of action can be displayed.
Gene sets in the context of HD and neurodegeneration.
Intersecting networks with informative gene sets can be useful in the prioritization of network components for follow-up studies. At present, five different gene sets associated with HD and neurodegeneration can be mapped onto networks and their statistical enrichment can be calculated in HDNetDB (Table S2): (i) HDTTG (Huntington’s Disease Therapeutic Target Genes) (n = 950) are comprised of therapeutic target genes described in Kalathur RK et al.6 and compiled from the HD ResearchCrossroads database. This gene list was manually curated and each included gene was scored based on exist-ing experimental evidence for a disease-modifyexist-ing effect. An extended list was recently published and will be included in future versions of HDNetDB80. (ii) HTT-interacting-proteins include 1016 genes whose corresponding
www.nature.com/scientificreports/
proteins were detected as directly or indirectly interacting with HTT. This gene set was derived by querying HDNetDB for HTT interactors. (iii) NDGA (Neurological Diseases Gene Association) consists of 2698 genes that have a genetic association with neurological diseases as indicated in the Genetic Association database81. The data
were originally extracted from published papers on candidate genes and genome wide association studies. (iv)
HDTM (Huntington’s Disease genes through Text Mining) was derived through text mining implemented in the
GeneCards database82 using “Huntington’s disease” as a keyword search. The text mining returned 673 genes
associated with HD. (v) NDMOD (Neurodegeneration Modifiers) is derived from independently compiled gene list comprising genetic modifies of neurodegeneration identified in various model systems. The list was created by review of published genetic screens undertaken in S. cerevisae, C. elegans and D. melanogaster models83. After
mapping to Entrez Gene IDs of the corresponding human orthologs, 217 genes remained.
Source Number of proteins Number of interactions Type of interaction Methods Reference
HTT-HTP 925 1022 Physical protein interaction Y2H screens and AP-MS 20, 24–26
MDC-Y2H 1713 3340 Physical protein interaction Y2H screen 55
CCSB 3741 6821 Physical protein interaction Y2H screen 56
HPRD 12613 65227 Physical protein interaction Literature curation 57
BioGRID 14822 124035 Physical protein interaction Literature curation 58
BIND 11524 19352 Physical protein interaction Literature curation 59
DIP 3025 2925 Physical protein interaction Literature curation 85
IntAct 13611 37629 Physical protein interaction Literature curation 86
Reactome 5315 108867 Physical protein interaction Pathway curation 87
COCIT 3737 6580 Functional association Text mining 63
ORTHO 6056 62863 Physical protein interaction Computational prediction 64
HOMOMINT 6221 21863 Physical protein interaction Computational prediction + Literature curation 88
OPHID 7874 81677 Physical protein interaction Computational prediction 89
TRANSFAC 742 1554 Regulatory transcriptional interaction (Transcription
factor-based) Literature curation 67
miRTarBase 2234 3565 Regulatory post-transcriptional interaction (microRNAs-based) Literature curation 90
HTRIdb 1634 2263 Regulatory transcriptional interactions (Transcription
factor-based) Literature curation 69
Table 1. Molecular interaction datasets integrated in HDNetDB. The source, number of imported proteins and
interactions, type of interaction and methodology used for original identification of the interactions as well as the reference are listed.
# Species Tissue/Cell line Comparison of gene expression Number of Arrays Reference
1 Human Caudate nucleus
Control_vs_HD
404 Hodges et al.70
Control_vs_Grade-1 HD Control_vs_Grade-2 HD Control_vs_Grade-3 HD 2 Mouse Whole brain
R6-1_18w_vs_wt_18w
18 Hodges et al.71
R6-1_22w_vs_wt_22w R6-1_27w_vs_wt_27w
3 Mouse Striatum Ctip2-/-_P0_vs_wt_P0 7 Arlotta et al.72
4 Mouse Striatum R6-2_12 W_vs_wt_12W 26 Kuhn et al.73
CHL2-KI_22 M_vs_wt_22M
5 Mouse Striatum YAC-128_12 M_vs_wt_12M 18 Becanovic et al.74
YAC-128_24 M_vs_wt_24M
6 Mouse Embryonic stem cells mESC_CAG150_d4_vs_mESC_WT_d4 12 GSE9760 mESC_CAG150_d6_vs_mESC_WT_d6
7 Human Induced pluripotent stem cells (iPSCs) HD-iPSC_vs_Corrected HD-iPSC 16 An et al.75
8 Human Whole blood HD-Whole-blood_vs_Control-whole-blood 14 Hu et al.76
Table 2. Gene expression datasets for human HD samples and mouse models that are integrated in HDNetDB.
Phenotypic information derived from mouse knock-out models.
HDNetDB stores genotype-phenotype relations derived from mouse knock-out models for a selected set of phenotypes associated with HD. These were collected from the MGI database84 and include nervous system phenotype (MP:0003631; n = 2214), decreasedbody weight (MP:0001262; n = 1110), abnormal voluntary movement (MP:0003491; n = 904), abnormal locomo-tor behavior (MP:0001392; n = 850), abnormal brain morphology (MP:0002152; n = 1042), abnormal synaptic transmission (MP:0003635; n = 444), abnormal learning/memory (MP:0001449; n = 413), emotion/affect behav-ior (MP:0002572 abnormal; n = 346), abnormal eating/drinking behavbehav-ior (MP:0002069; n = 450) and neurode-generation (MP:0002229; n = 271). The list of mouse genes obtained for each phenotype are mapped to human orthologs and the corresponding human Entrez Gene IDs are stored in the HDNetDB.
HDNetDB web-interface: features and functions.
As a starting point for a network-based analysis, HDNetDB can be queried for molecular interactions of single or multiple human genes or proteins. As input, identifiers such as gene symbols or Entrez Gene, UniProtKB and Ensembl IDs can be used. Besides identifiers for human genes or proteins, HDNetDB accepts identifiers from model organisms: yeast (Saccharomyces cerevisiae), worm (Caenorhabditis elegans), fly (Drosophila melanogaster) and mouse (Mus musculus). These are automati-cally matched to the corresponding human orthologs to facilitate the practical use of HDNetDB for researchers working with HD model organisms. Accepted identifiers include Entrez Gene IDs for all model organisms, sys-tematic names for yeast, WormBase IDs or gene symbols for worm, FlyBase IDs or gene symbols for fly and MGI identifiers or gene symbols for mouse.The query generates four pages: Proteins, Physical Interactions, Regulatory Interactions and Network. The
Proteins page lists found genes and proteins in the database. For all matches, the Entrez Gene, UniProtKB,
Ensembl gene, RefSeq, and OMIM IDs as well as KEGG pathways (if available) are given along with hyperlinks to the resources. Furthermore, the original interaction datasets, in which the queried genes or proteins were found, are presented. By clicking on the corresponding Info button, gene ontology (GO) annotations are additionally displayed. The Physical and Regulatory Interactions pages show the found interactions and their sources. Detailed information including the method how the interaction was detected, corresponding PubMed references and con-fidence scores based on GO co-annotations or co-expression can be accessed via a pop-up window through click-ing the Info button. On the Network page, the generated network is displayed. The central nodes correspondclick-ing to query genes and proteins are highlighted as grey, large nodes in the default mode, while interacting partners are indicated by yellow, smaller nodes. Blue edges between nodes represent protein-protein interactions, whereas red arrows symbolize regulatory interactions with the given directionality. Using the implemented tools on the side-bar of the Network page, the network can be analyzed, sequentially filtered and exported.
References
1. The Huntington's Disease Collaborative Research Group. A novel gene containing a trinucleotide repeat that is expanded and unstable on Huntington's disease chromosomes. Cell 72, 971–983 (1993).
2. Walker, F. O. Huntington’s disease. Lancet 369, 218–228 (2007).
3. Zuccato, C., Valenza, M. & Cattaneo, E. Molecular mechanisms and potential therapeutical targets in Huntington’s disease. Physiol
Rev 90, 905–981 (2010).
4. Vonsattel, J. P. et al. Neuropathological classification of Huntington’s disease. J Neuropathol Exp Neurol 44, 559–577 (1985). 5. Graveland, G. A., Williams, R. S. & DiFiglia, M. Evidence for degenerative and regenerative changes in neostriatal spiny neurons in
Huntington’s disease. Science 227, 770–773 (1985).
6. Kalathur, R. K., Hernandez-Prieto, M. A. & Futschik, M. E. Huntington’s disease and its therapeutic target genes: a global functional profile based on the HD Research Crossroads database. BMC Neurol 12, 47 (2012).
7. Wexler, N. S. et al. Venezuelan kindreds reveal that genetic and environmental factors modulate Huntington’s disease age of onset.
Proc Natl Acad Sci USA 101, 3498–3503 (2004).
8. Gusella, J. F. & MacDonald, M. E. Huntington’s disease: the case for genetic modifiers. Genome Med 1, 80 (2009).
9. Rubinsztein, D. C., Barton, D. E., Davison, B. C. & Ferguson-Smith, M. A. Analysis of the huntingtin gene reveals a trinucleotide-length polymorphism in the region of the gene that contains two CCG-rich stretches and a correlation between decreased age of onset of Huntington’s disease and CAG repeat number. Hum Mol Genet 2, 1713–1715 (1993).
10. Snell, R. G. et al. Relationship between trinucleotide repeat expansion and phenotypic variation in Huntington’s disease. Nat Genet 4, 393–397 (1993).
11. Farrer, L. A. et al. The normal Huntington disease (HD) allele, or a closely linked gene, influences age at onset of HD. Am J Hum
Genet 53, 125–130 (1993).
12. Li, J. L. et al. A genome scan for modifiers of age at onset in Huntington disease: The HD MAPS study. Am J Hum Genet 73, 682–687 (2003).
13. Gayan, J. et al. Genomewide linkage scan reveals novel loci modifying age of onset of Huntington’s disease in the Venezuelan HD kindreds. Genet Epidemiol 32, 445–453 (2008).
14. Vasaikar, S. V., Padhi, A. K., Jayaram, B. & Gomes, J. NeuroDNet - an open source platform for constructing and analyzing neurodegenerative disease networks. BMC Neurosci 14, 3 (2013).
15. Barabasi, A. L., Gulbahce, N. & Loscalzo, J. Network medicine: a network-based approach to human disease. Nat Rev Genet 12, 56–68 (2011).
16. Ideker, T. & Sharan, R. Protein networks in disease. Genome Res 18, 644–652 (2008).
17. Stroedicke, M. et al. Systematic interaction network filtering identifies CRMP1 as a novel suppressor of huntingtin misfolding and neurotoxicity. Genome Res 25, 701–713 (2015)
18. Li, S. H. & Li, X. J. Huntingtin-protein interactions and the pathogenesis of Huntington’s disease. Trends Genet 20, 146–154 (2004). 19. Li, W., Serpell, L. C., Carter, W. J., Rubinsztein, D. C. & Huntington, J. A. Expression and characterization of full-length human
huntingtin, an elongated HEAT repeat protein. J Biol Chem 281, 15916–15922 (2006).
20. Tourette, C. et al. A Large-scale Huntingtin Protein Interaction Network Implicates Rho GTPase Signaling Pathways in Huntington’s Disease. J Biol Chem (2014).
21. Culver, B. P. et al. Proteomic analysis of wild-type and mutant huntingtin-associated proteins in mouse brains identifies unique interactions and involvement in protein synthesis. J Biol Chem 287, 21599–21614 (2012).
www.nature.com/scientificreports/
23. Harjes, P. & Wanker, E. E. The hunt for huntingtin function: interaction partners tell many different stories. Trends Biochem Sci 28, 425–433 (2003).
24. Goehler, H. et al. A protein interaction network links GIT1, an enhancer of huntingtin aggregation, to Huntington’s disease. Mol Cell 15, 853–865 (2004).
25. Shirasaki, D. I. et al. Network organization of the huntingtin proteomic interactome in mammalian brain. Neuron 75, 41–57 (2012). 26. Kaltenbach, L. S. et al. Huntingtin interacting proteins are genetic modifiers of neurodegeneration. PLoS Genet 3, e82 (2007). 27. Ron, D. & Walter, P. Signal integration in the endoplasmic reticulum unfolded protein response. Nat Rev Mol Cell Biol 8, 519–529
(2007).
28. Vidal, R., Caballero, B., Couve, A. & Hetz, C. Converging pathways in the occurrence of endoplasmic reticulum (ER) stress in Huntington’s disease. Curr Mol Med 11, 1–12 (2011).
29. Kim, I., Xu, W. & Reed, J. C. Cell death and endoplasmic reticulum stress: disease relevance and therapeutic opportunities. Nat Rev
Drug Discov 7, 1013–1030 (2008).
30. Liu, C. Y. & Kaufman, R. J. The unfolded protein response. J Cell Sci 116, 1861–1862 (2003).
31. Forman, M. S., Lee, V. M. & Trojanowski, J. Q. ‘Unfolding’ pathways in neurodegenerative disease. Trends Neurosci 26, 407–410 (2003).
32. Djousse, L. et al. Weight loss in early stage of Huntington’s disease. Neurology 59, 1325–1330 (2002).
33. Omi, K., Hachiya, N. S., Tokunaga, K. & Kaneko, K. siRNA-mediated inhibition of endogenous Huntington disease gene expression induces an aberrant configuration of the ER network in vitro. Biochem Biophys Res Commun 338, 1229–1235 (2005).
34. Benn, C. L. et al. Huntingtin modulates transcription, occupies gene promoters in vivo, and binds directly to DNA in a polyglutamine-dependent manner. J Neurosci 28, 10720–10733 (2008).
35. Munsie, L. et al. Mutant huntingtin causes defective actin remodeling during stress: defining a new role for transglutaminase 2 in neurodegenerative disease. Hum Mol Genet 20, 1937–1951 (2011).
36. Ng, C. W. et al. Extensive changes in DNA methylation are associated with expression of mutant huntingtin. Proc Natl Acad Sci USA 110, 2354–2359 (2013).
37. Pinto, J. P., Machado, R. S., Xavier, J. M. & Futschik, M. E. Targeting molecular networks for drug research. Front Genet 5, 160 (2014). 38. Bardai, F. H., Price, V., Zaayman, M., Wang, L. & D’Mello, S. R. Histone deacetylase-1 (HDAC1) is a molecular switch between
neuronal survival and death. J Biol Chem 287, 35444–35453 (2012).
39. Jia, H. et al. Histone deacetylase (HDAC) inhibitors targeting HDAC3 and HDAC1 ameliorate polyglutamine-elicited phenotypes in model systems of Huntington’s disease. Neurobiol Dis 46, 351–361 (2012).
40. Pearson, A. G., Byrne, U. T., MacGibbon, G. A., Faull, R. L. & Dragunow, M. Activated c-Jun is present in neurofibrillary tangles in Alzheimer’s disease brains. Neurosci Lett 398, 246–250 (2006).
41. Thakur, A. et al. c-Jun phosphorylation in Alzheimer disease. J Neurosci Res 85, 1668–1673 (2007).
42. Oo, T. F., Henchcliffe, C., James, D. & Burke, R. E. Expression of c-fos, c-jun, and c-jun N-terminal kinase (JNK) in a developmental model of induced apoptotic death in neurons of the substantia nigra. J Neurochem 72, 557–564 (1999).
43. Silva, R. M., Kuan, C. Y., Rakic, P. & Burke, R. E. Mixed lineage kinase-c-jun N-terminal kinase signaling pathway: a new therapeutic target in Parkinson’s disease. Mov Disord 20, 653–664 (2005).
44. Migheli, A., Piva, R., Atzori, C., Troost, D. & Schiffer, D. c-Jun, JNK/SAPK kinases and transcription factor NF-kappa B are selectively activated in astrocytes, but not motor neurons, in amyotrophic lateral sclerosis. J Neuropathol Exp Neurol 56, 1314–1322 (1997).
45. Coskun, P. et al. A mitochondrial etiology of Alzheimer and Parkinson disease. Biochim Biophys Acta 1820, 553–564 (2012). 46. Lee, J., Schriner, S. E. & Wallace, D. C. Adenine nucleotide translocator 1 deficiency increases resistance of mouse brain and neurons
to excitotoxic insults. Biochim Biophys Acta 1787, 364–370 (2009).
47. Valenza, M. & Cattaneo, E. Emerging roles for cholesterol in Huntington’s disease. Trends Neurosci 34, 474–486 (2011).
48. Duennwald, M. L. & Lindquist, S. Impaired ERAD and ER stress are early and specific events in polyglutamine toxicity. Genes Dev 22, 3308–3319 (2008).
49. Kalathur, R. K. et al. UniHI 7: an enhanced database for retrieval and interactive analysis of human molecular interaction networks.
Nucleic Acids Res 42, D408–414 (2014).
50. Kalathur, R. K. et al. The unfolded protein response and its potential role in Huntington’s disease elucidated by a systems biology approach. F1000Res 4, 103 (2015).
51. Lopes, C. T. et al. Cytoscape Web: an interactive web-based network browser. Bioinformatics 26, 2347–2348 (2010).
52. Ashburner, M. et al. Gene ontology: tool for the unification of biology. The Gene Ontology Consortium. Nat Genet 25, 25–29 (2000). 53. Kanehisa, M. et al. KEGG for linking genomes to life and the environment. Nucleic Acids Res 36, D480–484 (2008).
54. Hochberg, Y. & Benjamini, Y. More powerful procedures for multiple significance testing. Stat Med 9, 811–818 (1990). 55. Stelzl, U. et al. A human protein-protein interaction network: a resource for annotating the proteome. Cell 122, 957–968 (2005). 56. Rual, J. F. et al. Towards a proteome-scale map of the human protein-protein interaction network. Nature 437, 1173–1178 (2005). 57. Keshava Prasad, T. S. et al. Human Protein Reference Database–2009 update. Nucleic Acids Res 37, D767–772 (2009).
58. Salwinski, L. et al. The Database of Interacting Proteins: 2004 update. Nucleic Acids Res 32, D449–451 (2004).
59. Isserlin, R., El-Badrawi, R. A. & Bader, G. D. The Biomolecular Interaction Network Database in PSI-MI 2.5. Database (Oxford) 2011, baq037 (2011).
60. Chatr-Aryamontri, A. et al. The BioGRID interaction database: 2017 update. Nucleic Acids Res 45, D369–D379 (2017).
61. Orchard, S. et al. The MIntAct project–IntAct as a common curation platform for 11 molecular interaction databases. Nucleic Acids
Res 42, D358–363 (2014).
62. Fabregat, A. et al. The Reactome pathway Knowledgebase. Nucleic Acids Res 44, D481–487 (2016).
63. Ramani, A. K., Bunescu, R. C., Mooney, R. J. & Marcotte, E. M. Consolidating the set of known human protein-protein interactions in preparation for large-scale mapping of the human interactome. Genome Biol 6, R40 (2005).
64. Lehner, B. & Fraser, A. G. A first-draft human protein-interaction map. Genome Biol 5, R63 (2004).
65. Licata, L. et al. MINT, the molecular interaction database: 2012 update. Nucleic Acids Res 40, D857–861 (2012).
66. Kotlyar, M., Pastrello, C., Sheahan, N. & Jurisica, I. Integrated interactions database: tissue-specific view of the human and model organism interactomes. Nucleic Acids Res 44, D536–541 (2016).
67. Matys, V. et al. TRANSFAC and its module TRANSCompel: transcriptional gene regulation in eukaryotes. Nucleic Acids Res 34, D108–110 (2006).
68. Chou, C. H. et al. miRTarBase 2016: updates to the experimentally validated miRNA-target interactions database. Nucleic Acids Res 44, D239–247 (2016).
69. Bovolenta, L. A., Acencio, M. L. & Lemke, N. HTRIdb: an open-access database for experimentally verified human transcriptional regulation interactions. BMC Genomics 13, 405 (2012).
70. Hodges, A. et al. Regional and cellular gene expression changes in human Huntington’s disease brain. Hum Mol Genet 15, 965–977 (2006).
71. Hodges, A. et al. Brain gene expression correlates with changes in behavior in the R6/1 mouse model of Huntington’s disease. Genes
Brain Behav 7, 288–299 (2008).
72. Arlotta, P., Molyneaux, B. J., Jabaudon, D., Yoshida, Y. & Macklis, J. D. Ctip2 controls the differentiation of medium spiny neurons and the establishment of the cellular architecture of the striatum. J Neurosci 28, 622–632 (2008).
73. Kuhn, A. et al. Mutant huntingtin’s effects on striatal gene expression in mice recapitulate changes observed in human Huntington’s disease brain and do not differ with mutant huntingtin length or wild-type huntingtin dosage. Hum Mol Genet 16, 1845–1861 (2007).
74. Becanovic, K. et al. Transcriptional changes in Huntington disease identified using genome-wide expression profiling and cross-platform analysis. Hum Mol Genet 19, 1438–1452 (2010).
75. An, M. C. et al. Genetic correction of Huntington’s disease phenotypes in induced pluripotent stem cells. Cell Stem Cell 11, 253–263 (2012).
76. Hu, Y. et al. Transcriptional modulator H2A histone family, member Y (H2AFY) marks Huntington disease activity in man and mouse. Proc Natl Acad Sci USA 108, 17141–17146 (2011).
77. Russ, J. & Futschik, M. E. Comparison and consolidation of microarray data sets of human tissue expression. BMC Genomics 11, 305 (2010).
78. Su, A. I. et al. A gene atlas of the mouse and human protein-encoding transcriptomes. Proc Natl Acad Sci USA 101, 6062–6067 (2004).
79. Knox, C. et al. DrugBank 3.0: a comprehensive resource for ‘omics’ research on drugs. Nucleic Acids Res 39, D1035–1041 (2011). 80. Wang, K. T. J., Langfelder, P., Horvath, S. & Palazzolo J. M. Exosomes and Homeostatic Synaptic Plasticity Are Linked to Each other
and to Huntington's, Parkinson's, and Other Neurodegenerative Diseases by Database-Enabled Analyses of Comprehensively Curated Datasets. Frontiers in Neuroscience 11 (2017).
81. Becker, K. G., Barnes, K. C., Bright, T. J. & Wang, S. A. The genetic association database. Nat Genet 36, 431–432 (2004). 82. Safran, M. et al. GeneCards Version 3: the human gene integrator. Database (Oxford) 2010, baq020 (2010).
83. Chen, X. & Burgoyne, R. D. Identification of common genetic modifiers of neurodegenerative diseases from an integrative analysis of diverse genetic screens in model organisms. BMC Genomics 13, 71 (2012).
84. Blake, J. A. et al. Mouse Genome Database (MGD)-2017: community knowledge resource for the laboratory mouse. Nucleic Acids
Res 45, D723–D729 (2017).
85. Chatr-Aryamontri, A. et al. The BioGRID interaction database: 2013 update. Nucleic Acids Res 41, D816–823 (2013). 86. Kerrien, S. et al. The IntAct molecular interaction database in 2012. Nucleic Acids Res 40, D841–846 (2012).
87. Croft, D. et al. Reactome: a database of reactions, pathways and biological processes. Nucleic Acids Res 39, D691–697 (2011). 88. Persico, M. et al. HomoMINT: an inferred human network based on orthology mapping of protein interactions discovered in model
organisms. BMC Bioinformatics 6(Suppl 4), S21 (2005).
89. Brown, K. R. & Jurisica, I. Online predicted human interaction database. Bioinformatics 21, 2076–2082 (2005).
90. Hsu, S. D. et al. miRTarBase: a database curates experimentally validated microRNA-target interactions. Nucleic Acids Res 39, D163–169 (2011).
Acknowledgements
The work presented was supported by CHDI Foundation (A-2666) and Portuguese Fundação para a Ciência e a Tecnologia [SFRH/BPD/70718/2010, SFRH/BPD/96890/2013, IF/00881/2013, UID/BIM/04773/2013 – CBMR, and UID/Multi/04326/2013 – CCMAR]. We would like to thank Robert Belshaw for careful reading of our manuscript, both reviewers for their constructive comments, Joseph Scarpa for suggestions how to enhance the utility of HDNetDB and James Wang for providing the original HDTTG list.
Author Contributions
R.K. collected the data, developed database, software prepared the original draft of the manuscript, J.P. and B.S. developed software and tested the database, G.C. developed database and tested the database and M.F. guided the software development, interpretation of the results and wrote the final version of the manuscript.
Additional Information
Supplementary information accompanies this paper at doi:10.1038/s41598-017-05224-0 Competing Interests: The authors declare that they have no competing interests.
Publisher's note: Springer Nature remains neutral with regard to jurisdictional claims in published maps and
institutional affiliations.
Open Access This article is licensed under a Creative Commons Attribution 4.0 International
License, which permits use, sharing, adaptation, distribution and reproduction in any medium or format, as long as you give appropriate credit to the original author(s) and the source, provide a link to the Cre-ative Commons license, and indicate if changes were made. The images or other third party material in this article are included in the article’s Creative Commons license, unless indicated otherwise in a credit line to the material. If material is not included in the article’s Creative Commons license and your intended use is not per-mitted by statutory regulation or exceeds the perper-mitted use, you will need to obtain permission directly from the copyright holder. To view a copy of this license, visit http://creativecommons.org/licenses/by/4.0/.