On Attack-Relevant Ranking of Network Features
Adel Ammar, Khaled Al-Shalfan College of Computer and Information Sciences Al-Imam Mohammad Ibn Saud Islamic University (IMSIU)
Riyadh, KSA
Abstract—An Intrusion Detection System (IDS) is an important component of the defense-in-depth security mechanism in any computer network system. For assuring timely detection of intrusions from millions of connection records, it is important to reduce the number of connection features examined by the IDS, using feature selection or feature reduction techniques. In this scope, this paper presents the first application of a distinctive feature selection method based on neural networks to the problem of intrusion detection, in order to determine the most relevant network features, which is an important step towards constructing a lightweight anomaly-based intrusion detection system. The same procedure is used for feature selection and for attack detection, which gives more consistency to the method. We apply this method to a case study, on KDD dataset and show its advantages compared to some existing feature selection approaches. We then measure its dependence to the network architecture and the learning database.
Keywords—Intrusion detection; network security; feature selection; KDD dataset; neural networks
I. INTRODUCTION
A network intrusion is any attempt or action aiming at compromising the confidentiality, integrity or availability of a computer or network. Intrusion detection systems (IDSs) are software or hardware systems that automate the process of monitoring the events occurring in a computer system or a network, in order to prevent intrusions, and detect threatening breaches in information security. Depending on the type of analysis performed, IDSs can be classified into two groups; a) signature-based, which rely on a regularly updated database of known attack signatures, and b) anomaly-based, which build a statistical model of the system's normal behavior, using machine learning or data mining techniques, and considers any excessive deviation from this behavioral profile to be an intrusion. During the last decade, anomaly detection has attracted the attention of many researchers to overcome the weakness of signature-based IDSs in detecting novel attacks. Nevertheless, due to the rapidly increasing network traffic, it becomes of significant interest for an anomaly-based IDS to rank the importance of input features, since the elimination of irrelevant or useless inputs leads to a simplification of the problem and may allow faster and more accurate detection. This is especially critical for the construction of an efficient real-time IDS able to comply with the constraints of high speed networks. In fact, some of the connection features may be irrelevant or redundant which results in lengthy detection process and degrades the performance of the IDS. For this aim, this article presents a feature selection method based on Neural Networks (NN), applied on the problem of classifying
traffic features according to their relative contribution to attack detection.
Section II introduces the method and describes its theoretical basis. Section III details the results of a case study for both a single and multiple output classification NN and reviews the advantages and limitations of the method. Finally, section IV draws a conclusion for the present work and mentions some open issues for future works.
II. THEORETICAL BASIS
Feature selection is the process of removing features from the original data set that are redundant or not very relevant with respect to the task that is to be performed, such as noisy features. Feature selection can be seen as a search problem on the power set of the set of available features, which is a combinatorial problem. The method proposed here for selecting connection features is a heuristic based on feed-forward neural networks. It has been applied in another application by [1] and theoretically formulated by [2] who called it HVS (Heuristic for Variable Selection). Nevertheless, it has not yet been applied to intrusion detection, to the best of our knowledge.
We introduce the features that need to be ranked as inputs of a feed-forward neural network (with a single hidden layer) used as a classifier that distinguishes attacks from normal traffic. After the training process on a representative learning database, we assess the relative contribution of each feature as follows. We expect the contribution Cjs of a neuron j of the
hidden layer to the output s according to the formula:
Nh k ks js jsW
W
C
1 (1) Where Wks is the weight of the connection between a
hidden neuron k and the output s and Nh is the number of
hidden neurons. Then, we obtain the contribution of an input neuron i to the output according to the formula:
Algorithm 1.Computation of a neuron‟s contribution
Where Wij is the weight of the connection between the
input neuron i and a hidden neuron j and Ni, is the number of
inputs. The sum of input contributions is, therefore, equal to 1. Note that (1) and (2) can be generalized to multiple outputs and multiple hidden layers and reduced to a single recursive formula if we define the contribution of output neurons as being equal to 1, according to Algorithm 1.
III. CASE STUDY ON KDDDATABASE
A. Distinction between normal and abnormal traffic: single output NN
1) Calculation of features' contribution
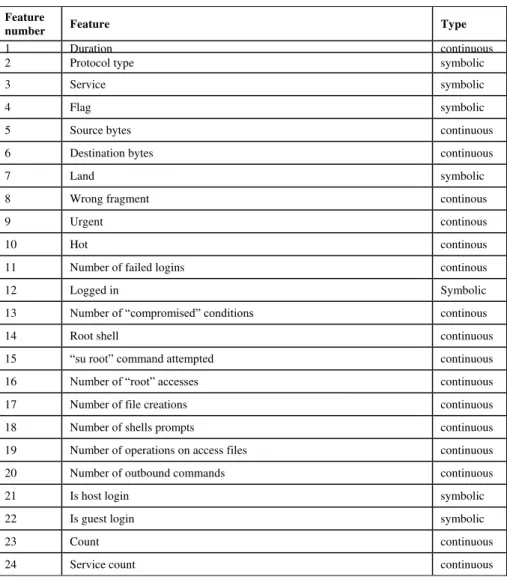
We have applied the HVS method described above, in a case study, to the KDD 99 intrusion detection benchmark [3]. This database originated from the 1998 DARPA Intrusion Detection Evaluation Program that was prepared and managed by MIT Lincoln Labs. The objective was to assess and evaluate research in intrusion detection [4]. Lincoln Laboratories created an environment to acquire TCPdump data in a local area network (LAN) simulating a typical U.S. Air Force network hit by multiple attacks over nine weeks. The training data set collected during the first 7 weeks occupied reached about five million connection records, presenting 23 different attack types, whereas the test data obtained during the last two weeks accounted for around two million connection records, with 18 additional attack types. The dataset was then summarized into network connections with 41 features per connection (Table 1). In order to measure the relevance of these features, we constructed a NN with a single output that distinguishes between normal traffic and attacks. The learning database that we used to train the NN consists of a 1% random extraction (4,940 samples) from the original KDD learning set (containing 494,021 connection records). A learning database with such a size is sufficient to achieve an accuracy rate of 92% on the KDD test set (composed of 311029 independent connection records).
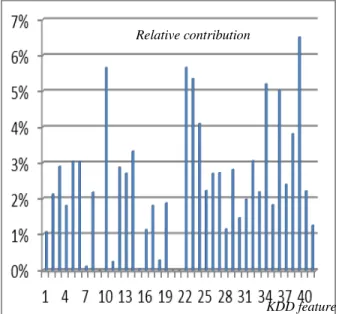
Fig. 1 depicts the obtained results, after applying the HVS method following (1) and (2). Features # 20 and 21 take a null contribution because they are constant in the whole KDD
which are almost constant. In fact, more than 99.999% of the KDD learning set connection records contain a null value for these two features. Features 7, 11 and 18 could also be excluded from the learning database since their contribution is remarkably little; while the most significant features are # 10, 22, 23, 34, 36, 39.
Fig. 1. Relative contribution of each of the KDD 41 features to the detection of attacks (distinction between normal traffic and attacks of various types)
2) Checking the consistence of the method
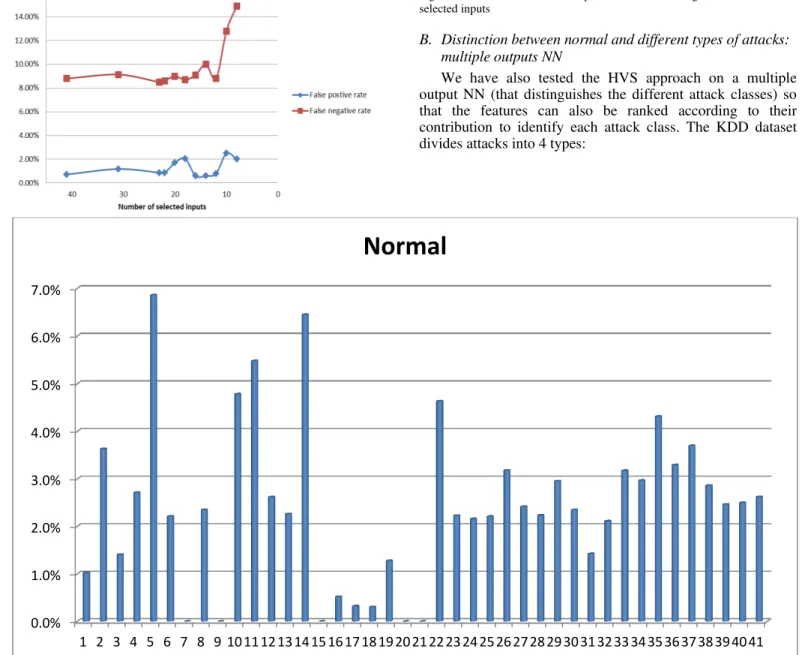
In order to verify the consistence of the results, we selected a set of most significant features (calculated as in the section above) to be set as inputs of the classification NN, and compared the results with those obtained with the full set of inputs. Figure 2 shows these results after applying the networks to the testing databases. We note that we can keep only the most influential 12 features (out of 41), without significantly deteriorating neither the overall accuracy rate (Figure 2) nor the false positive and false negative rates (FPR and FNR, Figure 3). With only 9 features, we still obtain a relatively small FNR (2%), while the FPR reaches 15%.
Fig. 2. Evolution of the overall accuracy rate according to the number of Contribution(neuron_i, layer_j)
// neuron_i belongs to layer_j
If layer_j=number_of_layers then return 1; // Output layer
C=0
For k=1 to number_neurons(layer_i+1)
// Layers are numbered ascendingly from input to output
C = C + weight(neuron_i, neuron_k) / sum_weights(layer_i, neuron_k) *Contribution(neuron_k, layer_i+1)
End
Return C
End
Relative contribution
Fig. 3. Evolution of the false postive rate according to the number of selected inputs
B. Distinction between normal and different types of attacks: multiple outputs NN
We have also tested the HVS approach on a multiple output NN (that distinguishes the different attack classes) so that the features can also be ranked according to their contribution to identify each attack class. The KDD dataset divides attacks into 4 types:
0.0% 1.0% 2.0% 3.0% 4.0% 5.0% 6.0% 7.0%
1 2 3 4 5 6 7 8 9 10 11 12 13 14 15 16 17 18 19 20 21 22 23 24 25 26 27 28 29 30 31 32 33 34 35 36 37 38 39 40 41
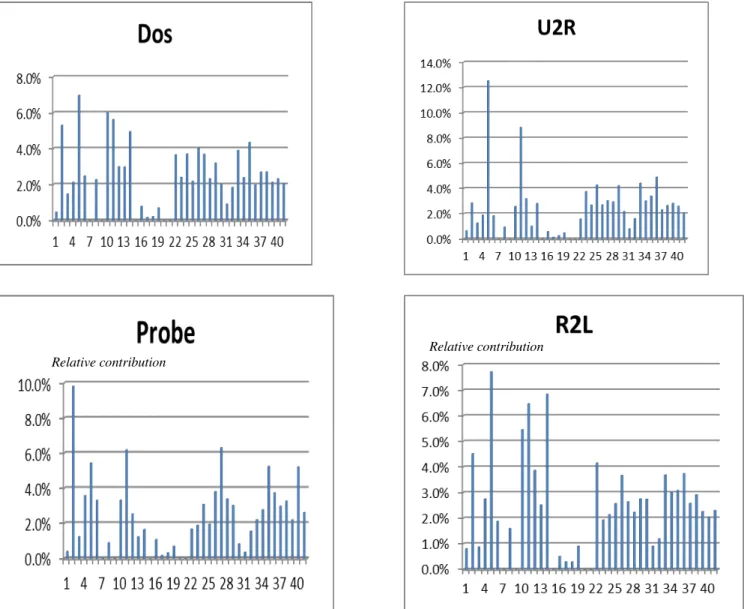
Fig. 4. Relative contribution of each of the KDD 41 features to the detection of normal traffic and different classes of attacks
1) Probe: any attempt to gather information about a network of computers for the purpose of circumventing its security controls.
2) DOS (Denial Of Service): causing computing or memory resources to be too busy to handle legitimate requests.
3) U2R (User to Root): unauthorized access to local superuser (root) privileges, by exploiting some vulnerability.
4) R2L (Remote to Local): unauthorized access from a remote machine, to gain local access as a user of that machine. We constructed a classification NN with 5 outputs, each one corresponding to a class of traffic (normal traffic plus the four above mentioned types of attacks). Figure 4 illustrate the relative contribution of each of the KDD features to the detection of each of the five traffic classes. Some features,
such as „source bytes‟ (# 5) are important for all classes, while
others are specific to one class (#14 for normal traffic, #2 for Probe, #10 for DOS, #11 for U2R, #14 for R2L). Unsurprisingly, constants features (#9, 15, 20, 21) take a null
traffic) shows some differences compared to Fig. 1 due to the fact that in one case we have a 2-class classification problem, and in the other, we have a 5-class problem.
C. Advantages of the method
The results shown above are consistent with those obtained by [5] and [6]. The latter used a totally different method which consists in deleting one of the features and measuring its impact on the result, using either a Neural Network or an SVM classifier. Such a technique is known as a wrapper model [7]. Compared to this approach, the method we have presented above shows several advantages:
The deletion-based method needs to run as many trainings as the number of features, each time deleting one of the features while the HVS method ranks all the features after a unique training, and does not imply any complicated computation, which makes it more suitable for a lightweight IDS.
The HVS method tends to be more accurate in selecting relevant features than the method used by [6] as explained in section III.A.2.
The HVS method distinguishes well between features than the SVM based feature ranking used by [6] which yields remarkably close accuracy results for most of the features, with so slight variations that they could be of random origin.
The HVS method reveals to be more precise in detecting irrelevant features than the method presented in [6]. For example, while features 20 and 21 are constant in the whole KDD learning dataset (as previously noticed by [5]), and features 9 and 15 almost constant and they were not detected as the least important features in [6].
On the other hand, in term of consistence of HVS method, we note that we can keep only the most important 12 features (out of 41), without significantly deteriorating neither the overall accuracy rate (Figure 2) nor the false positive and false negative rates (Figure 3). This number of features is close to the one retained by [10] (11 features) using rough sets and genetic algorithms. [6] conducted a similar test but showed a significant deterioration when selecting the most important 34 features (the overall accuracy rate decreased from 87% to 81% and the false positive rate increased from 6.7% to 18%). This tends to prove that the selection feature method proposed here is considerably more accurate than other cited methods. It should be also noticed that these latter results shown by [6] are not consistent with the Figures they obtained during the feature ranking since the deletion of only one feature (#10 or #35) decreased the accuracy of their network to less than 55%. They did not precise on which database they tested their result. Intuitively, the results they gave for the SVM classification suggests that they tested on only a part of the KDD training dataset (so with a very close distribution to that of the learning database) while we tested on the independent
KDD testing dataset (which an entirely different distribution of attacks, and containing new attack types), which is more realistic. Obviously, testing on the training data set yields an artificially high performance.
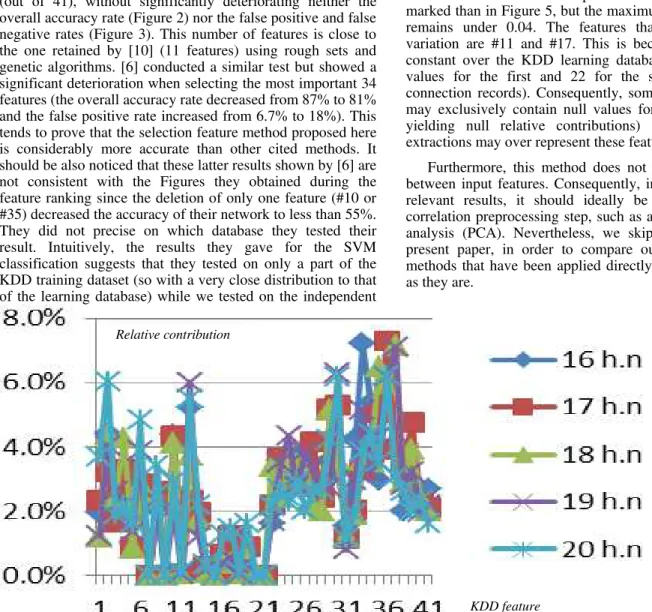
Furthermore, the contributions of the inputs, calculated using the HVS method, are largely independent of the network architecture, as shown in Figure 5. This Figure depicts the result of use of the HVS method to five networks with different internal architectures. The five tests show very close results. Nevertheless, this stands only if the number of hidden neurons is sufficient to resolve the classification problem. D. Limitations
While the HVS method is lowly dependent on the
network‟s architecture, it depends more on the composition
and the size of the learning dataset. We have tested it on different learning databases randomly extracted (with a fixed size) from the original KDD learning set. Figure 6 shows the result of this test. The dependence is significantly more marked than in Figure 5, but the maximum standard deviation remains under 0.04. The features that present the larger variation are #11 and #17. This is because they are nearly constant over the KDD learning database (only 63 nonzero values for the first and 22 for the second over 494,021 connection records). Consequently, some random extractions may exclusively contain null values for these features (thus yielding null relative contributions) while other random extractions may over represent these features.
Furthermore, this method does not deal with correlation between input features. Consequently, in order to yield more relevant results, it should ideally be applied after a de-correlation preprocessing step, such as a principal component analysis (PCA). Nevertheless, we skipped this step in the present paper, in order to compare our results to existing methods that have been applied directly to the KDD features as they are.
Fig. 5. Relative contribution of each of the KDD 41 features to the detection of normal traffic, calculated for five different networks (with a number of hidden neuron varying from 16 to 20)
Fig. 6. Relative contribution of each of the KDD 41 features to the detection of normal traffic, calculated for five different randomly extracted learning databases of the same size
TABLE I. LIST OF KDD FEATURES WITH THEIR DATA TYPES
Feature
number Feature Type
1 Duration continuous
2 Protocol type symbolic
3 Service symbolic
4 Flag symbolic
5 Source bytes continuous
6 Destination bytes continuous
7 Land symbolic
8 Wrong fragment continous
9 Urgent continous
10 Hot continous
11 Number of failed logins continous
12 Logged in Symbolic
13 Number of “compromised” conditions continous
14 Root shell continuous
15 “su root” command attempted continuous 16 Number of “root” accesses continuous
17 Number of file creations continuous
18 Number of shells prompts continuous
19 Number of operations on access files continuous
20 Number of outbound commands continuous
21 Is host login symbolic
22 Is guest login symbolic
23 Count continuous
24 Service count continuous
25 Syn error rate continuous
26 Service Syn error rate continuous
27 Rej error rate continuous
28 Service Rej error rate continuous
29 Same service rate continuous
30 Different service rate continuous
31 Service different host rate continuous
32 Same destination host count continuous
33 Same destination host and service count continuous
34 Same destination host and service rate continuous
35 Different services on current host continuous
36 Connec. to current host with same src port continuous
37 Connec. to same service from diff. hosts continuous
38 Connec. to current host with an S0 error continuous
39 Connec. to current host and specified service that have an S0 error continuous
40 Connec. to the current host with RST error continous
41 Connec. to the current host and specified service with RST error continous
IV. RELATED WORKS
There exists other feature selection methods also based on neural networks, theoretically described in [8], which we should consider and compare in future works, in the context of intrusion detection. The one we used is the simplest to calculate. In fact, feature selection techniques that use complex calculations are inefficient for large scale data.
Besides, several recent papers presented various feature selection techniques applied to the KDD features. Reference [9] proposed a hybrid approach combining the information gain ratio (IGR) and the k-means classifier. Reference [10] proposed a feature selection method based on Rough Sets, improved Genetic Algorithms and clustering. Then they used the SVM classifier for performance evaluation on the KDD database. Reference [11] proposed a clustering-based classifier selection method. The method selects the best classifier on similar clusters, compares it with the best classifier on the nearest cluster and chooses the better one to make the system decision. It showed better results than the Clustering and Selection (CS) method. Reference [12] constructed binary classifiers at local sensors to distinguish each class from the rest. The authors used both a synthetic and the KDD99 datasets to confirm the improved performance of the pairwise feature subset selection algorithm for multiclass classification problems. This approach could be also applied to the method we used in this article by constructing five single-output neural networks for each of the traffic data five classes. Reference [12], however, did not include U2R and R2L attacks in the experiments, due to their extremely small amount in the database. This is the most challenging aspect of
the KDD contest, and it should not be discarded. Reference [13] applied Artificial Bee Colony algorithm (ABC) to determine free parameters of support vector machine (SVM) and to achieve the optimum feature selection for IDSs from KDD Cup 99 data set. Reference [14] used Logistic Regression which is similar to SVM, and found it to be superior to traditional feature selection techniques such as Discriminant Analysis and PCA, after an evaluation on the KDD dataset. Reference [15] also evaluated the performance of standard feature selection methods; CFS (Correlation-based Feature Selection), IG (Information Gain) and GR (Gain Ratio), but on the enhanced NSL-KDD dataset [16] which has been suggested to solve some of the inherent problems of the KDD99 data set. Although, the NSL-KDD dataset still suffers from some of the problems pointed out by [17]. Finally, [18] compared various techniques of feature selection and feature reduction on the Kyoto 2006+ dataset, which is more recent than KDD but which contains a reduced set of features.
V. CONCLUSION AND FUTURE WORK
We have shown that the HVS method we presented in this work can be directly and efficiently applied to the problem of intrusion detection, in order to assess the most important features that contribute to attack detection. We could then select a set of most relevant features to accelerate the detection process, and construct an IDS with higher performance in terms of accuracy and execution time. The attribute-selection algorithm can therefore be applied as a pre-processing technique for classification. An important advantage of the approach, compared to existing methods (like [10] or [13] for example), is that the same technique (feed-forward neural networks) can be used for both feature selection and attack detection, which gives more consistency to the method. Furthermore, the method is almost independent of the used
networks‟ architecture. Further rigorous tests should be
conducted to measure accurately the dependence of the HVS method to the learning database, with databases of different sizes. This dependence should not be an obstacle, however, since, in most applications, the learning database is set once for all.
ACKNOWLEDGMENT
This work is a partial result of a research project supported by grant number INF 36-8-08 from King Abdul Aziz City for Sciences and Technology (KACST), Riyadh, Kingdom of Saudi Arabia.
REFERENCES
[1] P.M. Wong, T.D. Gedeon, and I.J. Taggart, “An Improved Technique in
Porosity Prediction: A Neural Network Approach,” IEEE Transactions
on Geoscience and Remote Sensing, vol. 33(4), 971-980, 1995. [2] M. Yacoub and Y. Bennani, “HVS: A Heuristic for Variable Selection in
Multilayer Artificial Neural Network Classifier”, International
Conference on Artificial Neural Networks and Intelligent Engineering, ANNIE '97, Missouri, USA, 1997, pp. 527-532.
[3] The 1998 intrusion detection off-line evaluation plan. MIT Lincoln Lab., Information Systems Technology Group. http://www.11.mit.edu/IST/ideval/docs/1998/id98-eval-11.txt, 25 March 1998.
[4] Knowledge discovery in databases DARPA archive. TaskDescription. http://www.kdd.ics.uci.edu/databases/kddcup99/task.html
[5] H. G. Kayacik, A. N. Zincir-Heywood, and M. I. Heywood, “Selecting Features for Intrusion Detection: A Feature Relevance Analysis on KDD
99 Intrusion Detection Datasets,” Proceedings of the Third Annual Conference on Privacy, Security and Trust, St. Andrews, Canada, October 2005.
[6] S. Mukkamala and A. H. Sung, “Identifying Significant Features for Network Forensic Analysis Using Artificial Intelligence Techniques”. In the International Journal on Digital Evidence, vol. 1(4), 2003.
[7] H. Liu, and Y. Lei, “Toward integrating feature selection algorithms for
classification and clustering,” Knowledge and Data Engineering, IEEE Transactions on 17.4 (2005): 491-502.
[8] P. Leray and P. Gallinari, “Feature selection with neural networks,” Behaviormetrika, vol. 26(1), pp. 145–166, 1999.
[9] Ara jo, N.; de Oliveira, R.; Ferreira, E.-W.; Shinoda, A.A.; Bhargava, B.; , "Identifying important characteristics in the KDD99 intrusion detection dataset by feature selection using a hybrid approach," Telecommunications (ICT), 2010 IEEE 17th International Conference on, vol., no., pp.552-558, 4-7 April 2010.
[10] Y. Guo; B. Wang; X. Zhao; X. Xie; L. Lin, and Q. Zhou; , "Feature selection based on Rough set and modified genetic algorithm for intrusion detection," Computer Science and Education (ICCSE), 2010 5th International Conference on, vol., no., pp.1441-1446, 24-27 Aug. 2010.
[11] A. Mi and L. Hai, “A clustering-based classifier selection method for
network intrusion detection,” Computer Science and Education (ICCSE), 2010 5th International Conference on, vol., no., pp.1001-1004, 24-27 Aug. 2010.
[12] H. D. Nguyen and Q. Cheng, “An efficient feature selection method for distributed cyber attack detection and classification,” Information Sciences and Systems (CISS), 2011 45th Annual Conference on, vol., no., pp.1-6, 23-25 March 2011.
[13] J. Wang, T. Li, and R. Ren, “A real time IDSs based on artificial Bee Colony-support vector machine algorithm,” Advanced Computational Intelligence (IWACI), 2010 Third International Workshop on, vol., no., pp.91-96, 25-27 Aug. 2010.
[14] M. F. Wu, “Protocol-based classification for intrusion
detection”, WSEAS International Conference. Proceedings. Mathematics and Computers in Science and Engineering. Eds. Qing Li, S. Y. Chen, and Anping Xu. No. 7. World Scientific and Engineering Academy and Society, 2008.
[15] H. S Chae, B. O. Jo, S. H. Choi, and T. K. Park, “Feature Selection for Intrusion Detection using NSL-KDD,” Recent Advances in Computer Science, 2013, 184-187.
[16] M. Tavallaee, E. Bagheri, W. Lu, and A. Ghorbani, A detailed analysis of the KDD CUP 99 data set, 2009 IEEE Int. Conf. Comput. Intell. Security Defense Appl., 2009, pp. 53–58.
[17] J. McHugh, “Testing intrusion detection systems: a critique of the 1998 and 1999 darpa intrusion detection system evaluations as performed by
lincoln laboratory,” ACM Transactions on Information and System Security, vol. 3, no. 4, 2000, pp. 262–294.
[18] A. Ammar, “Comparison of Feature Reduction Techniques for the
Binominal Classification of Network Traffic”, Journal of Data Analysis