Quality changes during thermal processing of two
mixed formulas of fruits and vegetables pulps
Elsa M. Gonçalves1,2*, Isa Raposo1, Joaquina Pinheiro3, Carla Alegria4, Margarida Moldão5 Marta Abreu1,5
1UTI - Unidade de Tecnologia e Inovação, Instituto Nacional de Investigação Veterinária e Agrária, 2780-157 Oeiras, Portugal,
2GeoBiotec - GeoBioTec Research Institute, Universidade Nova de Lisboa, Campus de Caparica, 2829-516 Caparica, Portugal, 3
MARE-Marine and Environmental Sciences Centre, ESTM, Instituto Politécnico de Leiria, 2520-630 Peniche, Portugal., 4cE3c - Centre for Ecology,
Evolution and Environmental Changes, Faculdade de Ciências, Universidade de Lisboa, 1749-016 Lisboa, Portugal, 5LEAF - Linking
Landscape, Environment, Agriculture and Food, Instituto Superior de Agronomia, Universidade de Lisboa, 1349-017 Lisboa, Portugal
INTRODUCTION
Health promotion has been of increasing importance for consumer food choice for the last years, and today’s analyses of consumer food quality perception indicates that health and sensory considerations have about equal weight (Grunert, 2002). Fruit and vegetables (F&V) are naturally associated with healthy eating habits and good fresh taste. They are considered functional foods because of respective ability to potentiate the body’s defenses, preventing or treating more serious diseases such as lowering the risk of developing chronic diseases
(e.g. coronary heart disease, heart disease) and cancer
(Simões, 2010; Tokuşoğlu and Hall III, 2011). In addition
to the basic nutrients, antioxidants are ubiquitous to F&V namely bioactive compounds (phenolic compounds, carotenoids, ascorbic acid) and play an important role in maintaining human health (Cozzolino and Angelis, 2004; Hassimotto et al., 2009).
Fruits and vegetables structures are naturally different from each other and also differ greatly in terms of chemical composition. However, their composition is strongly influenced by factors such as variety, maturity, genetics and edaphic-climatic conditions (Melo et al., 2008). Fresh F&V are extremely perishable produce that can easily spoil or deteriorate during postharvest handling procedures up to the final consumer. Fruit and vegetable
http://www.ejfa.me/
A B S T R A C T
The present work aimed to evaluate, through thermal degradation kinetics (80 °C to 98 °C in time intervals of 0.5 to 25 min), the effects of different thermal treatments on the biochemical, physicochemical, sensory and microbiological parameters of two mixed fruit and vegetable pulps, a yellow and a red one. The evaluated fruit and vegetable pulps resulted from the mixture of different fruits and vegetables proportions (pineapple, beetroot, strawberry and lemon juice) added to a 50% (p/p) pear-based pulp to maximize their bioactivity, physicochemical stability and sensorial acceptance. Evaluated quality parameters included the determination of peroxidase activity (POD), pH, soluble solids content (SSC), total phenolic content (TPC), CIELab colour, sensory evaluation (colour, taste and aroma) and total mesophilic aerobic counts (TAPC). Regarding heat treatments optimization for both pulps with lower pH, it was concluded that higher temperature treatments (90 to 98 °C) applied over a shorter time (less than 5 min) were more effective to inactivate POD, to reduce the initial microbial load (>2 log10 cycles) and to maximize sensorial attributes. In both mix pulps, total phenolic content (TPC) was not significantly influenced by the different applied time-temperature binomials. From the degradation kinetic models and as an example, it was possible to conclude that POD followed a 1st order kinetic, where the temperature effect was well fitted to the Arrhenius equation. The results allowed to obtain optimized time-temperature binomials for each pulp to simultaneously achieve POD enzyme inactivation, microbial reduction, and maximization of quality parameters relatively to fresh pulps, 90 °C/5 min and 98 °C/2.5 min, for the yellow pulp and red pulp, respectively.
Keywords: Fruit and vegetable pulps; Heat treatments; Kinetics; peroxidase; Colour; Sensorial evaluation
*Corresponding author:
Elsa M. Gonçalves, UTI - Unidade de Tecnologia e Inovação, Instituto Nacional de Investigação Veterinária e Agrária, 2780-157 Oeiras, Portugal, GeoBiotec - GeoBioTec Research Institute, Universidade Nova de Lisboa, Campus de Caparica, 2829-516 Caparica, Portugal. E-mail: [email protected]
Received: 29 December 2019; Accepted: 14 March 2020
R E S E A R C H A R T I C L E
pulps are nutritionally balanced products and are the result of the quality of the products that originated them. Notwithstanding, the bioactive value of pulps can be increased as a result of mixing different product to produce the pulps. The growing industrial interest in F&V pulps is that they accomplish the challenge brought by the consumers: high nutritional and appealing products, while preventing food waste, as well as, enjoying seasonal fruits by ensuring the availability of these products in the market during periods of low production. Pulps could be produced maintaining original products quality into added value storable products, chemical free, appealing and with increased shelf-life. Thus, a worldwide trend of increasing the marketing of this type of products is expected, at a growth rate similar to that of the fruit juice market (Kortbech-Olesen, 1997). Nevertheless, fresh pulps quality is rapidly lost due to different mechanisms. For example, the degradation of sensory quality (changes in colour, taste, aroma and characteristic texture) and nutritional value usually results from enzymatic reactions, physicochemical modifications and microbiological development (Dias, 2011). Thus, some preservation methodologies have been used to increase product durability, preventing microbial growth and slowing down quality degradation reactions. The process chosen depends upon pH, microbial load, and desired shelf-life (Braddock, 1999).
Thermal treatments are still used by most of the fruit juice/pulp processing industries due to their simplicity and efficiency. Thermal processing, such as pasteurization, involves heating of a food product at a temperature that ranges from 50 to 100 °C primarily to inactivate microorganisms and endogenous enzymes. However, the intensity of the heat treatment may lead to undesirable changes in product characteristics such as loss of flavour and aroma compounds, thermal degradation of heat-sensitive nutrients (e.g. vitamins) and colour changes
resulting from loss of pigments or non-enzymatic browning (possible caramelization) (Freire et al., 2009; Zou et al., 2012). Therefore, the optimization of a product’s quality requires control over inactivation of enzymes and maximizing nutritional components and sensorial characteristics.
The present work aims to understand the effect of heat on inactivation kinetics of quality deteriorating enzyme, peroxidase (POD), in two mixed fruit and vegetables pulps, different in colour (Yellow and Red). Further, the effect of these thermal treatments on the reduction of the microbial load, and also the retention of critical quality properties, i.e. total phenolic content, colour and sensorial characteristics in both pulps, was investigated.
MATERIALS AND METHODS
The fruits and vegetables (F&V) used for the experimental development of these studies were provided by CAMPOTEC, SA, namely Rocha pear (Pyrus communis L.),
pineapple (Ananas sativus), strawberry (Fragaria ananassa),
beetroot (Beta vulgaris) and lemon (Citrus limonum).
Upon reception at the laboratory, F&V were selected to eliminate defective units (visible damage and/or very advanced ripening conditions), rinsed briefly under running tap water, disinfected in a chlorine solution (150 ppm) for 5 min, dried with absorbent paper and then kept under refrigerated conditions (5 ± 1 °C, Fitoclima chamber model S 600 Pharma) until processing (maximum 24 h).
Pineapples, pears and beetroots were manually peeled and cut while other F&V were only cut. The Yellow (YP) and Red (RP) pulps were constituted by direct weighing the F&V in the homogenization cup, followed by a 3 min homogenization/grinding (Robot Termomix). YP pulp formulation was a mixture of pear and pineapple (50:50, w: w) and the RP pulp a mixture of pear, strawberry, beetroot and lemon juice (66:30:4:1.5, w: w:w: v). The obtained pulp (1 kg each, in triplicate) was packed in 100 g portions in properly identified food-grade plastic bags (5 cm x 7 cm) and heat-sealed (Tish-400 impulse sealer, Tew Electric Heating Equipment Co, Ltd., Taipei, Taiwan). Samples were then placed under refrigeration conditions (5 °C, Refriger, Electro-refrigeration, Portugal), until carrying out the studies of thermal treatment optimization. After processing, fresh pulps (untreated) were characterized regarding centesimal composition: water content (moisture; NP-1614, 2009), total fat content (NP-1613, 1979), proteins (NP-1612, 2006), total carbohydrates (NP-1419, 1987), fibre (EN-ISO 6865, 2000) and ash (NP-1615, 2002). Moisture content was determined in a vacuum oven at 105 ˚C.
Thermal treatment optimization
The yellow (YP) and red pulp (RP) samples was thermal treated as shown in Fig. 1. Samples were placed in a thermostated water bath (± 1 °C; HAAKE B, Sotel, 50 L) with continuous stirring at the desired temperature in the range of 80 to 98 °C. During the heat treatments, the bath temperature was continuously monitored using thermocouples (type T, Ellab) located in different parts of the bath (centre and close to the walls). Depending on the set temperature, samples were taken after the desired time (not in sequence), up to a maximum of 25 min. After the heat treatment, samples were cooled in an ice-cold water bath and placed under refrigeration (5 ± 1 °C, Fitoclima chamber model S 600 Pharma) until further analysis. Each experiment was replicated twice. A representative sample of both untreated pulps was used as a reference.
Determination of pH and soluble solids content
The pH value was measured in the pulp by potentiometry (Crison Micro pH 2001, Crison instruments, Spain). Soluble solids content (SSC, %) was determined in the juice obtained directly from pulp filtration using an ATAGO DDR-A1 refractometer. Mean values result from the average of three (3) determinations per sample.
Determination of peroxidase enzymatic activity (POD)
Peroxidase (POD) activity was determined according to Bifani et al. (2002), with some modifications. Extraction (1:3, w: v) was carried out using 1.5 M NaCl in 0.1 M phosphate buffer (pH 7) and the clear supernatant used as crude extract. POD activity was determined spectrophotometrically (ATI Unicam UV/VIS 4 spectrophotometer) from the rate of H2O2 decomposition with guaiacol serving as hydrogen donor at pH 6.5 (0.1 M phosphate buffer). One unit of POD activity was defined as an increase in absorbance of 1.0 at 470 nm per min per mL enzyme crude extract. The analyses were carried out in duplicate on each sample replicate.
Determination of total phenolic compounds
For each sample replicate, a methanolic extract was obtained (1:4, w: v, 100% methanol) and the total phenolic content (TPC) determined according to Swain and Hillis (1959), using the Folin-Ciocalteu reagent. Results were expressed as mg chlorogenic acid equivalents per 100 g of pulp (mg CAE.100 g-1) using a chlorogenic acid (0 – 350 mg.L-1)
standard curve.
Determination of CIE Lab colour
The colour parameters were determined using a colourimeter (Minolta Chroma Meter CR 300, Osaka, Japan) by measuring the CIE L*a*b* parameters (C illuminant). To describe the colour behaviour of the pulps during thermal treatments the colour hue angle, °h (0-360°) (obtained by tan-1 b*/a*, expressing the characteristic/dominant colour) and total colour difference (TCD) (Eq 1) were used. Data were obtained from 10 measurements on each sample in duplicate. TCD=
(
L*−L*0)
2+(
a*−a*0) (
2+ b*−b*0)
2 Eq. 1Sensorial assessment
For sensory evaluation, a quantitative descriptive analysis was used according to Van Loey et al. (1994).
Determination of the total mesophilic aerobic counts
Total mesophilic aerobic count (TAPC) was performed according to ISO 4833-1. Microbial counts were expressed as log10 (cfu g−1). For assessment of microbial load
reduction as a result of thermal treatments, mean counts for each treatment were subtracted from the mean counts of the untreated controls to give an average Log10 reduction in initial contamination.
Data analysis
An analysis of variance (one-way ANOVA with replication) was performed to assess the thermal treatments time-temperature conditions effects on the quality parameters. Rate constants of both pulps POD inactivation, colour parameters and sensorial analysis were estimated by nonlinear regression analysis, fitting first-order or fractional conversion kinetic models, eqs 2 and 3 (depending on the parameter considered), to isothermal experimental data.
= 0 −( )T k t C C e Eq. 2 − − = − ( ) 0 T k t eq eq C C e C C Eq. 3
In the previous equations, C is the evaluated parameter, the sub index 0 indicates the initial value, eq equilibrium value, t is the heating time, and k is the rate constant at temperature T. The temperature effect on rate constants was described by the Arrhenius equation (Eq. 4):
( ) = − − 1 1 exp ref T ref Ea k k R T T Eq. 4
Where k is the reaction rate constant, kref is the reaction rate constant at a finite reference temperature (Tref), Ea is the activation energy, R is the universal gas constant, and
Fig 1. Flow diagram of thermal treatment applied to yellow (YP) and red pulp (RP).
T is the absolute temperature. The reference temperature used was the average value of the range considered (i.e. Tref = 90 °C), aiming at improving parameters estimation. The k90°C and the activation energy were estimated directly from experimental data in one step (quality factor vs time, at all temperatures), by performing a global nonlinear regression analysis, merging the Arrhenius equation and the kinetic model considered (Rizvi and Tong, 1997; Ryan-Stoneham Stoneham and Tong, 2000; Vu et al., 2004; Gonçalves et al., 2007). The parameters’ precision was evaluated by confidence intervals at 95%, and the quality of the regression was assessed by the coefficient of determination (R2) and randomness and normality of
residuals (Hill and Grieger-Block, 1980; Arabshahi and Lund, 1985) thus allowing best fit model parameters. Statistica version 8.0 software was used for all regression analysis procedures (using least-squares estimation and Levenverg-Marquart method, for minimizing the sum of squares of the deviations between the experimental values and the ones predicted by the mathematical model).
RESULTS AND DISCUSSION
Fresh Pulps
It can be observed in Table 1 that both pulps could be considered acid product due to respective pH values (pH < 4.5). The low pH values are very helpful to the preservation strategy of the pulps, inhibiting microorganisms’ development and extending shelf-life. Still, according to the centesimal composition performed (Table 1), it is possible to verify that, as expected, both pulps have high moisture contents as well as the absence of protein and lipid contents. These results are justified by the fact that the F&V constituents of both pulps have low expression of some nutrients such as proteins and lipids. The total carbohydrates are responsible for the energy value of the pulps under study, being higher in the yellow pulp comparing with the red pulp, 49 and 41 kcal/100 g, respectively. Also, the POD initial activity is higher in the yellow pulp (18 vs. 8 U/ml, YP vs. RP, respectively). However, the total phenolic
content is much higher (≈ 93%) in the red pulp than in the yellow, probably due the presence of beetroot.
Thermal treatments optimization
pH and soluble solids content
The pH of the fresh yellow and red pulps was of 4.0 and 3.8 (Table 1), respectively. From the data analysis, it was found that the applied thermal treatments did not statistically affected pH (variation of ±0.02 units) (p > 0.05). The non-significant effect might be related to the fact that both temperature and time conditions were not severe enough to cause the release of H+ ions from the pulps and, therefore,
the pH remained nearly constant after thermal processing (Chakraborty et al., 2014). Similar behavior occurs with the pulp’s SSC values. The SSC of the fresh pulps was 13.4 ±0.12 % (YP) and 10.4 ±0.2 % (RP). After thermal
Fig 2. POD enzyme activity inhibition for: A) yellow pulp (YP) and B) red pulp (RP). The lines represent model fit to experimental data.
A B
Table 1: Quality analysis of the two fresh fruit and vegetable pulp (yellow and red)
Parameters Yellow pulp (YP) Red pulp (RD) Moisture content (%) 87.0±0.01 88.5±0.03 Total lipids (%) 0.00 0.00 Protein (%) 0.00 0.00 Total carbohydrates 12.14±0.23 10.27±0.18 Reducing sugars (%) 4.12±0.11 5.80±0.15 Sucrose (%) 7.94±0.30 4.47±0.21 Fibre (%) 0.63±0.01 0.81±0.02 Ash (%) 0.26±0.02 0.43±0.02 Energy value (kcal/100 g) 49 41 (kJ/100 g) 204 172 pH 4.0±0.02 3.8±0.00 SSC (%) 13.4±0.12 10.4±0.2
Total phenolic content (TPC,
mg CAE.100 g-1) 116.3±5.6 225.1±4.9 POD (U/ml) 18.1±1.5 7.6±0.7 CIELab Colour L* a* b* 67.1±0.7 -5.2±0.1 27.2±0.6 29.3±1.5 30.4±1.1 6.4±0.5 Total Aerobic Plate Counts
treatments, no significant changes (p > 0.05) were observed in samples SSC (YP; 13.2 ±0.3 % and RP; 10.7 ±0.4 %).
Enzyme peroxidase activity
The peroxidase enzyme (POD) belongs to the group of oxidoreductase enzymes and is usually associated with oxidative degradation reactions in fruits and vegetables (F&V). Peroxidase can cause undesirable changes in aroma, taste, colour and texture and is associated with loss of nutritional quality of food (Vámos-Vigyázó, 1981). In most F&V, POD is the most heat resistant enzyme (Zou et al., 2012) and, consequently, its inactivation is considered an appropriate indicator of the effectiveness of thermal treatments as it further indicates the loss of activity of other spoilage enzymes that may be present in a product (Zanatta et al., 2006).
The mean values (± SD) of initial peroxidase enzyme activity for yellow pulp (Y) and red pulp (RP) are 18.1 ± 1.5 and 7.6 ± 0.7 U/ml, respectively. Fig. 2 shows the POD enzyme activity inhibition (%) as a function of time for the different tested temperatures in both pulps. Values were normalized to the initial activity of the fresh product. Peroxidase inactivation was found to be significantly affected (p <0.05) by the time and the temperature of the heat treatment. For YP, the residual activity of the POD enzyme at 80 °C/25 min was about 5% (Fig. 2A). In RP, the residual activity, for the same time-temperature binomial, was about 20% (Fig. 2B), which indicates a higher POD thermal resistance in the later pulp (RP). On the other hand, at 98 °C and after 10 min of heat treatment, no peroxidase enzyme activity was observed in either pulp.
In the present study, the results obtained for both pulps regarding POD inactivation were satisfactorily described by an
Arrhenius kinetic model - 1st order (Eq. 2, 4). The adjustment
is shown in Fig. 2. The quality of the model was evaluated by residue analysis and the value of R2 was 0.99 for YP and 0.94
for RP. The obtained kinetic parameters and 95% confidence intervals are shown in Table 2. As we can see from the kinetic parameters (Table 2), a lower temperature sensitivity for the POD enzyme was found in the red pulps (RP) (Ea = 53 kJ.mol-1) when compared to the yellow ones (YP)
(69 kJ.mol-1). Regarding the published bibliographic values
for POD in fruits, the determined values are much higher: tomato juice, 556 kJ.mol-1 (Anthon et al., 2002); strawberries,
96.2-74.6 kJ.mol-1 (Chisari et al., 2007); guava, 96 kJ.mol-1
(Ganjloo et al., 2011); strawberry puree, 254 kJ.mol-1 (Terefe
et al., 2010). The enzymatic thermostability and activity can be dependent on origin of enzymes (Marszałek et al., 2017) and on characteristics of the medium, such as soluble solids and sugar contents (Chang et al., 1988; Marshall et al., 1985; Sola-Penna and Meyer-Fernandes, 1998), presence of acids (Liu et al., 2013) and pH (Lu and Whitaker, 1974; Suha et al., 2013). For optimal maintenance of pulp quality during refrigerated or freezing storage period, it is recommended that after heat treatment POD enzyme activity is reduced to about 80% from the initial activity. For heat-treated YP at 80, 85, 90 and 98 °C, this target reduction was obtained, respectively, after 17, 12, 9, and 5 min of treatment. For RP and for the same temperature sequence, the target enzymatic reduction was obtained after 25, 14, 8 and 3 min of heat treatment.
Colour evaluation
F&V pulps colour are one of the main quality parameters taken into account by consumers. With heat process, there is common loss of natural pigments (e.g. carotenoids mainly responsible for the red, orange and yellow colour), often destroyed by the action of heat per si or even by pH changes or oxidation of these compounds. As a result, the Table 2: Kinetic parameters and respective 95% confidence intervals of the quality parameters obtained after the heat treatments of the yellow and red pulps
Pulp Quality parameters (kinetic models) Kinetics parameters
C0 Ceq K90 °C (min-1) Ea (kJ.mol-1)
Yellow POD (Arrhenius 1st order) 98.42±1.68 0.19±0.01 68.72±54.70
Colour
TCD (Arrhenius fractional conversion) 14.98±0.57 0.36±0.04 92.29±14.07 Hue (Arrhenius 1st order) 101.7±0.21 2.57×10⁻³±3.26×10⁻⁴ 56.11±12.57 Sensorial analysis
Colour (Arrhenius 1st order) 8.8±0.14 0.03±3×10⁻³ 90.84±13.43
Taste (Arrhenius 1st order) 9.2±0.14 0.04±3.17×10⁻³ 66.30±10.46
Aroma (Arrhenius 1st order) 8.9±0.15 0.03±3.20×10⁻³ 62.62±12.15
Red POD (Arrhenius 1st order) 7.57±0.28 0.36±0.00 52.88±0.96
Colour
TCD (Arrhenius fractional conversion) 1.11±0.21 6.55±1.23 30.48±53.97* 74.67±21.24 Sensorial analysis
Colour (Arrhenius 1st order) 9.13±0.17 6.22×10⁻³±2×10⁻⁴ 53.10±33.26
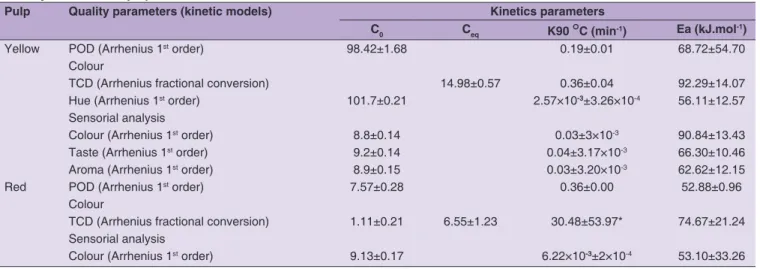
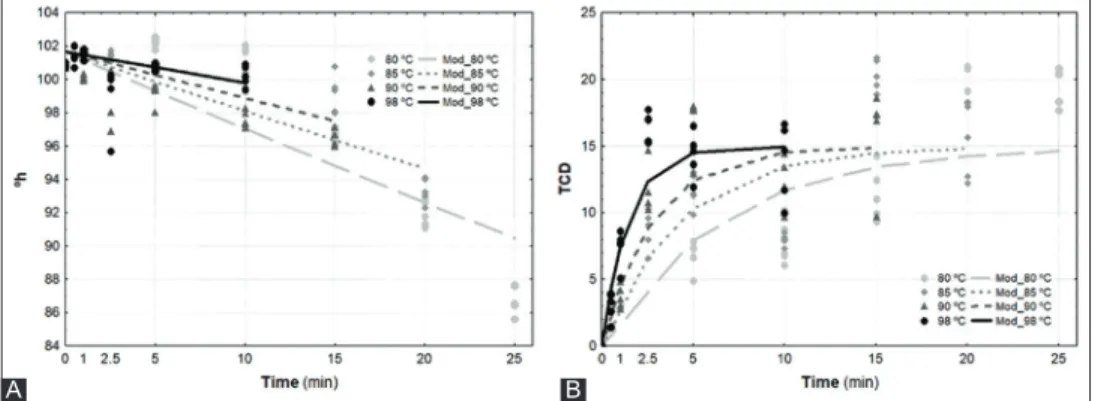
characteristic colour of the pulp can be altered, possibly affecting its commercial value (Fernandes, 2009). The fresh yellow pulp (untreated reference sample for YP) showed a bright yellow colour, as observed at Table 1 corresponding to the following mean values (± SD): L* 67.0 ± 0.7, a* -5.2 ± 0.1, b* 27.2 ± 0.6 and °h 100.8 ± 0.1. The mean values (± SD) of the fresh red pulp colour parameters (untreated reference sample for RP) were as follows: L* 29.3 ± 1.5, a* 30.4 ± 1.1, b* 11.8 ± 0.5 and °h 11.8 ± 0.5. For YP, the values of the parameter °h decreased significantly (p <0.05) with the time and temperature of the heat treatment (Fig. 3A), indicating a yellow-brown effect. It suggests that at higher temperatures (90, 95 and 98 °C), the discoloration occurs due to non-enzymatic browning, through several biochemical reactions which include, but are not limited to, Maillard reaction, pigment destruction and sugar caramelization. Fig. 3B, shows the changes of the colour parameter TCD as a function of the heat treatment intensity for YP. Significant changes in this parameter were observed at all tested temperatures. Thus, for YP under the conditions of TT 80 °C/25 min and 98 °C/10 min the observed mean TCD values were of 20 and 15, respectively. These values correspond, on the Drlange (1994) categorized scale to a Very Large degree of difference from the fresh pulp. For YP, the Arrhenius 1st-order (Eq. 2) and fractional conversion order (Eq. 3) models satisfactorily fit the experimental data °h and TCD, respectively. Table 2 shows the values of the colour kinetic parameters, such as the equilibrium value (Ceq) for the TCD parameter and the estimated values Ea and K. The colour parameters modeled for YP verified the normality and randomness of the residues with satisfactorily high R2 values of 0.86
and 0.85, respectively for °h and TCD. For RP, the first fractional Arrhenius model did satisfactorily fitted the TCD experimental data (R2 = 0.78). The equilibrium value
(Ceq) for the TCD parameter was 6, corresponding on the Drlange (1994) scale to a degree of difference Very Distinct
from the fresh pulp.
Fig 3. Representative graphs of changes in colour parameters °h (A) and TCD (B) for yellow pulp for different thermal kinetics.
A B
Table 2 shows that the YP parameter TCD has an Ea value of 92 kJ.mol-1, much higher than that found for RP, which
was 75 kJ.mol-1. These kinetic values for the TCD colour
parameter are, however, lower than those found for other fruits: 92.8 kJ.mol-1 for grape juice (Rhim et al., 1989), 28.5,
39.6 and 36.0 kJ.mol-1 for, respectively, apple, peach and
plum pulp (Lozano and Ibarz, 1997) and 119.0 kJ.mol-1 peach puree (Ávila and Silva, 1999).
Sensory analysis
The effect of heat treatment on the colour, taste and aroma sensory analyzed for YP is shown in Fig. 4. It is observed that all sensory attributes underwent significant changes (p <0.05) as a result of the heat treatment. The evaluation of the panelists indicated that the YP samples showed noticeable colour, taste and aroma losses compared to untreated samples. Changes in the three sensory parameters in the yellow pulp, followed a first order Arrhenius kinetic model (Eq.2). The estimated activation energy values, the reaction constant (C0) at the reference temperature of 90° C (k90°C) and the corresponding 95% confidence intervals are shown in Table 2. Correlation coefficients (R2) are of
0.92, 0.93 and 0.90 for colour, taste and aroma, respectively. For RP, it was possible to model the results obtained in the colour parameter with a 1st order Arrhenius kinetic model
(R2 = 0.89) and achieved kinetic parameters are shown in
Table 2. Regarding the results for the RP taste and aroma sensory parameters, these were not possible to model because there were no statistical differences between them (p > 0.05). Comparing the Ea of the colour parameter of YP (90.84 kJ.mol-1) with that of RP (53.1 kJ.mol-1), the last
one is much lower, so it can be said that this pulp showed greater sensitivity to temperature. No kinetic values were found in the literature regarding sensory evaluation of fruit products.
Total phenolic content
The mean values (± SD) of the total phenolic content (TPC) for the yellow pulp (YP) and red pulp (RP) pulps without heat treatment (fresh reference samples) were 116.3
different time - temperature binomials on the phenolic content of YP and RP are shown in Fig. 5.
As it can be confirmed in Fig. 5, comparison of the average total phenolic content (TPC) does not reveal significant differences between same colour pulp samples (p > 0.05), regardless of applied heat treatment. Similarly, no TPC differences (p > 0.05) were found when comparing heat-treated samples with unheat-treated samples (fresh) for both pulps. Moreover, since no significant differences (p > 0.05) were found between TPC levels of heat-treated samples, it was not possible to model this response. In literature, few data related with total phenolic content kinetics could be found. However, Kim et al. (2018) reported that the estimated activation energy value for hardy kiwi puree was 29.07 kJ.mol-1 and a higher
value (36.0 ± 8.0 kJ.mol-1) in plum (Prunus domestica) extracts
was reported by Turturica et al. (2018).
Total mesophilic aerobic counts
The total mesophilic aerobic microflora comprises a wide variety of microorganisms and may account for about 105 to 107 cfu.g-1 (Hagenmaier and Baker, 1998). The total
mesophilic aerobic count (TAPC) is a measure of microbial quality of fruit juices (Iqbal, et al. 2015). TAPC found for both untreated pulps (Fresh) and selected heat-treated pulps are shown in (Fig. 6A) for yellow pulp and (Fig. 6B) for red pulp. Contrary to expectations, for untreated pulps, TAPC were higher for yellow pulp (about 4 log10 cycles) than red pulp (about 3 log10 cycles). These results were unexpected since, given that the processing conditions were identical for both pulps, one would expect a higher contamination level in the red pulp considering the origin of some raw materials (e.g. beetroot).
It can also be seen from Fig. 6 that the most effective heat treatment conditions in reducing the microbial load for both pulps were those treated at high temperature. The reduction in number of TAPC endogenous microorganisms in the pulps obtained was statistically significant only for the temperature/time conditions of 90 °C/5 min and 98 °C/5 min. In yellow pulp, 90 °C/5 min reduce the TAPC by 2.2 and in the red pulp by 2 log10 cycles.
To further develop this study, following a hurdle-concept (Leistner, 1999) and for overall preservation strategy for these F&V pulps, where a thermal technology would be combined with low-temperature storage (refrigeration or freezing) for an acid product, is recommended. Considering the results, the best conditions to explore are the time-temperature binomials of 90 °C/5 min for Yellow pulp and Red pulp. Under these circumstances, the peroxidase enzyme inactivation corresponds to about 80 %, the microbial load reduction is ≥ 2 log10 cycle and no significant quality changes occur in the pulps, namely in the
Fig 4. Representative graphs of the model values for the sensory analysis of yellow pulp, in the parameters color (A), taste (B) and aroma (C).
A
B
C
± 5.6 and 224.9 ± 4.9 mg CAE.100 g-1, respectively. It can
easily be verified that red pulp samples have about twice the total phenolic content compared to the yellow pulp samples, possible due to the contribution of the beetroot and the strawberry.
Heat-treated pulp samples total phenolic content (TPC) ranged from 104.9 ± 16.8 to 148.3 ± 9.9 mg CAE.100 g-1 for
YP and from 198.9 ± 17.1 to 248.8 ± 5.9 mg CAE.100 g-1
sensory parameters analyzed, where the pulps have shown to obtain highest sensory acceptability, being described by panelists as fresh, appealing, and very tasty food products.
CONCLUSIONS
Mathematical models that described peroxidase enzyme inactivation, changes in colour parameters °h and TCD, as well as sensory changes promoted by heat treatments were identified. The suitability of kinetic models to experimental data allows predicting quality changes in fruit and vegetable pulps. Inactivation of the peroxidase enzyme for Yellow pulp and Red pulp followed a first order model. The remaining quality parameters evaluated (colour and sensory analysis) were well described by first order or fractional conversion order kinetic models. The Arrhenius model described the dependence of the reaction constant on the temperature of all considered factors. The study revealed by the quality kinetic parameters analyzed for red pulp, that this has a higher temperature sensitivity than the yellow pulp. The total phenolic content of both types of pulps was not affected by the different heat treatments.
Thermal treatments with higher temperature (90 and 98 °C), applied during 5 min, have been shown to be more effective in reducing the microbial load of pulps compared to thermal treatments at lower temperatures (80 and 85 °C) with longer times (10 min). Experimental research to evaluate quality changes of refrigerated and frozen yellow and red fruit and vegetables pulps during storage is presently under study by the authors, while considering the optimized time-temperature binomial conditions of 90 °C/5 min for yellow pulp and red pulp.
ACKNOWLEDGMENTS
The authors express their gratitude to Campotec SA for their support in developing this study, in particular given the raw material needed to produce the pulps. Joaquina Pinheiro acknowledges the financial support from Fundação para a Ciência e Tecnologia (FCT), through the PhD grant (SFRH/BD/24913/2005) and the strategic project UIDB/04292/2020 granted to MARE-Marine and Environmental Sciences Centre, Instituto Politécnico de Leiria and European Regional Development Fund (FEDER), through the Competitiveness and Internationalization Operational Programme (COMPETE 2020) of the Portugal
Fig 5. Total phenolic content (TPC) of Yellow pulp (A) and Red pulp (B) samples submitted to different time - temperature binomials. Fresh - No heat treatment; 80/10 (80 °C/10 min); 80/20 (80 °C/20 min); 85/2.5 (85 °C/2.5 min); 85/20 (85 °C/20 min); 90/2.5 (90 °C/2.5 min); 90/10 (90 °C/10 min); 98/1 (98 °C/1 min); 98/5 (98 °C/5 min). Error bars represent the 95% confidence interval.
A B
Fig 6. Total aerobic plate counts (TAPC) of selected thermal conditions for yellow pulp (A) and red pulp (B). Fresh - No heat treatment; 80/10 (80 °C/10 min); 85/10 (85 °C/10 min); 90/5 (90 °C/5 min); 98/5 (98 °C/5 min). Error bars represent the 95% confidence interval.
2020, Centro2020 “SmartBioR - Smart Valorization of Endogenous Marine Biological Resources Under a Changing Climate” (Centro-01-0145-FEDER-000018). Carla Alegria acknowledges the financial support from Fundação para a Ciência e Tecnologia (FCT), through the post-doc grant (SFRH/BPD/126703/2016) and the strategic project UIDB/00329/2020 granted to the Centre for Ecology, Evolution and Environmental Changes, cE3c Faculdade de Ciências, Universidade de Lisboa.
Conflicts of interest
The authors declare no conflict of interest.
Author contributions
Conceptualization, Elsa M. Gonçalves and Marta Abreu; Data curation, Carla Alegria and Joaquina Pinheiro; Formal analysis, Carla Alegria and Isa Raposo; Investigation, Elsa M. Gonçalves, Marta Abreu and Margarida Moldão; Methodology, Carla Alegria, Joaquina Pinheiro; Writing – original draft, Elsa M. Gonçalves, Joaquina Pinheiro, Isa Raposo, Carla Alegria, Marta Abreu and Margarida Moldão; Writing – review & editing, Elsa M. Gonçalves.
REFERENCES
Anthon, G. E., Y. Sekine, N. Watanabe and D. M. Barrett. 2002. Thermal inactivation of pectin methylesterase, polygalacturonase, and peroxidase in tomato juice. J. Agric. Food Chem. 50: 6153-6159. Arabshahi, A. and D. B. Lund. 1985. Considerations in calculating
kinetic parameters from experimental data. J. Food Process. Eng. 7: 239-251.
Ávila, I. M. and C. L. Silva. 1999. Modelling kinetics of thermal degradation of colour in peach puree. J. Food Eng. 39: 161-166. Bifani, V., J. Inostroza, M. J. Cabezas and M. Ihl. 2002. Determinación
de parámetros cinéticos de peroxidasa y clorofila a en judías verdes (Phaseolus vulgaris cv. Win) y estabilidad del producto congelado. Rev. Afinid. 497: 57-64.
Braddock, R.J. 1999. Handbook of Citrus By-Products and Processing Technology. Wiley, New York.
Chakraborty, S., P. S. Rao and H. N. Mishra. 2014. Effect of pH on enzyme inactivation kinetics in high-pressure processed pineapple (Ananas comosus L.) Puree using response surface methodology. Food Bioproc. Tech. 7: 3629-3645.
Chang, B. S., K. H. Park and D. B. Lund. 1988. Thermal inactivation kinetics of horseradish peroxidise. J. Food Sci. 53: 920-923. Chisari, M., R. N. Barbagallo and G. Spagna. 2007. Characterization of
polyphenol oxidase and peroxidase and influence on browning of cold stored strawberry fruit. J. Agric. Food Chem. 55: 3469-3476. Cozzolino, S. and R. C. Angelis. 2004. Fitoquímicos Protectores e
Preventivos de Doenças Degenerativas. Compostos Bioactivos e Antioxidantes nos Alimentos. Available from: http://www. nutricaoempauta.com.br/lista_artigo.php?cod=8, 12082019. [Last accessed on 2019 Oct 04].
Dias, R. A. 2011. Sumos de Frutas Naturais. Características Físico-químicas e Sensoriais. Master Dissertation, Higher Institute of Agronomy, Lisbon.
Drlange. 1994. Colour review. Drlange Application Report No. 8.0e. Drlange, USA.
EN-ISO 6865. 2000. Animal Feeding Stuffs Determination of Crude Fibre Content Method with Intermediate Filtration.
Fernandes, D. M. 2009. Impacto de Processos Físicos na Componente Bioactiva e na Estabilidade de Polpas de Pêra. Master Dissertation, Higher Institute of Agronomy, Lisbon. Freire, M. T., R. R. Petrus, C. A. Freire, C. A. Oliveira, A. M. Felipe and
J. B. Gatti. 2009. Caracterização Físico-química, Microbiológica e Sensorial de Polpa de Cupuaçu Congelada (Theobroma
grandiflorum Schum). Braz. J. Food Technol. 12: 9-16.
Ganjloo, A., R. A. Rahman, A. Osman, J. Bakar and M. Bimakr. 2011. Kinetics of crude peroxidase inactivation and color changes of thermally treated seedless guava (Psidium guajava l.) Food Bioproc. Tech. 4: 1442-1449.
Gonçalves, E. M., J. Pinheiro, M. Abreu, T. R. Brandão and C. L. Silva. 2007. Modelling the kinetics of peroxidase inactivation, colour and texture changes of pumpkin (Cucurbita maxima L.) during blanching. J. Food Eng. 8: 693-701.
Grunert, K. G. 2002. Current issues in the understanding of consumer food choice. Trends Food Sci. Tech. 13: 275-285.
Hagenmaier, R. D. and R. A. Baker. 1998. Microbial population of shredded carrot in modified atmosphere packaging as related to irradiation treatment. J. Food Sci. 63: 162-164.
Hassimotto, N. M. A., M. I. G. Genovese and F. M. Lajolo. 2009. Antioxidant capacity of Brazilian fruit, vegetables and commercially-frozen fruit pulps. J. Food Compos. Anal. 22: 394-396.
Hill, C. G. and R. A. Grieger-Block. 1980. Kinetic data: Generation, interpretation and use. Food Technol. 34: 56-66.
Iqbal, M. N., A. A. Anjum, M. A. Ali, F. Hussain, S. Ali, A. Muhammad, M. Irfan, A. Ahmad, M. Irfan and A. Shabbir. 2015. Assessment of microbial load of un-pasteurized fruit juices and in vitro antibacterial potential of honey against bacterial isolates. Open Microbio. J. 9: 26-32.
ISO 13299. 2016. Sensory Analysis Methodology -- General Guidance for Establishing a Sensory Profile.
ISO 4833-1. 2013. Microbiology of the Food Chain Horizontal Method for the Enumeration of Microorganisms Part 1: Colony count at 30o C by the Pour Plate Technique.
ISO 8586-1. 2001. Sensory Analysis. General Guidance for the Selection, Training and Monitoring of Assessors Part 1: Selected Assessors.
Kim, A. N., H. J. Kim, J. Chun, H. J. Heo, W. L. Kerr and S. G. Choi. 2018. Degradation kinetics of phenolic content and antioxidant activity of hardy kiwifruit (Actinidia arguta) puree at different storage temperatures. LWT. 89: 535-541.
Kortbech-Olesen, R. 1997. World Trade in Processed Tropical Fruits. United Nations Conference on Trade and Development, Geneva, pp. 1-14.
Leistner, L. 1999. Handbook of Food Preservation. Marcel Dekker, New York.
Liu, H., H. Wang, C. Cui, M. Wang, J. Guo, Z. Wen and A. Li. 2013. Experiment improvement of the soluble sugar content determination by enthrone colorimetric method. Lab. Sci. 2: 19-20. Lozano, J. E. and A. Ibarz. 1997. Colour changes in concentrated
fruit pulp during heating at high temperatures. J. Food Eng. 31: 365-373.
Lu, A. T. and J. R. Whitaker. 1974. Some factors affecting rates of heat inactivation and reactivation of horseradish peroxidase. J. Food Sci. 39: 1173-1178.
Marshall, M. R., J. E. Marcy and R. J. Braddock. 1985. Effect of total solids level on heat inactivation of pectinesterase in orange juice. J. Food Sci. 50: 220-222.
Marszałek, K., B. Kruszewski, L. Woźniak and S. Skąpska. 2017. The application of supercritical carbon dioxide for the stabilization of native and commercial polyphenol oxidases and peroxidases in cloudy apple juice (cv. Golden Delicious). Innov. Food Sci. Emerg. Technol. 39: 42-48.
Melo, E. A., M. I. Maciel and V. L. Lima. 2008. Capacidade antioxidante de frutas. Ver. Bras. Cie. Farm. 44: 193-201.
NP-1419. 1987. Frutos, Produtos Hortícolas e Seus Derivados. Determinação de Açúcares Totais, dos Açúcares Redutores e dos Açúcares não Redutores (Sacarose). Munson and Walker Technic. NP-1612. 2006. Carnes, Derivados e Produtos Cárneos.
Determinação do Teor de Azoto Total.
NP-1613. 1979. Carnes, Derivados e Produtos Cárneos. Determinação de Matéria Gorda Total.
NP-1614. 2009. Carnes, Derivados e Produtos Cárneos. Determinação do Teor de Humidade.
NP-1615. 2002. Carnes, Derivados e Produtos Cárneos. Determinação da Cinza Total.
Rhim, J. W., R. V. Nunes, V. A. Jones and K. R. Swartzel. 1989. Kinetics of color change of grape juice generated using linearly increasing temperatures. J. Food Sci. 54: 776-777.
Rizvi, A. F. and C. H. Tong. 1997. Fractional conversion for determining texture degradation kinetics of vegetables. J. Food Sci. 62: 1-7. Simões, J. R. F. 2010. Efeito da Aplicação de Pré-tratamentos Físicos
na Qualidade de Cenoura Minimamente Processada. Master Dissertation, Higher Institute of Agronomy, Lisbon.
Sola-Penna, M. and J. R. Meyer-Fernandes. 1998. Stabilization against thermal inactivation promoted by sugars on enzyme structure and function: Why is trehalose more effective than other sugars. Arch. Biochem. Biophy. 360: 10-14.
Ryan-Stoneham, T. and Tong, C. H. 2000. Degradation kinetics of
chlorophyll in peas as a function of pH. J. Food Sci. 65: 1296-1302.
Suha, O. A., Babiker and E. E. Babiker. 2013. Thermostability at different pH levels of peroxidase extracted from four vegetables. Int. Food Resea. J. 20: 715-719.
Swain, T. and W. E. Hillis. 1959. The phenolic constituents of Prunus
domestica L. The quantitative analysis of phenolic constituents.
J. Sci. Food Agric. 10: 63-68.
Terefe, N. S., Y. H. Yang, K. Knoerzer, R. Buckow and C. Versteeg. 2010. High pressure and thermal inactivation kinetics of polyphenol oxidase and peroxidase in strawberry puree. Innov. Food Sci. Emerg. Technol. 11: 52-60.
Tokuşoğlu, Ö. and C. A. 3rd Hall. 2011. Fruit and Cereals Bioactives. Taylor and Francis Group, LLC, New York.
Turturică, M., N. Stănciuc, C. Mureșan, G. Râpeanu and C. Croitoru. 2018. Thermal Degradation of Plum Anthocyanins: Comparison of Kinetics from Simple to Natural Systems. J. Food Qual. 10: 0-10. Vámos-Vigyázó, L. 1981. Polyphenoloxidase and peroxidase in fruits
and vegetable. CRC Crit. Rev. Food Sci. Nutr. 15: 49-127. Van Loey, A., A. Fransis, M. Hendrickx, G. Maesmansand and
P. Tobback. 1994. Kinetics of thermal softening of white beans evaluated by a sensory panel and the FMC tenderometer. J. Food Process. Pres. 18: 407-420.
Vu, T. S., D. N. Smout, D. N. Sila, B. LyNguyen, A. M. Van Loey and M. E. Hendrickx. 2004. Effect of preheating on thermal degradation kinetics of carrot texture. Innov. Food Sci. Emerg. Technol. 5: 37-44. Zanatta, C. L., M. F. Zotarelli and E. Clemente. 2006. Peroxidase
(POD) e polifenoloxidase (PPO) em polpa de goiaba (Psidium
guajava r.). Ciênc. Tecnol. Aliment. 26: 705-708.
Zou, H., G. Meng, R. Wei, Y. Zhang, Y. Chen and L. Jia. 2012. Biochemical properties of oxidases of Yali pear. Afr. J. Biotech. 11: 11610-11619.