Introduction
The distribution of game species is affected by historical, environmental and, particularly, human-related processes, that act on large geographical scales. On the basis of knowledge about these influences, game species undergo intense manage-ment by humans, mainly directed towards obtaining high hunting yields, for which environmental modelling provides an interesting and useful conceptual framework. Most models that have related environmental conditions to hunting yields have inferred the influence of the environment on demographic para-meters (see Marboutin et al. 2003, for instance). Indeed, environmental factors are known to influence hunting yields owing to their effect on species’ reproduction or survival (Robertson and Rosenberg 1988). However, broad-scale distri-bution models take into account the factors that affect the popu-lations on a larger scale (Lehmann et al. 2002; Thuiller et al. 2005; Muñoz and Real 2006), which may help management efforts to attain more satisfactory results. Broad-scale predictive distribution models have important potential applications: they can forecast species abundance in poorly documented areas, they can predict the response of species to changes in environ-mental conditions, or they can reveal adequate target areas for species management (Fielding and Haworth 1995; Guisan and Thuiller 2005). This approach has been little explored in game management (but see Farfán et al. 2004; Vargas et al. 2006).
Relevant environmental influences may differ from one species to another (Rands 1988), and frequently are different for small and big game species (Ricci et al. 1990; Maillard et al. 1999; Meriggi and Sacchi 2001; Calvete et al. 2004; Santos et al. 2004). This implies that management plans must take into account the differential environmental correlates of small and big
game to assess the suitability of different geographical areas for each game activity. The population trends of big and small game species are frequently divergent (Farfán et al. 2004). In the first half of the 20th century, for example, the distribution of big game populations in Spain was quite fragmentary and restricted to mountainous areas, owing to the high human population density and hunting pressure in lower areas, whereas some small game species were common and most of them occurred in agricultural areas (López-Ontiveros 1991). Indeed, the industrial exploitation of red-legged partridges and European wild rabbits was quite usual, whereas big game species were scarce and had only recre-ational value in local game estates (Hernández-Pacheco 1952). This situation underwent progressive inversion when the wild sheep (Ovis gmelini) and the aoudad (Ammotragus lervia) were introduced to Spain for hunting purposes and the management of big game species became mainly based on restocking efforts within fenced areas (Carranza 1999). On the other hand, wild populations of the European rabbit (Oryctolagus cuniculus) declined sharply in the second half of the last century, following the arrival of myxomatosis in the middle 1950s and viral hemor-rhagic disease in the late 1980s (Beltrán 1991; Cooke 2002). Wild populations of red-legged partridge also underwent a general decline as a consequence of hunting pressure and loss of habitat quality (Lucio and Purroy 1992).
In Spain, as in other Western European countries, hunting is a traditional activity with cultural, social and economic impor-tance (Vargas 2002). It is practised by as much as 2.3% of the total Spanish population, reaching a density of 1.94 hunters per 100 ha (FACE 2005). At present, there are about a million hunters nationally plus more than 25 000 foreign ones, mainly
10.1071/WR06012 1035-3712/07/060498 © CSIRO 2007
J. M. Vargas
A,B, M. A. Farfán
A, J. C. Guerrero
A, A. M. Barbosa
Aand R. Real
AADepartamento de Biología Animal, Universidad de Málaga, E-29071 Málaga, Spain.
BCorresponding author. Email: [email protected]
Abstract. In Andalusia, southern Spain, each game estate applies its own rules and presents its results in annual hunting
reports, which have been mandatory for Spanish game estates since 1989. We used the information about hunting yields, included in 32 134 annual hunting reports produced during the period 1993/94 to 2001/02 by 6049 game estates, to deter-mine the current distribution of hunting yields of big and small game species in Andalusia. Using generalised linear models and a geographic information system, we determined the most favourable municipalities to big and small game, respectively, and delimited potential areas to attain good hunting yields for big and small game at a 1-km2resolution.
Municipalities and areas favourable to big game are mainly located in the Sierra Morena and the westernmost fringe of the Betic Range, while those favourable to small game occupy the upper Guadalquivir River valley. There is a clear seg-regation between big and small game species according to the physiography and land uses of the territory. Big game species are typical of Mediterranean woodland areas, while the most emblematic small game species prefer agricultural areas. Our results provide a territorial ordination of hunting yields in southern Spain and have several potential applica-tions in strategic planning for hunting activities and biodiversity conservation in Andalusia that can be extrapolated to other regions.
Geographical and environmental correlates of big
and small game in Andalusia (southern Spain)
from France, Italy and the USA, who come to Spain each year attracted by various species that are very common in, or exclu-sive to, the Iberian Peninsula (Mulero 1991a).
Current game management in Spain only takes into account factors operating on a local scale. The National Hunting Law of 1970 consolidated game estates as the basic unit of game man-agement in Spain. Since the early 1990s, game manman-agement in each estate is set within a technical hunting plan. This is manda-tory and must take into account management guidelines based on a 4-year forecast of game harvests and must be presented each year in an Annual Hunting Report. The current hunting regulations in Spain are set up by Regional Governmental Agencies (which establish global hunting seasons) and hunters (who establish local hunting quotas), in both cases seldom sup-ported by scientific information (Angulo and Villafuerte 2004). Hunting management in homogeneous areas does not follow an integrated plan, but rather each landowner or local hunting society applies its own rules, many of which are unfavourable to neighbouring estates. Up to the present, it has been difficult to amend such planning in order to adopt a more global strategy, because current knowledge on the potential of the territory and the environmental variables determining the geographical distribution of game species at regional scales is rather scarce (López-Ontiveros and García-Verdugo 1991).
In Andalusia, the Regional Governmental Agency has obtained in recent years accurate datasets concerning hunting yield distributions (Farfán et al. 2004; Vargas et al. 2004, 2006). These data are included in the Annual Hunting Reports that each game estate must submit to the regional government. In this paper we aim to use these data to: (1) define which areas are potentially optimal and which are suboptimal for big and small game species; (2) determine which environmental factors shape the geographical distribution of hunting yields at a regional level; and (3) discuss the role of spatial modelling of hunting yields in modern game management.
Material and methods Study area
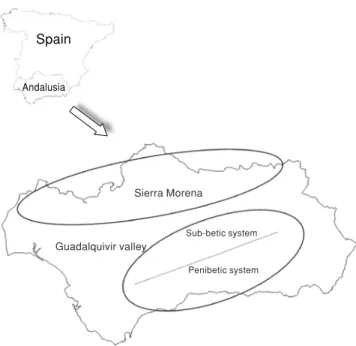
This work was carried out in Andalusia (southern Spain) (Fig. 1), an area of ~87 268 km2. Physiographically,
medium-sized mountains predominate in the Andalusian landscape (42% of total surface). Thus, 38% of the agricultural land is mountainous and crops are generally restricted to the inner valleys (flat depressions) or to gently sloping hillsides. The main mountain ranges are the Sierra Morena and the Betic System. The Sierra Morena is situated along the northern fringe of Andalusia (400–1300 m altitude, and poor and moderately acid soils), and belongs to the southern border of the Iberian Plateau. The dominant vegetation is natural (evergreen oak forests and scrublands) and is currently used for extensive livestock raising and hunting. The Betic System presents greater lithological heterogeneity and is subdivided into two ranges, the Sub-betic and Penibetic, separated by the intrabetic ridge, being a set of discontinuous depressions with most of the area used for agri-culture. The dominant vegetation is also natural (pine forests, evergreen oak forests and scrublands) and the hilly areas are dedicated to dry farming woody crops. The maximum height occurs in the Penibetic range, reaching 3479 m. The Betic
System is oriented from north-east to south-west and mainly occupies the eastern part of Andalusia. The most important plain is the Guadalquivir Valley, which is mainly oriented longi-tudinally between the Sierra Morena and the Betic System. The valley bottom is covered by herbaceous crops and river terraces, and the hill slopes by woody crops. The climate of this region is Mediterranean, with mild winters and severe summer droughts. There is a decreasing west-to-east precipitation gradient.
In Andalusia, there are 40 game species (10 mammals and 30 birds), the average annual number of hunting licenses has exceeded 250 000 in the last 15 years, hunting activities are carried out in 89.2% of the territory, and the overall number of estates is almost 9000. On the other hand, big game and red-legged-partridge-driven (Alectoris rufa) shooting, stalking of Iberian wild goat and roe deer (Capreolus capreolus), and rabbit coursing are considered the most profitable economic hunting activities in the region.
Establishing the areas favourable to small and big game We analysed the hunting yields of the most representative big game species of Andalusia, the Iberian wild goat (Capra pyre-naica), red deer (Cervus elaphus), roe deer (Capreolus capreo-lus) and wild boar (Sus scrofa), and the most emblematic small game species, namely the European wild rabbit, Iberian hare (Lepus granatensis), and red-legged partridge. We analysed 32134 Annual Hunting Reports produced during the period 1993/94 to 2001/02 by 6049 game estates, to estimate the average hunting yields of the above mentioned species in each Andalusian municipality (n = 771), according to the following equation:
HY = ∑mean annual number of individuals hunted per game estate/∑areas of the game estates × 100 where HY is the hunting yield per municipality expressed by the number of individuals captured per 100 ha of game estate where the species is hunted.
Spain Andalusia Sierra Morena Guadalquivir valley Sub-betic system Penibetic system
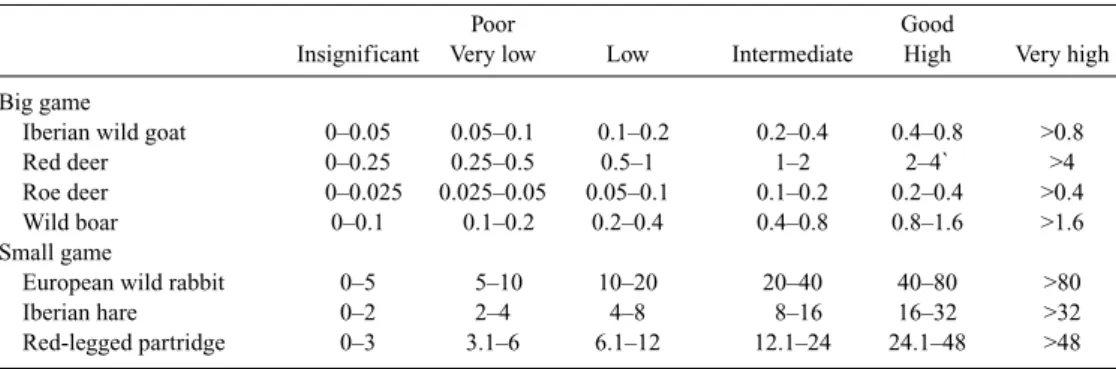
We found that hunting yields conformed to a log-normal distribution analogous to that reported by Preston (1962, 1980) for species abundances. Consequently, we established for each species six classes of hunting yields whose ranges increased logarithmically (binary logarithm) between zero and the highest values obtained in the municipalities. In this way, the range of the last interval was half the highest value, and the value divid-ing the three lower from the three higher classes was the highest value divided by 8. As our aim was to detect areas favourable to good hunting yields, as opposed to predicting expected hunting yield values, we followed the criterion of Farfán et al. (2004) and Vargas et al. (2006) and considered the three highest classes (intermediate, high, and very high values of hunting yields) as representative of good hunting yields and the three lowest as poor hunting yields (Table 1).
We characterised the municipalities with good yields com-pared with those with poor yields using stepwise logistic regres-sion (Hosmer and Lemeshow 1989) in relation to a set of climatic, orographic, land use, and vegetation cover variables (Table 2). Logistic regression is a widely used tool for modelling species distributions (e.g. Barbosa et al. 2003; Monzón et al. 2004; Real et al. 2005; Muñoz et al. 2005) and has been used to model hunting yields (Farfán et al. 2004; Vargas et al. 2006). Altitude was taken from the Land Processes Distributed Active Archive Center, located at the EROS Data Center (US Geo-logical Survey 1996). Slope was calculated from altitude through the Idrisi SLOPE command. Climatic variables (HJAN through PIRR in Table 2), which corresponded to records taken during several (generally ~40) years and were considered to be mostly representative of current climatic conditions (Font 2000), were digitised using the CartaLinx 1.2 software and pro-cessed using the Idrisi32 GIS software (see Barbosa et al. 2003; for a detailed explanation of the digitising methods). The vari-ables related to land use and vegetation cover (IHER through DS), expressed in percentage of surface occupied, were obtained by transforming the corresponding digital vector polygons into raster images and extracting the proportion of each type of land use and vegetation cover in each municipality. These values cor-respond to the year 1999, which is central to the period anal-ysed; although land uses change along time and space, as hunting yields also do, in this analysis we analysed only the spatial variation in both land use and hunting yield, and so we related a single (mean) value of hunting yield with a single (year 1999) value of land uses in each municipality.
For each species, we performed logistic regression of good and poor hunting yields (ones and zeros, respectively) on each variable separately to select a subset of variables that signifi-cantly affected the probability of obtaining good hunting yields. We dealt with the familywise error rate (i.e. the increase of Type I error under repeated testing) by controlling the false discovery rate (Benjamini and Hochberg 1995; García 2003) using the cedure for all forms of dependency among test statistics pro-posed by Benjamini andYekutieli (2001). We used the significant variables under a false discovery rate of q < 0.05 to build a mul-tiple logistic model of good yield distribution by performing logistic regression with forward stepwise variable selection pro-cedure, and the step with the best Akaike’s information criterion score where all variables added significant predictive power was selected (Akaike 1973). The relative contribution of variables to the resulting model was assessed using the test of Wald (1943).
We modelled the favourability of obtaining good hunting yields for the species using the environmental favourability function described by Real et al. (2006), which is a generalised linear model that may be obtained from the probability values produced by the logistic regression, and eliminates from the model the effect of the uneven proportion of ones and zeros in the dataset. The favourability for a good hunting yield in each municipality is obtained from the formula:
F = (P/(1 – P))/((n1/n0) + (P/(1 – P)))
where P is the probability value given by the multiple logistic regression, and n1and n0are the number of municipalities with good and poor hunting yields, respectively (Real et al. 2006). Favourability values range from 0 to 1. We considered as favour-able to hunting each species those municipalities whose favoura-bility of obtaining a good hunting yield was higher than 0.95.
The favourability equation obtained was then introduced in the Idrisi Image Calculator and used to downscale the final model and create an image representing the favourability of obtaining good hunting yields for the species in 1× 1 km squares in Andalusia.
To display the Andalusian areas favourable for small game, the images obtained for the European wild rabbit, Iberian hare and red-legged partridge were introduced together in the Idrisi Image Calculator and the favourable areas were determined with two levels of requirement:
(a) The 1 × 1 km squares of Andalusia where, at least for one small game species, the favourability of obtaining good hunting yields was higher than 95%.
Table 1. Intervals used to classify the hunting yields (no. of individuals captured per 100 ha) of the most representative game species in Andalusia
Poor Good
Insignificant Very low Low Intermediate High Very high Big game
Iberian wild goat 0–0.05 0.05–0.1 0.1–0.2 0.2–0.4 0.4–0.8 >0.8
Red deer 0–0.25 0.25–0.5 0.5–1 1–2 2–4` >4
Roe deer 0–0.025 0.025–0.05 0.05–0.1 0.1–0.2 0.2–0.4 >0.4
Wild boar 0–0.1 0.1–0.2 0.2–0.4 0.4–0.8 0.8–1.6 >1.6
Small game
European wild rabbit 0–5 5–10 10–20 20–40 40–80 >80
Iberian hare 0–2 2–4 4–8 8–16 16–32 >32
(b) The 1 × 1 km squares of Andalusia where, at least for two small game species simultaneously, the favourability of obtaining good hunting yields was higher than 95%. We followed the same protocol to obtain the favourable areas for big game species in Andalusia.
Results
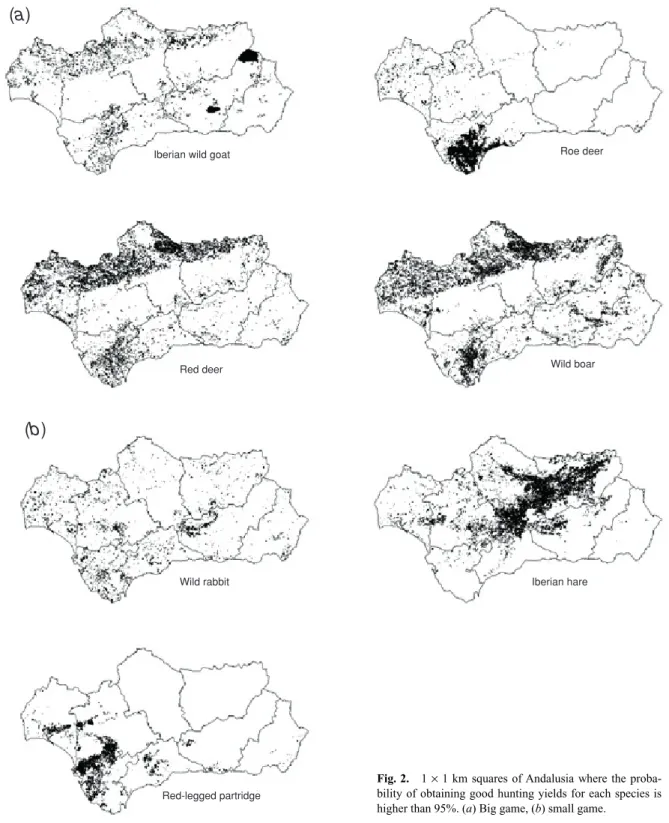
Tables 3 and 4 show the final logistic regression models of hunting yields and their corresponding statistics for small and big game, respectively. Fig. 2 shows the 1 × 1 km squares of Andalusia where the probability of obtaining good hunting yields for each species is higher than 95%.
Figure 3A1, B1 shows the municipalities favourable to obtaining good hunting yields of small game, big game, or both simultaneously. Municipalities in Fig. 3A1 are favourable to one small or big game species, whereas those in Fig. 3B1 are favourable to two species of each category. Municipalities favourable to big game are mainly located in the Sierra Morena and the westernmost fringe of the Betic Range, while those favourable to small game occupy the upper part of the Guadalquivir River valley. No municipality is favourable to obtaining good hunting yields for small and big game simulta-neously, or for two small game species simultaneously.
Analogously, the downscaled geographical model of the most favourable areas in Andalusia for small and big game hunting yield are shown in Fig. 3A2, B2. Fig. 3A1, B1 under-represented these favourable areas, since only if nearly all the municipal surface is highly favourable for small or big game the municipality will be considered highly favourable. There is a clear spatial segregation between the most appropriate areas for small and big game. This is shown by the low number of 1× 1 km squares where the probability of obtaining good hunting yields for small and big game simultaneously is higher than 95%. According to Fig. 3A2, B2, good hunting yields for small game in Andalusia are expected in the Guadalquivir River valley and the plains between the Sub-Betic and Penibetic ranges. In con-trast, big game is mainly favoured in the mountainous regions of the Sierra Morena and the Betic range.
When we use the two-species criterion to delimit the most favourable areas for small and big game (Fig. 3B2), the extent of optimum areas decreases considerably. However, the reduc-tion is more evident for small game, since optimum areas are limited to the southern Guadalquivir valley and specific Sub-Betic depressions. The most favourable areas for big game cor-respond to the Sierra Morena and the westernmost sector of the Betic Range, whereas the favourable areas of the south-east sector nearly disappear.
Discussion
In many areas of southern Spain, hunting management has become a new agrarian land use of great economic importance, especially in the most depressed rural areas (López-Ontiveros 1991; Lucio and Purroy 1992). Until a few decades ago, local non-profit hunting societies were predominant in these areas (López-Ontiveros 1991; Mulero 1991b), but in recent years they tend to be displaced by hunting for economic purposes. In spite of that, the current geographical distribution of the highest hunting yields of big and small game species in Andalusia and their relationship with landscape features have been hardly investigated (López-Ontiveros and García-Verdugo 1991).
Geographical landscape patterns are the result of natural and social interactions (Naveh and Lieberman 1985). Fig. 3 shows that there is a clear spatial segregation between big and small game species. Big game species are typical of Mediterranean woodland areas, while the most emblematic small game species prefer agricultural areas (see Tables 3 and 4). The segregation is so clear that there are few 1 × 1 km squares with optimum hunting yields for both groups of species simultaneously. This not only reflects the differential effects of physical attributes of the landscape but also those of land uses (Fernández Ales et al. 1992), particularly the intensification of the most productive Table 2. Variables used to model the distribution of hunting yields
on 1 ×× 1 km squares in Andalusia
Sources: (1) US Geological Survey (1996); (2) Font (1983); (3) Montero de Burgos and González-Rebollar (1974); (4) Junta de Andalucía (1999)
Code Variable Source
Orography
ALTI Altitude (m) 1
SLOP Slope (%)
Climate
DFRO Mean annual number of frost days (minimum 2 temperature <0°C)
HJAN Mean relative air humidity in January at 07:00 hours (%) 2
HJUL Mean relative air humidity in July at 07:00 hours (%) 2
HRAN Annual relative air humidity range (%) (= |HJAN–HJUL|) 2
INSO Mean annual isolation (h year–1) 2
PET Mean annual potential evapotranspiration (mm) 2
PIRR Pluviometric irregularity 3
PREC Mean annual precipitation (mm) 2
ROFF Mean annual runoff (mm) 2
SRAD Mean annual solar radiation (kwh m–2day–1) 2
TEMP Mean annual temperature (°C) 2
TJAN Mean temperature in January (°C) 2
TJUL Mean temperature in July (°C) 2
TRAN Annual temperature range (°C) (= TJUL–TJAN) 2
Land use and vegetation cover
BL Built land (% area) 4
CW Conifer wood (% area) 4
DHER Dry herbaceous crops (% area) 4
DHET Dry heterogeneous crops (% area) 4
DS Dense scrub (% area) 4
DSWC Dense scrub with conifers (% area) 4
DSWD Dense scrub with diverse trees (% area) 4
DSWO Dense scrub with oaks (% area) 4
DWC Dry wood crops (% area) 4
HCWO Herbaceous crops with oaks (% area) 4
IHER Irrigated herbaceous crops (% area) 4
IHET Irrigated heterogeneous crops (% area) 4
IWC Irrigated woody crops (% area) 4
MCNV Mosaic of crops and natural vegetation (% area) 4
OAKW Oak wood (% area) 4
PAST Pasture (% area) 4
PWC Pasture with conifers (% area) 4
PWO Pasture with oaks (% area) 4
SS Sparse scrub (% area) 4
SSWC Sparse scrub with conifers (% area) 4
SSWD Sparse scrub with diverse trees (% area) 4
SSWO Sparse scrub with oaks (% area) 4
agricultural areas in the plains and the abandoning of traditional uses in mountain areas (Fernández Ales et al. 1992). While the original woodlands, according to Table 4, favour big game, the Guadalquivir Valley and its southern neighbouring hilly areas are the optimum zone for small game (Fig. 3) owing to the extensive presence of croplands, which favour small game (Table 3). In spite of that, the agricultural intensification in Andalusian plains and surrounding hill slopes has been pro-posed as a cause of the widespread regression of small game species during the last decades (Rivera 1991).
Small game management has recently been based on restock-ing, mainly using red-legged partridges bred in game farms, and translocated European wild rabbits (Cotilla and Villafuerte
2007). This strategy fails to recover wild populations because the mortality of released individuals is high, particularly during the first months after release (Capelo and Castro-Pereira 1996; Gortázar et al. 2000). Currently, only in the southern Guadalquivir Valley is the management of the red-legged par-tridge not exclusively sustained by restocking, and it is here that hunting yields and economic benefits are highest (Garrido 2002). This suggests that Fig. 3 could be used to identify areas favourable to obtaining good hunting yields without resorting to restocking, so constituting a broad-scale management tool helpful in the promotion of good-quality, profitable hunting.
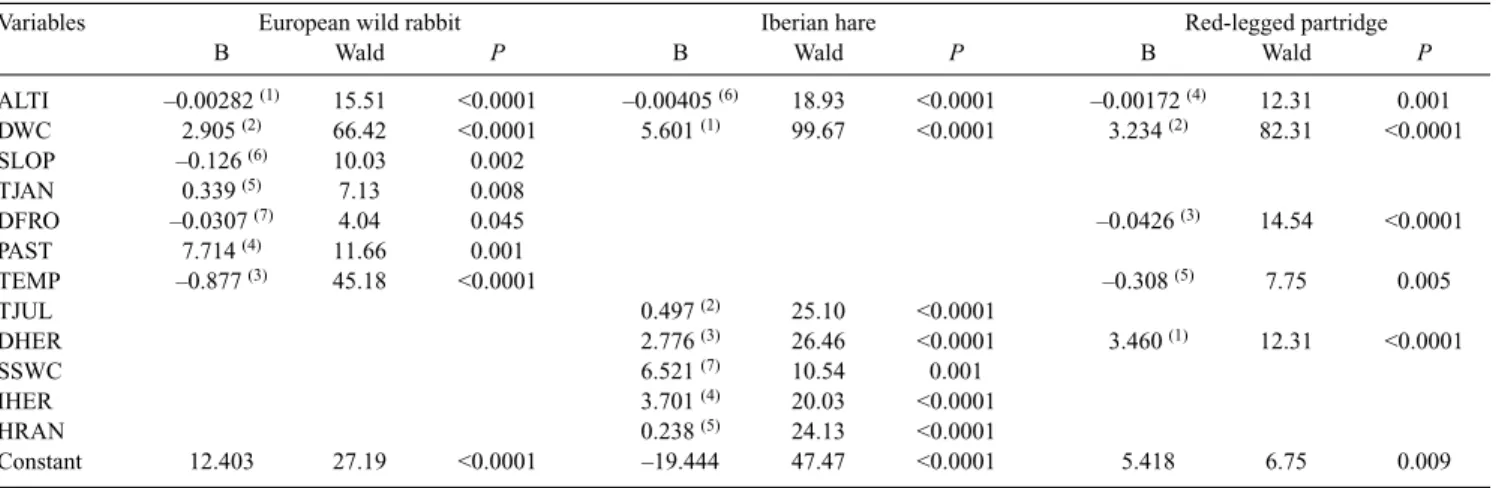
On the other hand, ~25% of Andalusia consists of wooded areas that mainly occupy the mountainous regions and favour Table 3. Variables retained in the final logistic regression and their corresponding statistics for small game species
Variable abbreviations are as in Table 2. B, coefficient in the function y. Numbers in parentheses indicate the order of entrance of the variables into the model
Variables European wild rabbit Iberian hare Red-legged partridge
B Wald P B Wald P B Wald P
ALTI –0.00282 (1) 15.51 <0.0001 –0.00405 (6) 18.93 <0.0001 –0.00172 (4) 12.31 0.001 DWC 2.905 (2) 66.42 <0.0001 5.601 (1) 99.67 <0.0001 3.234 (2) 82.31 <0.0001 SLOP –0.126 (6) 10.03 0.002 TJAN 0.339 (5) 7.13 0.008 DFRO –0.0307 (7) 4.04 0.045 –0.0426 (3) 14.54 <0.0001 PAST 7.714 (4) 11.66 0.001 TEMP –0.877 (3) 45.18 <0.0001 –0.308 (5) 7.75 0.005 TJUL 0.497 (2) 25.10 <0.0001 DHER 2.776 (3) 26.46 <0.0001 3.460 (1) 12.31 <0.0001 SSWC 6.521 (7) 10.54 0.001 IHER 3.701 (4) 20.03 <0.0001 HRAN 0.238 (5) 24.13 <0.0001 Constant 12.403 27.19 <0.0001 –19.444 47.47 <0.0001 5.418 6.75 0.009
Table 4. Variables retained in the final logistic regression and their corresponding statistics for big game species
Variable abbreviations are as in Table 2. B, coefficient in the function y. Numbers in parentheses indicate the order of entrance of the variables into the model
Variables Iberian wild goat Red deer Roe deer Wild boar
B Wald P B Wald P B Wald P B Wald P
TEMP –0.586 (1) 32.52 <0.0001 INSO –0.00435 (3) 7.37 0.007 0.00253 (14) 4.32 0.038 HRAN –0.123 (2) 20.80 <0.0001 PWO –22.635 (4) 9.97 0.002 4.458 (3) 17.54 <0.0001 4.00496 (3) 12.25 <0.0001 SSWO 7.221 (5) 15.32 <0.0001 DSWO 14.196 (1) 57.73 <0.0001 10.635 (1) 21.67 <0.0001 PWC 68.939 (2) 17.93 <0.0001 72.203 (5) 10.36 0.001 PAST 7.311 (5) 8.06 0.005 7.811 (1) 4.18 0.041 DSWC 10.682 (4) 15.71 <0.0001 MCNV –20.458 (6) 12.04 0.001 PREC 0.00559 (2) 6.09 0.014 ROFF 0.0150 (4) 15.72 <0.0001 –0.00290 (9) 12.29 <0.0001 ALTI –0.0163 (3) 19.81 <0.0001 0.000959 (10) 6.33 0.012 DFRO 0.0380 (2) 15.53 <0.0001 PET 0.00652 (7) 7.40 0.007 CW 4.409 (8) 8.78 0.003 OAKW 7.678 (11) 8.00 0.005 IWC –8.397 (12) 5.68 0.017 DS 8.587 (6) 13.68 <0.0001 SSWD 7.956 (4) 16.52 <0.0001 BL –4.636 (13) 4.41 0.036 Constant 22.506 24.97 <0.0001 –3.0263 191.80 <0.0001 –8.0639 27.81 <0.0001 –15.742 17.53 <0.0001
big game (Table 4). During the last centuries, several of these forests have disappeared owing to traditional human uses such as farming, cattle raising, and forest exploitation, which cur-rently are not profitable and have recently devolved into big game in fenced estates and ecotourism (Carranza 1999). As López-Giménez (1972) pointed out, big game activities, such as the stalking of Iberian wild goat and roe deer, are crucial to maintaining the profitability of highland tenements in these
mountain ranges. Consequently, big game has good prospects as a primary or complementary income in the mountainous regions and can contribute to maintaining the rural population. However, the consolidation of big game as an alternative to other uses requires the implementation of quality criteria based on the so-called ‘good management practices’ (FUNGESMA 2001). This involves promoting traditional hunting modalities, with low impact over wild populations and compatible with the
(b)
Red-legged partridge
Wild boar Roe deer
Red deer Iberian wild goat
Iberian hare Wild rabbit
(a)
Fig. 2. 1 × 1 km squares of Andalusia where the proba-bility of obtaining good hunting yields for each species is higher than 95%. (a) Big game, (b) small game.
conservation of biodiversity and natural habitats, which should be submitted to an official certification of quality.
The future of small game is more uncertain, as it is only a complementary economic activity in several well managed agri-cultural zones of the Gualdalquivir Valley and the Betic depres-sions. Its progressive scarcity has meant that the number of small game licences in Spain declined by 17.1% between 1991 and 2001. Despite this trend, the intensive management of game estates is the main reason behind the conflicts between small game activities and biodiversity conservation (Vargas 2002). Species such as the rabbit, partridge, and hare require urgent measures for preserving or improving their populations, consid-ering their importance as the prey of threatened Iberian preda-tors (Calderón 1977; Delibes and Hiraldo 1981; Valverde 1984). Research programs should be established as a basic tool for management policies of game species (Potts 2000). Our results
provide a territorial ordination of hunting yields in southern Spain, and have several potential applications in strategic plan-ning for hunting activities and biodiversity conservation in Andalusia, as well as in other regions with environmental and hunting bag datasets of comparable quality. Environmental functions such as those shown in Tables 3 and 4 could be used to manage habitat in order to favour certain species. The estab-lishment of dense scrub at the expense of pasture in oak forests, for example, would favour Iberian wild goat yields according to the function shown in Table 4. Habitat management based on scientific assessment, including spatial modelling of hunting yields, could help make hunting compatible with nature conser-vation. This aim is a priority in areas where optimal hunting yields and economical values of game activities overlap with the distribution ranges of endangered species. This is the case in the Sierra Morena, where there are relict populations of Iberian lynx, imperial Iberian eagle, and wolf; in the Guadalquivir Valley, where there are vulnerable breeding populations of great bustard (Otis tarda) and little bustard (Tetrax tetrax); and in the Betic Ranges, which support several pairs of Egyptian vulture (Neophron percnopterus) and the most important Spanish popu-lation of Bonelli’s eagle (Hieraaetus fasciatus). We recommend following the example of the UK where, according to Martínez et al. (2002), management of game currently contributes to the creation and maintenance of wildlife habitats, forming an inter-esting confluence of interest among hunters, government, and environmental associations aimed at biodiversity preservation. On the other hand, areas that are not favourable to obtaining good hunting yields could be more carefully supervised by gov-ernments, and quotas could be set based on more local, and species-specific, spatial models.
Acknowledgements
This work was financed by the Consejería de Innovación, Ciencia y Empresa de la Junta de Andalucía (Research Project P05-RNM-00935) and the Ministerio de Educación y Ciencia of the Spanish Government (Research Project CGL2006–09567/BOS).
References
Akaike, H. (1973). Information theory and an extension of the maximum likelihood principle. In ‘Proceedings of the Second International Symposium on Information Theory’. (Eds B. N. Petrov and F. Csaki.) pp. 267–281. (Akademiai Kiado: Budapest.)
Angulo, E., and Villafuerte, R. (2004). Modelling hunting strategies for the conservation of wild rabbit populations. Biological Conservation 115, 291–301. doi:10.1016/S0006-3207(03)00148-4
Barbosa, A. M., Real, R., Olivero, J., and Vargas, J. M. (2003). Otter (Lutra
lutra) distribution modeling at two resolution scales suited to
conserva-tion planning in the Iberian Peninsula. Biological Conservaconserva-tion 114, 377–387. doi:10.1016/S0006-3207(03)00066-1
Beltrán, J. F. (1991). Temporal abundance pattern of the wild rabbit in Doñana, SW Spain. Mammalia 55, 591–599.
Benjamini, Y., and Hochberg, Y. (1995). Controlling the false discovery rate: a practical and powerful approach to multiple testing. Journal of the
Royal Statistical Society. Series A (General) 57, 289–300.
Benjamini, Y., and Yekutieli, D. (2001). The control of the false discovery rate in multiple testing under dependency. The Annals of Statistics 29, 1165–1188. doi:10.1214/aos/1013699998
Calderón, J. (1977). El papel de la perdiz roja (Alectoris rufa) en la dieta de los predadores Ibéricos. Doñana, Acta Vertebrata 4, 61–126.
(A2) (A1)
(B2) (B1)
Fig. 3. (A1, B1) Potential optimum Andalusian municipalities for small game (light grey) and big game (dark grey). (A1) Municipalities where, at least for one small or big game species, the probability of obtaining good hunting yields is higher than 95%. (B1) Municipalities where the probability of obtaining good hunting yields is higher than 95% for two or more species. (A2, B2) Potential optimum regions for the hunting yields of small game (light grey), big game (dark grey) and both simultaneously (black). (A2) We considered favourable area for small and big game the 1 × 1 km squares of Andalusia where, at least for one species, the probability of obtaining optimum hunting yields is higher than 95%. (B2) We considered favourable areas for small and big game the 1 × 1 km squares of Andalusia where, at least for two species, the probability of obtaining optimum hunting yields is higher than 95%.
Calvete, C., Estrada, R., Angulo, E., and And Cabezas-Ruiz, S. (2004). Habitat factors related to wild rabbit conservation in an agricultural landscape. Landscape Ecology 19, 531–542. doi:10.1023/B:LAND. 0000036139.04466.06
Capelo, M., and Castro-Pereira, D. (1996). Sobrevivência e dispersao de perdizes (Alectoris rufa L.) largadas em duas operaçoes de repovamento cinegético. Revista Florestal 9, 243–253.
Carranza, J. (1999). Aplicaciones de la etología al manejo de las pobla-ciones de ciervo en el suroeste de la Península Ibérica: producción y conservación. Etología 7, 5–18.
Cooke, B. D. (2002). Rabbit haemorrhagic disease: field epidemiology and the management of wild rabbit populations. Revue scentifique et
tech-nique de l’Office International des Epizooties 21, 347–358.
Cotilla, I., and Villafuerte, R. (2007). Rabbit conservation: models to eval-uate the effects of timing of restocking on recipient and donor popu-lations. Wildlife Research 34, 247–252.
Delibes, M., and Hiraldo, F. (1981). The rabbit as prey in the Iberian Mediterranean Ecosystem. In ‘Proceedings of the World Lagomorph Conference, Guelph, Canada’. (Eds K. Myers and C. D. MacInnes.) pp. 614–622.
FACE (2005). Census of the number of hunters in Europe. http://www.face-europe.org/fs-hunting.htm (updated 21.02.2005).
Farfán, M. A., Guerrero, J. C., Real, R., Barbosa, A. M., and Vargas, J. M. (2004). Caracterización del aprovechamiento cinegético de los mamíferos en Andalucía. Galemys 16, 41–59.
Fernández Ales, R., Martín, A., Ortega, F., and Ales, E. E. (1992). Recent changes in landscape structure and function in a mediterranean region of SW Spain (1950–1984). Landscape Ecology 7, 3–18. doi:10.1007/ BF02573953
Fielding, A. H., and Haworth, P. F. (1995). Testing the generality of bird–habitat models. Conservation Biology 9, 1466–1481. doi:10.1046/ j.1523-1739.1995.09061466.x
Font, I. (1983). ‘Atlas climático de España.’ (Instituto Nacional de Meteorología: Madrid.)
Font, I. (2000). ‘Climatología de España y Portugal.’ (Ediciones Universidad de Salamanca: Salamanca.)
FUNGESMA (Fundación para la Gestión y Protección del Medio Ambiente) (2001). ‘Buenas Prácticas Cinegéticas.’ (Mundiprensa: Madrid.)
García, L. V. (2003). Controlling the false discovery rate in ecological research. Trends in Ecology & Evolution 18, 553–554. doi:10.1016/ j.tree.2003.08.011
Garrido, J. L. (2002). Capturas de perdiz roja. In ‘Aportaciones a la Gestión sostenible de la Caza en España’. (Eds A. Lucio and M. Sáenz de Buruaga.) pp. 141–147. (FEDENCA-EEC: Madrid.)
Gortázar, C., Villafuerte, R., and Martín, M. (2000). Success of traditional restocking of red-legged partridge for hunting purposes in areas of low density of northeast Spain Aragón. Zeitschrift für Jagdwissenschaft 46, 23–30. doi:10.1007/BF02240661
Guisan, A., and Thuiller, W. (2005). Predicting species distribution: offering more than simple habitat models. Ecology Letters 8, 993–1009. doi:10.1111/j.1461-0248.2005.00792.x
Hernández-Pacheco, E. (1952). ‘El Solar de la Historia hispana.’ Madrid: 270–300.
Hosmer, D. W., and Lemeshow, S. (1989). ‘Applied Logistic Regression.’ (John Wiley and Sons, Inc.: New York.)
Junta de Andalucía (1999). ‘Mapa de Usos y Coberturas vegetales del Suelo de Andalucía 1999.’ (Consejería de Medio Ambiente: Sevilla.) Lehmann, A., Leathwick, J. R., and Overton, J. McC. (2002). Assessing
New Zealand fern diversity from spatial predictions of species assem-blages. Biodiversity and Conservation 11, 2217–2238. doi:10.1023/ A:1021398729516
López-Giménez, R. (1972). Aportaciones al estudio de las explotaciones de caza mayor de Sierra Morena Occidental. Archivos de Zootecnia 82, 167–191.
López-Ontiveros, A. (1991). Algunos aspectos de la evolución de la caza en España. Agricultura y Sociedad 58, 13–51.
López-Ontiveros, A., and García-Verdugo, F. J. (1991). Geografía de la caza en España. Agricultura y Sociedad 58, 81–112.
Lucio, A., and Purroy, F. J. (1992). Caza y conservación de aves en España.
Ardeola 39, 85–98.
Maillard, D., Roca, L., and Melac, O. (1999). Première étape de la gestion départementale des sangliers: la délimitation des unités de gestion par analyse multivariée. Le Bulletin Mensuel de L’Office National de la
Chasse 246, 4–11.
Marboutin, E., Bray, Y., Peroux, R., Mauvy, B., and Lartiges, A. (2003). Population dynamics in European hare: breeding parameters and sus-tainable harvest rates. Journal of Applied Ecology 40, 580–591. doi:10.1046/j.1365-2664.2003.00813.x
Martínez, J., Viñuela, J., and Villafuerte, R. (2002). Reconciling gamebird hunting and biodiversity (REGHAB). Socio-economic aspects of game-bird hunting, hunting bags, and assessment of the status of gamegame-bird populations in REGHAB countries. Part 1: Socio-economic and cultural aspects of gamebird hunting. 52 pp.
Meriggi, A., and Sacchi, O. (2001). Habitat requirements of wild boars in the northern Apennines (N Italy): a multi-level approach. The Italian
Journal of Zoology 68, 47–55.
Montero de Burgos, J. L., and González-Rebollar, J. L. (1974). ‘Diagramas Bioclimáticos.’ (ICONA, Madrid.)
Monzón, A., Fernandes, P., and Rodríguez, N. (2004). Vegetation structure descriptors regulating the presence of wild rabbit in the National Park of Peneda-Gerês, Portugal. European Journal of Wildlife Research 50, 1–6. doi:10.1007/s10344-003-0027-7
Mulero, A. (1991a). Turismo y caza en España. Estado de la cuestión.
Agricultura y Sociedad 58, 147–171.
Mulero, A. (1991b). La organización local de la caza en España. Una aprox-imación geográfica. Agricultura y Sociedad 58, 187–213.
Muñoz, A. R., and Real, R. (2006). Assessing the potential range expansion of the exotic monk parakeet in Spain. Diversity & Distributions 12, 656–665. doi:10.1111/j.1472-4642.2006.00272.x
Muñoz, A. R., Real, R., Barbosa, A. M., and Vargas, J. M. (2005). Modelling the distribution of Bonelli’s eagle in Spain: implications for conserva-tion planning. Diversity & Distribuconserva-tions 11, 477–486. doi:10.1111/ j.1366-9516.2005.00188.x
Naveh, Z., and Lieberman, A. S. (1985). ‘Landscape Ecology.’ (Springer-Verlag: New York.)
Potts, G. R. (2000). Using the scientific method to improve game bird man-agement and research. In ‘Proceedings of the National Quail Symposium’. (Eds L. A. Brennan, W. E. Palmer, L. W. Burguer and T. L. Pruden.) (Tall Timbers Research Station: Tallahase, FL). Preston, F. W. (1962). The canonical distribution of commonness and rarity:
Part I. Ecology 43, 185–215. doi:10.2307/1931976
Preston, F. W. (1980). Noncanonical distributions of commonness and rarity.
Ecology 61, 88–97. doi:10.2307/1937159
Rands, M. R. W. (1988). Habitat quality and gamebird population ecology. In ‘Ecology and Management of Gamebirds’. (Eds P. J. Hudson and M. R. W. Rands.) pp. 134–158. (BSP Professional Books: Oxford.) Real, R., Barbosa, A. M., Martínez-Solano, I., and García-París, M. (2005).
Distinguishing the distributions of two cryptic frogs (Anura: Discoglossidae) using molecular data and environmental modeling.
Canadian Journal of Zoology 83, 536–545. doi:10.1139/z05-040
Real, R., Barbosa, A. M., and Vargas, J. M. (2006). Obtaining environmental favourability functions from logistic regression. Environmental and
Ecological Statistics 13, 237–245. doi:10.1007/s10651-005-0003-3
Ricci, J. C., Mathon, J. F., García, A., Berger, F., and Esteve, J. P. (1990). Effect of habitat structure and nest site selection on nest predation in red-legged partridges (Alectoris rufa L.) in French Mediterranean farm-lands. Gibier, Faune Sauvage 7, 231–253.
Rivera, M. (1991). Caza y agricultura en zonas de montaña. Agricultura y
http://www.publish.csiro.au/journals/wr Robertson, P. A., and Rosenberg, A. A. (1988). Harvesting gamebirds. In
‘Ecology and Management of Gamebirds’. (Eds P. J. Hudson and M. R. W. Rands.) pp. 177–201. (BSP Professional Books: Oxford.) Santos, P., Mexia-de-Almeida, L., and Petrucci-Fonseca, F. (2004). Habitat
selection by wild boar Sus scrofa L. in Alentejo, Portugal. Galemys 16, 167–184.
Thuiller, W., Richardson, D. M., Pysek, P., Midgley, G. F., Hughes, G. O., and Rouget, M. (2005). Niche-based modelling as a tool for predicting the risk of alien plant invasions at a global scale. Global Change Biology
11, 2234–2250. doi:10.1111/j.1365-2486.2005.001018.x
US Geological Survey (1996). GTOPO30. Land Processes Distributed Archive Center, http://edcdaac.usgs.gov/gtopo30/gtopo30.asp. Valverde, A. J. (1984). Estructura de una comunidad mediterránea de
verte-brados terrestres. Monográficas CSIC, 76. 219 p.
Vargas, J. M. (2002). ‘Alerta cinegética. Reflexiones sobre el Futuro de la Caza en España.’ (Otero: Madrid.)
Vargas, J. M., Farfán, M. A., Guerrero, J. C., and Real, R. (2004). Caracterización de los aprovechamientos cinegéticos a escala macro-espacial: un ejemplo aplicado a la provincia de Granada (sur de España).
Ecología 18, 53–70.
Vargas, J. M., Guerrero, J. C., Farfán, M. A., Barbosa, A. M., and Real, R. (2006). Land use and environmental factors affecting red-legged par-tridge (Alectoris rufa) hunting yields in southern Spain. European
Journal of Wildlife Research 52, 188–195.
doi:10.1007/s10344-006-0028-4
Wald, A. (1943). Tests of statistical hypotheses concerning several para-meters with applications to problems of estimation. Transactions of the
American Mathematical Society 54, 426–482. doi:10.2307/1990256
Zambrana, J. F., Titos, M., Fernández, M., Garrués, J., Heredia, V., Hernández, S., Lizárraga, C., Martín, M., Parejo, A., and Pellejero, C. (2002). ‘Estadísticas del Siglo XX en Andalucía.’ (Instituto de Estadística de Andalucía: Sevilla.)
Zamora, M., Barasona, J., and Medina, M. (1976). Aportación al conocimiento del nuevo sistema agrario de las tierras marginales.
Archivos de Zootecnia 97, 39–50.