ISSN 1678-457X (Online) Food Science and Technology
OI:
D http://dx.doi.org/10.1590/1678-457X.36616
1 Introduction
The major cereal products available to consumers are bakery foods (Chung & Pomeranz, 1983; Dar et al., 2016). Flat breads have been the oldest and well known bread types of the world. More than 1.8 billion people use flat breads in different regions of India, Central America, Scandinavia, South Europe, South Africa, Middle East and parts of China (Malik et al., 2016). Unleavened flat bread or chapati is the staple diet of majority of people living in the Indian subcontinent (Sandhu et al., 2007; Nazir & Nayik, 2016). It is made by mixing the flour and water to develop dough, after relaxing dough balls are sheeted to a uniform thickness of around 2 mm and baked for a short time. It is usually consumed fresh (Gujral & Pathak, 2002). There is an increase in consumer demand for nutritious and healthy baked foods with good sensorial properties that has led to considerable efforts for the development of such foods (Pardhi et al., 2016). One such novel effort is the use of composite flours for making flat breads (Bhol & Bosco, 2014). Cereal grains have been the most important plant group for the human diet (Sharma et al., 2016). Maize (Zea mays L.) is a third leading crop of the world after rice and wheat (Sandhu et al., 2007). About 35% of maize is consumed in the form of unleavened flat breads which are eaten mainly in few Northern states of India (Mehta & Dias, 1999). Maize chapati with sarson ka saag is very popular and commonly consumed in Punjab (India) (Priya & Verma, 2010). Maize grain contains vitamin K, vitamin E vitamin C, vitamin B1 (thiamine), vitamin B2 (riboflavin), vitamin B3 (niacin), vitamin B5 (pantothenic acid), vitamin B6 (pyridoxine), potassium, folic acid and selenium (Kumar & Jhariya, 2013). It has major phytochemicals such as carotenoids, phenolic compounds and
phytosterols that reduce the risk of major chronic diseases in humans (Kopsell et al., 2009). It is believed to have potential against HIV due to the presence of Galanthus nivalis agglutinin (GNA) lectin also referred as GNA-maize (Hoorelbekeet al., 2011). Resistant starch (RS) from maize also called as high-amylose maize reduces symptoms of diarrhea, cecal cancer, atherosclerosis and obesity- related complications (Murphy et al., 2008). Maize is an appropriate food for patients suffering from celiac disease which is a digestive disorder in which the villi in small intestine get damaged due to an immunological reaction to gluten (Elite & Bello, 2008). Maize is deficient in lysine but has adequate amounts of sulfur-containing amino acids (cysteine and methionine) while as legumes are rich in lysine and deficient in sulfur-containing amino acids. Mixing of cereal with legume will balance the amino acids and may also improve the nutritive value of cereal based food products (Abdelrahman et al., 2012). Therefore legumes can be successfully used in breads to obtain protein-enriched products with improved amino acid balance (Aghamirzaei et al., 2013). Asparagus bean (Vigna unguiculata subsp. sesquipedalis) is an edible legume commonly known as “loung” in Kashmir (India). It is an important source of dietary protein. The mature seeds are consumed in many ways such as whole or dehulled, cooked in boiling water for some time, which are then consumed after addition of seasonings. Its functional properties are similar to those of cowpea and soy bean (Nwosu, 2011). However asparagus bean is underutilized in different food formulations. There is no study till date done on the supplementation of maize flour with asparagus bean flour for the development of flat bread. Moreover the information
Development and parameter optimization of maize flat bread supplemented with
asparagus bean flour
Tajamul Rouf SHAH1*, Kamlesh PRASAD1, Pradyuman KUMAR1
Received 26 Jan., 2017 Accepted 15 Apr., 2017
1Department of Food Engineering and Technology, Sant Longowal Institute of Engineering and Technology, Longowal, Punjab, India
*Corresponding author: [email protected]
Abstract
The purpose of this study was to develop maize flat bread supplemented with asparagus bean flour (ABF). Preliminary study was conducted for maximum supplementation of ABF on the basis of sensory attributes and it was found that 15% ABF can be supplemented. Further a composite flour containing 85% maize flour (MF) and 15% ABF was used for the preparation of flat bread. The effect of baking temperature (200 to 235 °C) and baking time [time 1 (surface 1) and time 2 (surface 2)] (70 to 120 sec) on product responses such as sensory characteristics (overall color, appearance, flavor, taste, mouth feel, overall acceptability), texture (shear value) and moisture content were studied. Results indicated that baking temperature and baking time had significant (p < 0.05) positive effect on sensory characteristics and shear value, while significant (p < 0.05) negative effect on moisture content. Numerical optimization resulted in baking temperature 225 °C, baking time 1 (120 sec) for surface 1 and time 2 (116 sec) for surface 2 to develop a flat bread with best quality.
Keywords: maize flat bread; asparagus bean; baking temperature; baking time; sensory; optimization.
on the development of maize flat breads is also very scanty. Therefore the combination of maize with asparagus bean flour would provide better overall essential amino acid balance in the developed product and subsequently can overcome the protein calorie malnutrition problems. By considering these facts the present study was undertaken to optimize asparagus bean and maize flour as well as process conditions such as baking temperature and baking time for the development of flat bread.
2 Materials and methods
Maize (Zea mays var. C-15) was obtained from Sher-e-Kashmir University of Agricultural Sciences and Technology, Shalimar, Srinagar, J&K, India. Asparagus beans or seeds (Vigna unguiculata
ssp. sesquipedalis) were purchased from a local farmer at Pulwama, J&K, India. Both maize grains and asparagus beans were cleaned, made free from dust and other foreign materials. Maize grains were milled in a stone mill (S.V. Industries Pvt. Ltd., Ajmer, India) and passed through sieve no. 60 (British Sieve Standards) to obtain fine flour. To produce asparagus bean flour the seeds were dehulled in abrasion type dehulling machine (Osaw Industrial Products Pvt. Ltd., Ambala, India) and ground on a stone mill (S.V. Industries Pvt. Ltd., Ajmer, India) and then passed through sieve no. 60. The flour samples were then packed in air-tight containers until further use.
2.1 Preliminary study
Preparation of composite flour
The composite flour blends were prepared by supplementing maize flour (MF) with asparagus bean flour (ABF) at different levels (5%, 10%, 15%, 20%, 25% and 30%) respectively as shown in Table 1.
Preparation of flat bread
Flat bread was prepared from each composite flour combination by following the method reported by previous researchers with slight modifications (Gujral & Gaur, 2002; Rao et al., 1986). Each combination was mixed with optimum water in a Hobart bench top mixer (5KPM50, USA) for 3 min. The optimum water was determined subjectively till smooth, cohesive, non- sticky dough which is easy to handle and suitable for continuous sheeting without cracking was obtained. The dough was given
a rest for half an hour. Dough (50g) was rounded, placed in the centre of a specially designed platform. In order to facilitate the rolling of dough to a uniform thickness of 2mm, an open rectangular aluminum frame was used. The dough was rolled with the help of a wooden rolling pin. The length of rolling pin exceeded the width of frame; therefore roller force was applied to the dough only when its thickness exceeded the height of the frame. The frame was placed in the groove provided on the flat form. The dough sheet was then cut into a circle of 15 cm in diameter by using a die with sharp edge. The raw flat bread was carefully removed from the platform and baked on both surfaces on a thermostatically controlled hot plate. It was allowed to cool for 10 min at 25 °C and used for further analysis.
Sensory analysis
Sensory analysis of flat breads prepared from each supplementation level was conducted based on overall color, appearance, flavor, taste, mouth feel and overall acceptability in order to find the best composite flour (MF: ABF) combination for the development of optimum flat bread. Eighty-five semi-trained and untrained panelists comprising students from the Department of Food Engineering and Technology, Sant Longowal Institute of Engineering and Technology, Punjab analyzed the flat breads. Flat bread samples were presented on a white paper labeled with random alphabet to the sensory panelists which were asked to evaluate the sensory attributes of the samples and rate each attribute. A nine-point hedonic scale with 1 that stands for “extremely disliking”, 9 stands for “like extremely” and 5 stands for “neither like nor dislike”, was used (Yadav et al., 2009).
2.2 Detailed study
Response surface methodology (RSM) was used in the design of experimental combinations (Wani & Kumar, 2016). Each independent variable viz baking temperature (200 to 235 °C) and baking time (time 1 and time 2) (70 to 120 sec) for surface 1 and surface 2 of flat bread was selected according to the preliminary trials and literature data (Rao et al., 1986). On the basis of preliminary study a combination of 85% (MF) and 15% (ABF) was selected and the optimum water level of 75 ml per 100 g of composite flour was taken for making dough. Flat bread was baked on both surfaces. Box Behnken design was used to
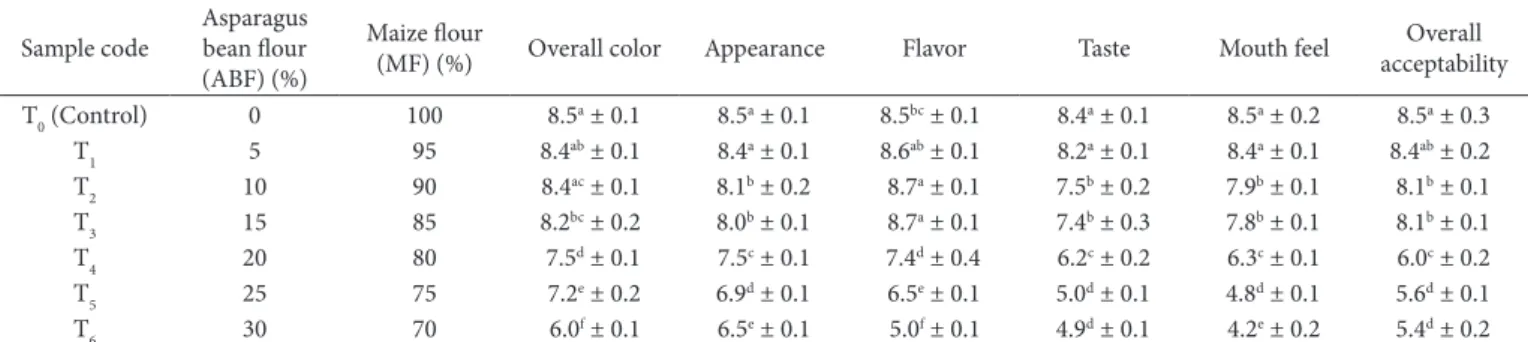
Table 1. Sensory evaluation of flat bread with different supplementation levels of Asparagus bean flour (ABF).
Sample code
Asparagus bean flour (ABF) (%)
Maize flour
(MF) (%) Overall color Appearance Flavor Taste Mouth feel
Overall acceptability T0 (Control) 0 100 8.5a ± 0.1 8.5a ± 0.1 8.5bc ± 0.1 8.4a ± 0.1 8.5a ± 0.2 8.5a ± 0.3
T1 5 95 8.4ab ± 0.1 8.4a ± 0.1 8.6ab ± 0.1 8.2a ± 0.1 8.4a ± 0.1 8.4ab ± 0.2
T2 10 90 8.4ac ± 0.1 8.1b ± 0.2 8.7a ± 0.1 7.5b ± 0.2 7.9b ± 0.1 8.1b ± 0.1
T3 15 85 8.2bc ± 0.2 8.0b ± 0.1 8.7a ± 0.1 7.4b ± 0.3 7.8b ± 0.1 8.1b ± 0.1
T4 20 80 7.5d ± 0.1 7.5c ± 0.1 7.4d ± 0.4 6.2c ± 0.2 6.3c ± 0.1 6.0c ± 0.2
T5 25 75 7.2e ± 0.2 6.9d ± 0.1 6.5e ± 0.1 5.0d ± 0.1 4.8d ± 0.1 5.6d ± 0.1
optimize baking temperature, baking time1 (surface 1) and time 2 (surface 2) combinations and a total of 17 experimental runs as shown in Table 2 were carried out for the development of flat bread. The product responses of moisture, shear value, and sensory analysis were studied.
Moisture content
Moisture content was determined as per the methods of Association of Official Analytical Chemists (2005). The analysis was conducted in triplicates and average values were taken.
Shear value
Shear value was measured by texture analyzer (TA-XT2, Stable Micro systems, UK) by using the Warner Bratzler blade (HDP/BSW). Rectangular strips measuring 4cm × 2cm were cut out from each flat bread. The force required to shear the flat bread strip into two pieces was recorded. The following conditions were used: load cell of 50 kg, target mode distance of 4.5 mm, pre-test speed of 1 mm/sec, test speed of 2mm/sec, post test speed of 10 mm/sec and trigger force of 10 g. Three measurements were taken for each sample and average values are reported.
Sensory analysis
Sensory analysis was carried as per the method described above in the preliminary study.
2.3 Statistical analysis
Statistical analysis was carried out by using a statistical package, Design-Expert version 6.0.10 (Stat-Ease Inc., Minneapolis, USA). Statistical significance of terms was evaluated by analysis
of variance for each response. Each sample was analyzed in triplicates and average values are reported.
3 Results and discussion 3.1 Preliminary study
Table 1 shows the sensory score of flat breads prepared from composite (MF: ABF) flours. From the results it was found that at 5% ABF supplementation level (T1), all the sensory parameters differ non-significantly with respect to the control flat bread (T0) except for overall color which had a non-significant difference up to 10% supplementation level (T2). Over all color value for control was 8.5. As the supplementation level of ABF increased above 10%, overall color score significantly (p < 0.05) decreased from 8.2 to 6.0 with respect to control. The decrease in overall color score may be attributed to Maillard reaction between reducing sugars and protein (Raidi & Klein, 1983; Hallen, et al., 2004). Appearance score for control was 8.5. There was a significant (p < 0.05) decrease in appearance score from 8.1 to 6.5 at more than 5% supplementation level of ABF. The decrease in appearance score may be due to an increase in the supplementation level. Cheng & Bhat (2016) reported a decrease in the appearance of wheat-jering composite flat breads while increasing the jering seed flour incorporation into the formulations. Flavor score for control was 8.5. There was a significant (p < 0.05) increase in the flavor score of 8.7 up to 15% supplementation level (T3).The increase in flavor indicates a better flavor rating, thereafter the flavor score decreased significantly (p < 0.05) from 7.4 to 5.0 in remaining flat breads. The decrease in the flavor score may be due to the characteristic flavor of ABF. Dhingra & Jood (2001) observed that the flavor of breads increased on increasing the level of barley and soy flour up to 10% level and then it decreased at
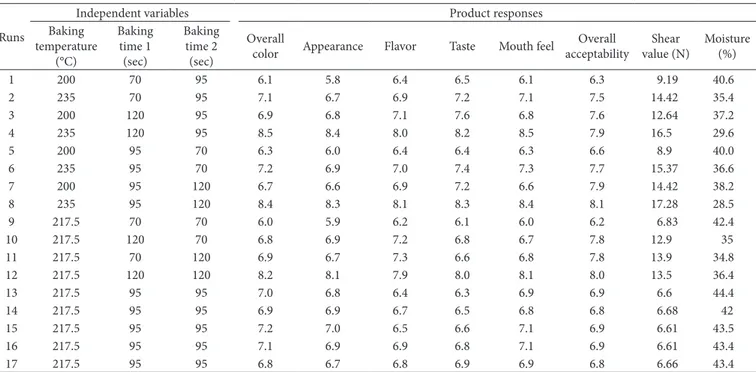
Table 2. Effect of independent variables on the product responses of maize-asparagus bean flour based flat bread.
Runs
Independent variables Product responses
Baking temperature
(°C)
Baking time 1
(sec)
Baking time 2
(sec)
Overall
color Appearance Flavor Taste Mouth feel
Overall acceptability
Shear value (N)
Moisture (%)
1 200 70 95 6.1 5.8 6.4 6.5 6.1 6.3 9.19 40.6
2 235 70 95 7.1 6.7 6.9 7.2 7.1 7.5 14.42 35.4
3 200 120 95 6.9 6.8 7.1 7.6 6.8 7.6 12.64 37.2
4 235 120 95 8.5 8.4 8.0 8.2 8.5 7.9 16.5 29.6
5 200 95 70 6.3 6.0 6.4 6.4 6.3 6.6 8.9 40.0
6 235 95 70 7.2 6.9 7.0 7.4 7.3 7.7 15.37 36.6
7 200 95 120 6.7 6.6 6.9 7.2 6.6 7.9 14.42 38.2
8 235 95 120 8.4 8.3 8.1 8.3 8.4 8.1 17.28 28.5
9 217.5 70 70 6.0 5.9 6.2 6.1 6.0 6.2 6.83 42.4
10 217.5 120 70 6.8 6.9 7.2 6.8 6.7 7.8 12.9 35
11 217.5 70 120 6.9 6.7 7.3 6.6 6.8 7.8 13.9 34.8
12 217.5 120 120 8.2 8.1 7.9 8.0 8.1 8.0 13.5 36.4
13 217.5 95 95 7.0 6.8 6.4 6.3 6.9 6.9 6.6 44.4
14 217.5 95 95 6.9 6.9 6.7 6.5 6.8 6.8 6.68 42
15 217.5 95 95 7.2 7.0 6.5 6.6 7.1 6.9 6.61 43.5
16 217.5 95 95 7.1 6.9 6.9 6.8 7.1 6.9 6.61 43.4
15 and 20% of supplementation due to the beany flavor of soybean flour. Taste score for control was 8.4. The significant (p < 0.05) decrease in taste score from 7.5 to 4.9 was found in flat breads having more than 5% supplementation level of ABF. The decrease in taste may be attributed to the beany flavor of ABF. Mouth feel score for control was 8.5. The score significantly(p < 0.05)decreased from 7.9 to 4.2 at 10 (T2) to 30% supplementation level (T6).The decrease in mouth feel score may be attributed to gradual loss in chewiness with an increase in supplementation level of ABF. Overall acceptability for control was 8.5. There was a significant (p < 0.05)decrease in overall acceptability score from 8.1 to 5.4 in flat breads having more than 5% ABF supplementation. According to the overall acceptability score inclusion of 15% supplementation of ABF in maize flat bread could be accepted and further increase in ABF level would not give better consumer acceptance. Hence a composite flour combination containing 85% MF and 15% ABF was selected as per the recommendations by sensory panelists.
3.2 Detailed study
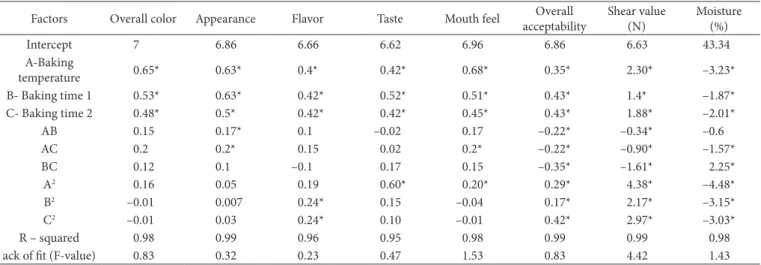
On the basis of observations obtained from the preliminary study a composite flour (85% MF: 15% ABF) was selected for further study. The flat bread was prepared by varying baking temperature and baking time for surface 1 and surface 2 and the results of product responses are shown in Table 2. Data was statistically analyzed and results of regression analysis are shown in Table 3. The regression models for sensory analysis (overall color, appearance, flavor, taste, mouth feel, overall acceptability), shear value and moisture were significant (p < 0.05) with coefficient of determination value (R2) 0.98, 0.99, 0.96, 0.95, 0.98, 0.99, 0.99 and 0.98 respectively. Moreover lack of fit indicated that none of the models were significant (p < 0.05). All the second order polynomials correlated well with the measured data and were statistically significant (p < 0.05).
Sensory analysis
Overall color
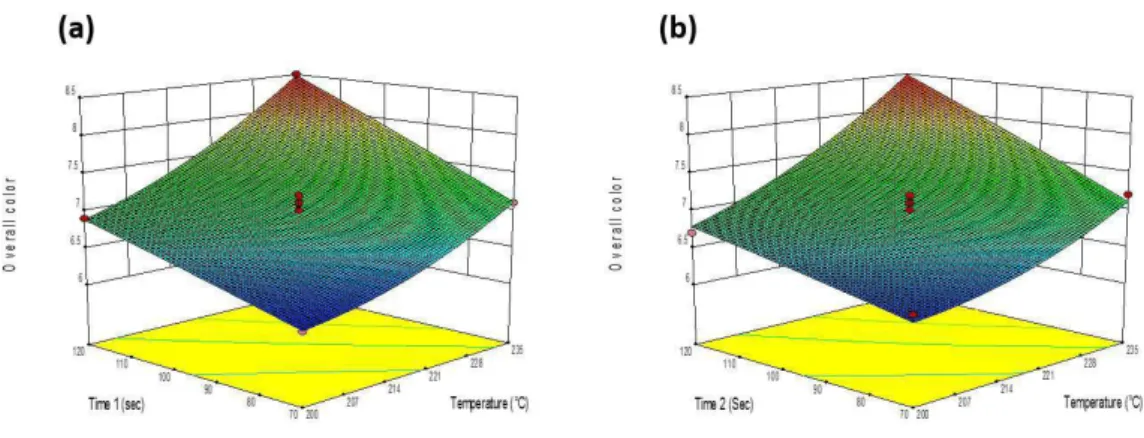
Overall color has an important role in the consumer’s perception related to the acceptability of product. The score range of overall color of flat breads ranged from 6.0 to 8.5 (Table 2). The regression analysis showed that baking temperature and baking time had significant (p < 0.05) positive linear effect on overall color of flat bread (Table 3). It was observed from the response plots (Figure 1a, b) that with increase in baking temperature and baking time, overall color also increased. This is because the panelists prefer flat breads with slightly darker color (Cheng & Bhat, 2016).The darker overall color may be due to the maillard reaction between reducing sugar and proteins (Raidi & Klein, 1983).
Appearance
Appearance of flat bread should be appealing with light brown spots spread evenly over its surface. The appearance score ranged from 5.8 to 8.4 (Table 2). The regression analysis showed that baking temperature and baking time had significant (p < 0.05) positive linear effect on appearance of flat bread (Table 3). It was observed from the response plots (Figure 2a, b) that with increase in baking temperature and baking time, appearance also increased, may be due to the formation of desired uniform light brown spots over the surface (Rao et al., 1986).
Flavor
The flavor score ranged from 6.2 to 8.1 (Table 2). From the regression analysis report it was found that baking temperature and baking time had a significant (p < 0.05) positive linear effect on flavor score of flat bread (Table 3). It was found from the response plots (Figure 3a, b) that with an increase in baking temperature and baking time flavor also increased, thus indicating a better flavor rating during baking.
Table 3. Results of regression analysis of product responses.
Factors Overall color Appearance Flavor Taste Mouth feel Overall acceptability
Shear value (N)
Moisture (%)
Intercept 7 6.86 6.66 6.62 6.96 6.86 6.63 43.34
A-Baking
temperature 0.65* 0.63* 0.4* 0.42* 0.68* 0.35* 2.30* –3.23*
B- Baking time 1 0.53* 0.63* 0.42* 0.52* 0.51* 0.43* 1.4* –1.87*
C- Baking time 2 0.48* 0.5* 0.42* 0.42* 0.45* 0.43* 1.88* –2.01*
AB 0.15 0.17* 0.1 –0.02 0.17 –0.22* –0.34* –0.6
AC 0.2 0.2* 0.15 0.02 0.2* –0.22* –0.90* –1.57*
BC 0.12 0.1 –0.1 0.17 0.15 –0.35* –1.61* 2.25*
A2 0.16 0.05 0.19 0.60* 0.20* 0.29* 4.38* –4.48*
B2 –0.01 0.007 0.24* 0.15 –0.04 0.17* 2.17* –3.15*
C2 –0.01 0.03 0.24* 0.10 –0.01 0.42* 2.97* –3.03*
R – squared 0.98 0.99 0.96 0.95 0.98 0.99 0.99 0.98
ack of fit (F-value) 0.83 0.32 0.23 0.47 1.53 0.83 4.42 1.43
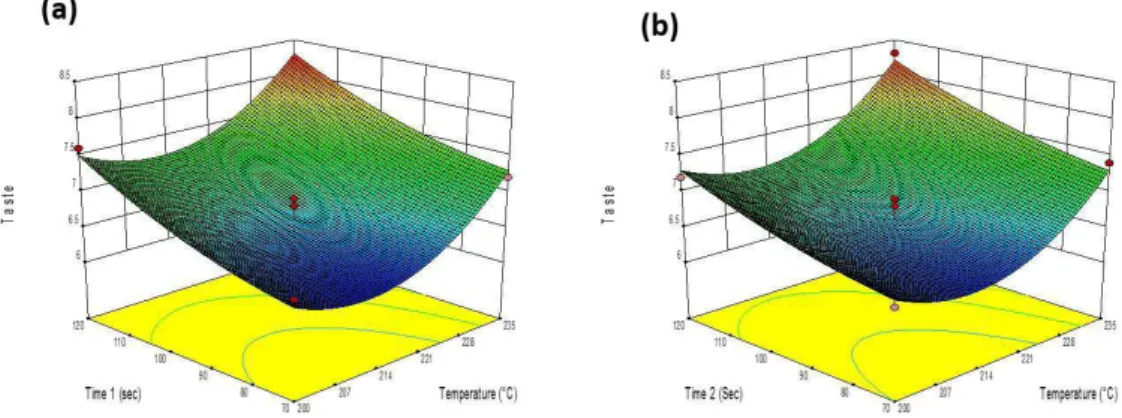
Taste
Typically flat bread should have a little sweetish taste. The taste score ranged from 6.1 to 8.3 (Table 2). Regression analysis report showed that baking temperature and baking time had a significant (p < 0.05) positive linear effect on taste score of flat bread (Table 3). It was found from the response plots (Figure 4a, b) that with an increase in baking temperature and baking time, taste also increased. Rao et al. (1986) also
reported higher scores in the taste of flat bread with an increase in temperature and time during baking.
Mouth feel
Mouth feel should be pleasant with little chewiness. The score of mouth feel ranged from 6.0 to 8.5 (Table 2). The regression analysis showed that baking temperature and baking time had significant (p < 0.05) positive linear effect on mouth feel of
Figure 1. Response surface plot for overall color as a function of (a) baking temperature and baking time 1 (b) baking temperature and baking time 2.
Figure 2. Response surface plot for appearance as a function of (a) baking temperature and baking time 1 (b) baking temperature and baking time 2.
and baking time had significant (p < 0.05) positive linear effect on overall acceptability of flat bread (Table 3). It was observed from the response plots (Figure 6a, b) that with increase in baking temperature and baking time, overall acceptability also increased due to improvement in overall characteristics of flat bread.
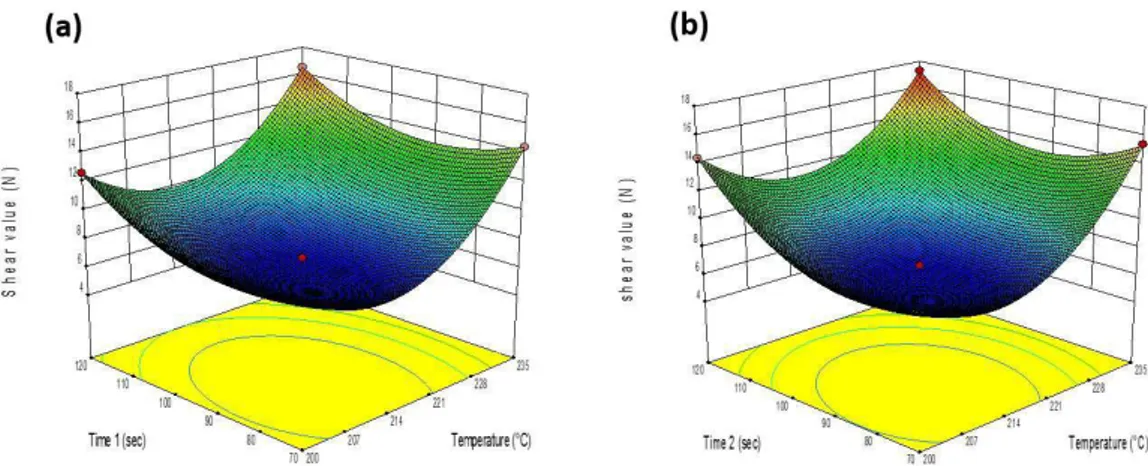
Shear value
Shear value is an important factor in bakery products and is strongly related with the consumer’s perception of bread freshness. The shear value score ranged from 6.6 to 17.28 N flat bread (Table 3). It was observed from the response plots
(Figure 5a, b) that with increase in baking temperature and baking time, mouth feel also increased. This may be due to an improvement in eating quality of flat bread during baking (Rao et al., 1986).
Overall acceptability
Over all acceptability determines the final acceptability of the product. The overall acceptability score ranged from 6.2 to 8.1 (Table 2). The regression analysis showed that baking temperature
Figure 4. Response surface plot for taste as a function of (a) baking temperature and baking time 1 (b) baking temperature and baking time 2.
Figure 5. Response surface plot for mouth feel as a function of (a) baking temperature and baking time 1 (b) baking temperature and baking time 2.
(Table 2). The regression analysis showed that baking temperature and baking time had significant (p < 0.05) positive linear effect on shear value of flat bread (Table 3). It was observed from the response plots (Figure 7a, b) that with increase in baking temperature and baking time, shear value also increased. It is because the hardness of flat bread samples increased with increasing baking temperature and baking time, perhaps as a result of high rate of water evaporation from the surface of the bread during the baking (Ahlborn et al., 2005).
Moisture content
The moisture content of the flat bread samples ranged from 28.5 to 44.4% (Table 2). The regression analysis showed that baking temperature and baking time had significant (p < 0.05) negative linear effect on moisture content of flat bread (Table 3). It was observed from the response plots (Figure 8a, b) that with increase in temperature and time moisture content decreased. This could be due to the evaporation of water content in the dough during baking (Peluola-Adeyemi et al., 2016).
4 Optimization
The numerical multi-response optimization technique of RSM was used to determine the optimum combination of baking temperature and baking time for the production of maize flat bread supplemented with ABF. The desired goals for each independent variable and response were taken as: independent variables viz temperature, time 1 and time 2 were kept in range, responses viz sensory analysis (overall color, appearance, flavor, taste, mouth feel, overall acceptability) were kept maximum, shear value was kept minimum and moisture content was kept in range based on desirable characteristics of flat bread. Numerical response analysis showed that, baking temperature (225 °C), baking time 1 (120 sec for surface 1) and time 2 (116 sec for surface 2) gave an optimized product with 0.82 desirability. The optimized response values found were overall color 8.5, appearance 8.4, flavor 8.1, taste 8.1, mouth feel 8.4, overall acceptability 7.8, shear value 14 N and moisture 33%.The optimized solution satisfied all the constraints for the development of best quality maize flat bread supplemented with ABF.
Figure 7. Response surface plot for shear value (N) as a function of (a) baking temperature and baking time 1 (b) baking temperature and baking time 2.
Elite, K. A., & Bello, D. F. (2008). The gluten free cereal products and
beverages. Amsterdam: Elsevier.
Gujral, H. S., & Gaur, S. (2002). Effects of barley flour, wet gluten and liquid shortening on the texture and storage characteristics of
chapati. Journal of Texture Studies, 33(5), 461-469. http://dx.doi.
org/10.1111/j.1745-4603.2002.tb01360.x.
Gujral, H. S., & Pathak, A. (2002). Effect of composite flours and
additives on the texture of chapati. Journal of Food Engineering,
55(2), 173-179. http://dx.doi.org/10.1016/S0260-8774(02)00061-4. Hallen, E., Ibanoglu, S., & Ainsworth, P. (2004). Effect of fermented/
germinated cowpea flour addition on the rheological and baking
properties of wheat flour. Journal of Food Engineering, 63(2),
177-184. http://dx.doi.org/10.1016/S0260-8774(03)00298-X.
Hoorelbeke, B., Van Damme, E. J., Rouge, P., Schols, D., Van Laethem, K., Fouquaert, E., & Balzarini, J. (2011). Differences in the mannose oligomer specifities of the closely related lectins from Galanthus nivalis and Zea mays strongly determine their eventual anti-HIV
activity. Retrovirology, 8(1), 1742-4690. PMid:21314946. http://
dx.doi.org/10.1186/1742-4690-8-10.
Kopsell, D. A., Armel, G. R., Mueller, T. C., Sams, C. C., Deyton, D. E., Mcelroy, J. S., & Kopsell, D. E. (2009). Increase in nutritionally important sweet corn kernel carotenoids following mesotrione and
atrazine applications. Journal of Agricultural and Food Chemistry,
57(14), 6362-6368. PMid:19537793. http://dx.doi.org/10.1021/ jf9013313.
Kumar, D., & Jhariya, N. A. (2013). Nutritional, medicinal and
economical importance of corn: a mini review. Research Journal of
Pharmaceutical Sciences, 2, 7-8.
Malik, H., Nayik, G. A., & Dar, B. N. (2016). Optimization of process for development of nutritionally enriched multigrain bread.
Journal of Food Processing & Technology, 7(01), 1. http://dx.doi.
org/10.4172/2157-7110.1000544.
Mehta, D. C., & Dias, F. F. (1999). Maize: perspectives and applications
in India. Stärke, 51(2-3), 52-57.
http://dx.doi.org/10.1002/(SICI)1521-379X(199903)51:2<52::AID-STAR52>3.0.CO;2-I.
Murphy, M. M., Douglass, J. S., & Birkett, A. (2008). Resistant starch
intakes in the United States. Journal of the American Dietetic
Association, 108(1), 67-78. PMid:18155991. http://dx.doi.org/10.1016/j.
jada.2007.10.012.
Nazir, F., & Nayik, G. A. (2016). Impact of wheat-barley blending on rheological, textural and sensory attributes of leavened bread.
Journal of Food Processing & Technology, 7(8), 8. http://dx.doi.
org/10.4172/2157-7110.1000611.
Nwosu, J. N. (2011). Proximate composition and acceptability of
moin-moin made from cowpea (Vigna unguiculata) and asparagus bean
seed (Vigna sesquipedalis).World Rural Observations, 3(3), 1-5.
Pardhi, S. D., Singh B., Nayik, G. A., & Dar, B. N. (2016). Evaluation of Functional Properties of Extruded Snacks developed from
brown rice grits by using Response Surface Methodology. Journal
of the Saudi Society of Agricultural Sciences. In Press. http://dx.doi.
org/10.1016/j.jssas.2016.11.006.
Peluola-Adeyemi, O. A., Obi, T. E., & Ugbogu, D. I. (2016). Effect of temperature and time on the physical properties of bread produced from wheat: cocoyam flour using response surface methodology.
Journalof Food Technology Research, 3, 63-71.
Priya, K., & Verma, S. (2010). Organoleptic evaluation of recipes based
on maize flour. Journal of Food Science and Research, 1, 72-75.
Raidi, M. A., & Klein, B. P. (1983). Effect of soy or field pea flour substitution on physical and sensory characteristics of chemically
leavened quick breads. Cereal Chemistry, 60, 367-370.
5 Conclusions
Different experimental runs were conducted to study the effect of process conditions viz baking temperature, baking time 1 and baking time 2 on quality characteristics of maize flat bread supplemented with ABF. All the responses were significantly affected by the process conditions. The response surface methodology was found to be successful in determining the optimum process conditions for the production of best quality flat bread with desirable properties of all the responses. The processing conditions such as, baking temperature 225 °C, baking time 1 (120 sec) for surface 1 and baking time 2 (116 sec) for surface 2 were recommended for the development of best quality flat bread.
Acknowledgements
The first author is very thankful to Ministry of Science & Technology, Department of Science & Technology, Technology Bhavan, New Delhi for awarding INSPIRE fellowship.
References
Abdelrahman, I. M., Ahmed, R., & Senge, B. (2012). Dough rheology
and bread quality of wheat-chickpea flour blends. Journal of Industrial
Crops and Products, 36(1), 196-202. http://dx.doi.org/10.1016/j.
indcrop.2011.09.006.
Aghamirzaei, M., Dalfard, A. H., Karami, F., & Fathi, M. (2013). Pseudo-cereals as a functional ingredient: effects on bread nutritional and
physiological properties: review. International Journal of Agriculture
and Crop Sciences, 5(14), 1574-1580.
Ahlborn, G. J., Pike, O. A., Hendrix, S. B., Hess, W. M., & Huber, C. S. (2005). Sensory mechanical and microscopic evaluation of staling
in low-protein and gluten-free breads. Cereal Chemistry, 82(3),
328-335. http://dx.doi.org/10.1094/CC-82-0328.
Association of Official Analytical Chemists – AOAC. (2005). Official
methods of analysis of the AOAC International (18th ed.). Gaithersburg:
AOAC.
Bhol, S., & Bosco, S. J. D. (2014). Influence of malted finger millet and red kidney bean flour on quality characteristics of developed bread.
LWT-Food Science and Technology, 55(1), 294-300. http://dx.doi.
org/10.1016/j.lwt.2013.08.012.
Cheng, Y. F., & Bhat, R. (2016). Physicochemical and sensory quality evaluation of chapati (Indian flat bread) produced by utilizing
underutilized jering (Pithecellobium jiringa Jack.) legume and
wheat composite flours. International Food Research Journal, 22(6),
2244-2252.
Chung, O. K., & Pomeranz, Y. (1983). Recent trends in usage of fats
and oil as function ingredients in the baking industry. Journal of
the American Oil Chemists’ Society, 60(11), 1848-1851. http://dx.doi.
org/10.1007/BF02901536.
Dar, B. N., Sharma, S., & Nayik, G. A. (2016). Effect of storage period on physiochemical, total phenolic content and antioxidant
properties of bran enriched snacks. Journal of Food Measurement
and Characterization, 10(4), 755-761. http://dx.doi.org/10.1007/
s11694-016-9360-x.
Dhingra, S., & Jood, S. (2001). Organoleptic and nutritional evaluation of wheat breads supplemented with soybean and barley flour.
Food Chemistry, 77(4), 479-488.
Food Science, 12(2), 142-149. http://dx.doi.org/10.2174/1573 401312666160323000523.
Wani, S. A., & Kumar, P. (2016). Fenugreek enriched extruded product: optimization of ingredients using response surface methodology.
International Food Research Journal, 23(1), 18-25.
Yadav, D. N., Petki, P. E., Sharma, G. K., Srihari, K. A., Harilal, P. T., & Bawa, A. S. (2009). Rheological and sensory quality of ready-to-bake
chapatti during frozen storage. Journal of Food Quality, 32(4),
436-451. http://dx.doi.org/10.1111/j.1745-4557.2009.00256.x. Rao, P. H., Leelavathi, K., & Shurpalekar, S. R. (1986). Test baking of
chapatti: development of a method. Cereal Chemistry, 63, 297-303.
Sandhu, K. S., Singh, N., & Malhi, N. S. (2007). Some properties of corn grains and their flours: physicochemical, functional and
chapati-making properties of flours. Food Chemistry, 101(3), 938-946. http://
dx.doi.org/10.1016/j.foodchem.2006.02.040.
Sharma, S., Dar, B. N., Nayik, G. A., & Kaur, G. (2016). Total Phenolic Content and Antioxidant activity of Cereal bran