RESUMO.- [Eletrocardiografia computadorizada em co -baios (Cavia porcellus) saudáveis e conscientes.] O ob-jetivo desse estudo foi avaliar cobaios hígidos e conscientes como modelos para estudos de eletrofisiologia e descrever os padrões eletrocardiográficos normais em ambiente labo -ratorial controlado, estabelecendo a melhor fórmula QT para esse método. Gravações eletrocardiográficas de cinquenta cobaios adultos conscientes foram obtidas usando eletrocar-diografia computadorizada. As medidas eletrocardiográficas de três trechos diferentes foram analisadas. Os resultados estabeleceram média e desvio padrão para os parâmetros: frequência cardíaca, ondas e intervalos P-QRS-T, assim como
o eixo cardíaco médio. Grupos foram separados de acordo com o peso: grupo 1 incluiu animais com 500-699g e o gru-po 2 animais de 700-900g. Nenhuma diferença foi encontra-da quando as mediencontra-das foram comparaencontra-das entre os grupos, mostrando que não há diferença significativa entre peso/ tamanho corporal com os parâmetros eletrocardiográficos (p<0.05). As médias corrigidas dos valores do QT (QTc) ob -tidas usando diferentes fórmulas foram significativamente diferentes (p<0.05), sendo a mais consistente a de Van der Water (QTcV). Valores de QTcV fortemente correlacionam com o QT (r=98), com intervalo de confiança a 95% de 185.7 a 195.2 ms. Considerando a simplicidade e confiabilidade, o QTcV foi considerado apropriado para correção do intervalo QT em cobaios conscientes. Os resultados do presente estu-do também sugerem que os valores encontraestu-dos possam ser utilizados como referência para essa espécie.
TERMOS DE INDEXAÇÃO: Cobaios, eletrocardiograma, ECG com
-putadorizado, conscientes.
Computerized electrocardiography in healthy conscious
guinea pigs (Cavia porcellus)
1Ana F.M. Botelho2*, Maira S. de Oliveira2, Benito Soto-Blanco2 and Marília M. Melo2
ABSTRACT.- Botelho A.F.M., Oliveira M.S., Soto-Blanco B. & Melo M.M. 2016. Computeri -zed electrocardiography in healthy conscious guinea pigs (Cavia porcellus).Pesquisa Veterinária Brasileira 36(12):1203-1208. Departamento de Clínica e Cirurgia Veterinárias,
Escola de Veterinária, Universidade Federal de Minas Gerais, Av. Presidente Antônio Carlos 6627, Belo Horizonte, MG 31275-013, Brazil. E-mail: [email protected]
The purpose of this study is to evaluate healthy conscious guinea pigs as a model for electrophysiology assessment and to describe normal electrocardiographic patterns in controlled laboratory environment, establishing the best QT formula for this method. Elec-trocardiographic recordings of fifty adult conscious guinea pigs were obtained using a com -puterized electrocardiography. The electrocardiographic measurements of three different tracings were analyzed. The results obtained established normal mean and range values for the parameters: heart rate, waves and intervals of P-QRS-T deflections, as well as the mean cardiac axis. Groups were separated by body weight: group 1 gathered animals with 500-699g and group 2 with animals 700-900g. No differences were found when measure -ments were compared between groups, showing no significant difference between weight/ body sizes to the electrocardiographic parameters (P<0.05). The mean corrected QT values (QTc) obtained using diverse formulae were significantly different (P<0.05), were the most consistent was Van der Water (QTcV). QTcV values were strongly correlated (r=98) and 95% confidence interval 185.7 to 195.2ms.Considering its simplicity and reliability, the QTcV was deemed the most appropriate to be used for the correction of QT interval in cons -cious guinea pigs.The results of this study also suggest that the values found can be used as reference for the species.
INDEX TERMS: Guinea pigs, electrocardiogram, computerized ECG, conscious.
1 Received on February 15, 2016.
Accepted for publication on July 15, 2016.
2 Departamento de Clínica e Cirurgia Veterinárias, Escola de Veteriná
INTRODUCTION
The electrocardiogram (ECG) is a well established impor -tant tool in the evaluation of cardiac electrical function and essential in the diagnosis and monitoring of arrhythmias and conduction disturbances (Tilley 1992). The ECG is used in routine examinations and in experimental research for different cardiovascular assessments (Pinto et al. 2010, Oliveira et al. 2014).
Computerized analyses have introduced new opportu -nities to expand electrophysiology and cardiac arrhythmia studies, especially in small animals, including guinea pigs (Cavia porcellus). Recent advances in small rodent ECG have
enabled assessments in conscious unrestrained animals and improved exam interpretation (Farraj et al. 2011). The measurements found in computerized ECG have more ac -curacy than conventional ECG with larger storage capacity (Camacho et al. 2010, Pinto et al. 2010). Guinea-pigs are a model for electrophysiological and pharmacological in-vestigations (Farraj et al. 2011). In vivo guinea-pig models were studied over the years, both with conscious (Shiota -ni et al. 2005) and anesthetized a-nimals (Morissette et al. 2013). This model is especially used to evaluate new drugs before they are allowed for commercialization, particularly those with high risk of arrhythmias and/or alterations of QT interval (Tárraga et al. 2000). The QT interval measured in the ECG represents ventricular depolarization and repo -larization (Tilley 1992). This variable exhibits an inverse relationship to the heart rate and its measure should be corrected in order to improve utility (Harada et al. 2010). Correction is also important to precisely infer about abnor-malities of the ventricular repolarization, which predispo -se arrhythmias that must be diagnosis as early as possible (Oliveira et al. 2014). QT variation can be associated with drugs; prolongation is often associated to pathologies such as hypertension, whereas short QT can indicate digitalis in -toxication and genetic abnormalities (Peng et al. 2006). Di -fferent correction formulae are currently been used for de-termination of QT parameters in guinea pigs, mostly using anaesthetized animals and implanted ECG needles.
Guinea-pigs as models for ECG studies show interesting features that motivate their use. These rodents are easily handled due to their kind nature, they present relatively low costs of acquisition, nutrition and maintenance, and more importantly, most of their ionic channels are similar to those found in human cardiomyocytes (Malkin 1999). They are also more sensitive to cardioactive glycosides than rats and mice, therefore indicated for the investigation of these inotropic agents (Akera et al. 1979).
Animals ECG patterns can be different accordingly to the body weight and fat deposit, causing cardiac changes that can be seen in the ECG (Neto et al. 2010). Therefore the purpose of this study is to evaluate healthy conscious guinea-pig as a model for electrophysiology assessment and to describe normal ECG patterns in controlled labo-ratory environment using computerized electrocardiogra -phy. The aim of the present study was to establish normal range values for the species comparing possible differences between body weight/size. In addition this study compares different QTc correction formulae, Bazett (1920), Fridericia
(1920) and Van de Water et al. (1989), to establish the most suited for conscious guinea pigs.
MATERIALS AND METHODS
Animals and groups. A total of 50 healthy adult (3-4 mon -ths) male guinea pigs (Cavia porcellus) weighing between 500 and 900g were selected. The animals were provided by the Expe
-rimental Farm of Universidade Federal de Minas Gerais (UFMG) and kept in the Laboratory of Animal Experimentation of Veteri
-nary School (UFMG) in Belo Horizonte, Minas Gerais, Brazil. Each animal was kept in plastic cages (36 x 26 x 15 cm), under control
-led environment, with 12 hours light/dark cycle and room tempe
-rature at 25ºC. The guinea pigs had free access to water and food. Animals were allocated into 2 groups according to their weights: group 1 with animals between 500g and 699g; and group 2 con -taining animals from 700g and 900g.
This study underwent ethical review and was given approval by the Animal Use Committee of University of Minas Gerais, nº 216/2014. Health and welfare were evaluated through clinical ex
-amination by a trained veterinary and 2ml of blood was collected from the jugular vein prior to the experimental period. Samples were collected in microcentrifuge tubes containing 0.005mL of a 10% solution of diamine tetra acetic acid (EDTA) for automated electronic blood count (Poch-100iV Diff®) to attain mean values
for hematologic parameters. Plasma was then obtained to mea
-sure creatine kinase (CK-MB), using Bioclin® kit (Table 1). All
parameters were considered normal according to Amani et al.
(2013) and Zimmerman et al. (2015).
ECG recording. A six-channel electrocardiograph (ECG-PC
version 2.07®-Tecnologia Eletrônica Brasileira (TEB), Belo Hori
-zonte, Minas Gerais, Brazil) was used. The animals were restrained
manually under no sedation or anesthesia during the ECG
record-ing. The rodents were placed in a dorsal recumbence position on a wooden table covered with plastic material. The ventral region of the animals was carefully shaved, alcohol was applied, and four alligator clip electrodes were attached to the skin in the forelimbs and hindlimbs (Tilley 1992). All procedures were performed in a quiet room in order to minimize stress.
ECG trace analysis. All ECGs were performed and analyzed
by the same veterinary according to standard methods (Tilley
1992). Tracings were recorded in six leads of the frontal plan, with 50mm/s of velocity and sensitivity of 1cm=2mV (2N).
In each tracing 3 segments containing five beats (lead II) were selected for quality (clean baseline with no artifacts) and mean values for heart rate (HR), and amplitude and length of P-QRS-T deflections were determined. The parameters evaluated were: heart rate and cardiac rhythm, duration of the P wave, QRS com
-plex, PR and QT intervals, and amplitude of P waves, R waves and T waves. QT Values were obtained from the following equations: QTcB = QT*(RR)1/2 (Bazett 1920); QTcF = QT*(RR)1/3 (Fridericia
1920) and QTcV = QT + 0.087(1- RR) (Van de Water et al. 1989). The mean electrical axis (MEA) of ventricular depolarization in the frontal plane was calculated by the vector method using leads I and III (Tilley 1992). The morphology patterns and rhythm were evaluated in every lead, and P-QRS-T measurements were conducted in lead II.
Statistical analysis. All measurements are expressed as mean ± standard deviation (SD). Non-parametric data were analyzed by Kruskal-Wallis test. Parametric data measurements of waves, in
-tervals and HR were analyzed by means of Tukey Test. The influ
RESULTS
The protocol used provided ECG tracings in conscious gui-nea pigs with high quality, allowing the evaluation of car -diac rhythm and HR, with reliable measurements of waves and intervals (Fig.1). The procedure was well tolerated by the animals, with minimal movements during positioning and electrode placement.
Heart rate
The mean HR of all animals was 288.4 beats per minute (bpm), with minimum of 191.7 and maximum of 381 (Table 2). The mean HR was not significantly different between groups (P≤0.05), therefore showing no correlation to the size (i.e. body weight) of the animals (Table 3).
Rhythm
Most of the tracings evaluated showed a regular sinus rhythm (84%), accompanied by wandering pacemaker in 56% of the cases. Monomorphic isolated ventricular prema -ture complexes were evident in 8 animals, representing 16% of the tracings (Fig.2). No other rhythms were observed.
P wave
The P wave (atrial depolarization) duration range on lead II was from 37.33 to 50.25ms, with minimum of 30 and maximum of 60ms. This parameter was not significan -tly different between groups showing no correlation to the size (i.e. body weight) of the animals (P≤0.05) (Table 2). The wave amplitude range from 0.04mV to 0.10mV, with no significant difference between groups (P≤0.05) (Table 3). The P wave was always positive on lead I, II and aVF. And predominantly positive in lead III.
PR interval
On lead II, PR interval ranged from 54.35 to 77.55ms, with mean of 65.95ms (Table 2). This parameter was not
significantly different between groups showing no corre -lation to the size (i.e. body weight) of the animals (P≤0.05) (Table 3).
QRS complex
The QRS complex length ranged from 52.72 to 74.78 ms (Table 2). This parameter was not significantly different be -tween groups (P≤0.05) showing no correlation to the size (i.e. body weight) of the animals (Table 3).
In lead II, the R wave amplitude ranged from 0.09 to 0.41mV. This parameter was also not significantly diffe -rent between groups (P≤0.05), showing no correlation to the size (i.e. body weight) of the animals (Table 3). The QRS complexes showed predominantly qRs morphology while only 6% of the them had RS morphology.
ST segment
The ST segment in lead II was isoeletric in most cases, ranging from -0.5 to 0.1mv with no significant difference between groups (P≤0.05) (Table 3).
T wave
The range of T wave in lead II in amplitude varied from 0.04 to 0.08mV, with means of 0.06mV (Table2). This para -meter was not significantly different between groups (Ta -ble 3) showing no correlation to the size (i.e. body weight) of the animals (P≤0.05).
In lead II, morphology was mainly positive presenting only one biphasic wave. In leads I, avF and avL T wave was always positive. On the other hand in leads III and avR, T wave was mainly negative.
QT interval and correction formulas
QT interval duration was 123.9, ranging from 107.7 to 140.1ms, on lead II (Table 2), with no relation to the body weight (P≤0.05) (Table 4). A high correlation was detected
Fig.1. Normal electrocardiographic tracings of a healthy adult conscious guinea pig (Cavia porcellus) using a computerized ECG. Tracings were recorded in six derivations of the frontal plan, with 50mm/s of velocity and sensitivity of 1cm=2mV (2N).
Fig.2. Electrocardiographic tracings of three adult conscious guinea pig (Cavia porcellus) using a computerized ECG. Tracings were recor
-ded in six derivations of the frontal plan, with 50mm/s of velocity and sensitivity of 1cm=2mV (2N). (A) Normal sinus rhythm; (B)
between QT and QTcB (r=81; p˂0.0001) and QTcF (r=93; p˂0.0001), but a strong correlation was detected between QT and QTcV (r=98; p˂0.0001). The 95% confidence inter -val analysis for the QTcV -values was from 185.7 to 195.2ms (Table 4). No differences were found between groups using the correction formulas.
Mean electrical axis
The MEA in the frontal plane presented the same direc -tion in all cases within range from 0 to 60°. The median va -lue corresponded to 30°. No difference was detected among groups (data not showing).
DISCUSSION
Guinea pig offers a number of advantages in relation to larger animals including lower cost, less variability and a great number of research tools (Akera et al. 1979, Far -raj et al. 2011). Anesthetized guinea pig model is effective in early cardiovascular studies to evaluate the effects of drug candidate molecules, but anesthesia has a number of effects on the cardiovascular system and may cause distur-bances on the ECG, especially in the QT interval (Hamlin et al. 2003, Morissette et al. 2013). So, the development and application of a noninvasive method for aquisition of ECG tracings in awake animals may present a consistent alternative approach for long-term studies (Pereira-Júnior et al. 2010).
The technological advances provided by computerized ECG have simplified tracings collection in small rodents and facilitated their incorporation into electrophysiology and toxicology studies (Farraj et al. 2011). The measurements have more accuracy and reproducibility than conventional ECG, minimizing restraining time with large storage capa -city (Tilley 1992, Camacho et al. 2010). However, this exam has certain limitations with inappropriate arrhythmia diagnosis due to built-in software. Reports describe 7.8% of error in clinical cases, especially when events of atrial fibrillation occur (Bae et al. 2012). Therefore preliminary software interpretations require reading and confirmation by a qualified eletrocardiographer (Estes 2013).
In the present study, the careful positioning of the ani -mals in a quiet room allowed to optimal immobilization with Table 1. Mean values and standard deviation (SD) of
hematological examination and creatine kinase MB fraction (CK-MB, U/L) from adult guinea pigs (Cavia porcellus) prior
to the electrocardiographic exam
Parameter Mean±SD
Erythrocytes (x106/μL) 5.09±0.04
Packed cell volume (PCV,%) 41.20±2.97
Hemoglobin (g/dL) 14.20±1.06
Mean corpuscular volume (MCV, fL) 82.00±1.99 Mean corpuscular hemoglobin (MCH, %) 27.90±0.66 Mean corpuscular hemoglobin 34.00±0.76 concentration (MCHC, g/dL)
Platelets (x103/μL) 211.00±25.4
Total leukocytes (/μL) 9.20±4.74
Lymphocytes (%) 37.10±3.35
Heterophilus (%) 55.37±6.15
CK-MB (U/L) 225.88±98.40
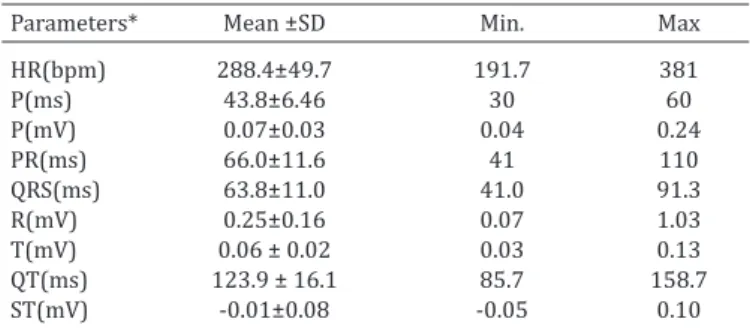
Table 2. Mean, standard deviation, minimum and maximum values of the electrocardiographic parameters. Tracings were recorded in six derivations of the frontal plan, with 50mm/s of velocity and sensitivity of 1cm=2mV (2N) in healthy adult conscious guinea pig (Cavia porcellus) using a
computerized ECG
Parameters* Mean ±SD Min. Max
HR(bpm) 288.4±49.7 191.7 381
P(ms) 43.8±6.46 30 60
P(mV) 0.07±0.03 0.04 0.24
PR(ms) 66.0±11.6 41 110
QRS(ms) 63.8±11.0 41.0 91.3
R(mV) 0.25±0.16 0.07 1.03
T(mV) 0.06 ± 0.02 0.03 0.13
QT(ms) 123.9 ± 16.1 85.7 158.7
ST(mV) -0.01±0.08 -0.05 0.10
*Heart rate (HT), duration of the P wave (Pms), amplitude of P wave (PmV), duration of the PR segment (PRms), duration of the QRS com -plex (QRSms), amplitude of R wave (RmV), amplitude of T wave (TmV), duration of QT interval (QTms) and ST segment amplitude (STmV).
Table 3. Electrocardiographic parameters studied in healthy adult conscious guinea pigs (Cavia porcellus) divided in group
1 (500g-699g) and 2 (700g-800g). Tracings were recorded in six derivations of the frontal plan, with 50mm/s of velocity and sensitivity of 1cm=2mV (2N) using a computerized ECG.
Data are presented as mean followed by SD
Parameters* Group 1 Group 2
HR(bpm) 287.1 ± 9.30A 284.7 ± 10.1A
P(ms) 42.9 ± 1.11A 45.4 ± 1.21A
P(mV) 0.07 ± 0.01A 0.07 ± 0.01A
PR(ms) 66.2 ± 2.04A 66.8 ± 2.21A
QRS(ms) 65.5 ± 2.28A 65.3 ± 2.47A
R(mV) 0.23 ± 0.02A 0.22 ± 0.02A
T(mV) 0.06 ± 0.01A 0.06 ± 0.01A
QT**(ms) 122.6 ± 3.04a 124.3 ± 3.30a
ST**(mV) -0.01 ±0.10a -0.02 ± 0.11a
*Heart rate (HT), duration of the P wave (Pms), amplitude of P wave (PmV), duration of the PR segment (PRms), duration of the QRS complex (QRS -ms), amplitude of R wave (RmV), amplitude of T wave (TmV), duration of QT interval (QTms) and ST segment amplitude (STmV).Mean values followed by different superscript letters in the same row are statistically different by Tukey’s test (P≤0.05). **Mean values followed by different lowercase letters in the same row are statistically different by Kruskal Wallis test (P≤0.05).
Table 4. Electrocardiographic QT duration parameters of adult healthy conscious guinea pigs (Cavia porcellus) using
the following formulas: Bazett, Fridericia and Van der Water were recorded in six derivations of the frontal plan, with 50mm/s of velocity and sensitivity of 1cm=2mV (2N) using a computerized ECG. Data are presented as mean and
confidence interval of 95%.
Parameters Mean and SD Confidence Correlation
(ms)* Interval (ms)
QT 123.9 ± 0.018A 172.5 to 182.6 1
QTcB 264.4 ± 0.034B 254.8 to 274.1 0.81 QTcF 204.1 ± 0.026C 190.5 to 0.016 0.93
QTcV 196.5 ± 211.7D 185.7 to 195.2 0.98 QTcB = QT*(RR)1/2 (Bazett 1920); QTcF = QT*(RR)1/3(Fridericia 1920)
mild restraining, producing valuable recordings. The shape of the waves was similar to those found in literature (Wata -nabe et al. 1985), were P-QRS-T waves were mainly positive in lead II. ECG results were compared to values found by other authors (Pratt 1938, Zeman & Wilber 1965, Farmer & Levy 1968, Pelentz 1971, Wagner & Manning 1976, Ma -rks et al. 2012). Our HR findings of 288bpm, ranging from 238.68 to 338.10bpm were similar to values acquired by plate electrodes in conscious animals, found by Farmer & Levy (1968), that ranged from 240 to 310bpm, and very di -fferent from the studies using anesthetized animals: Pratt (1938) that varied from 327 to 400bpm, Marks et al. (2012) 252±12bpm and Watanabe et al. (1985) 330bpm.
The PR interval varied from 54.35 to 77.55ms, with mean value of 65.95ms, similar to those encountered by Farmer & Levy (1968) 70ms and Zeman & Wilber (1965) 54ms, but very different from Pratt (1938) 162 to 288ms. These discrepancies could be associated with the positio -ning of the animals: Farmer & Levy (1968) used sitting un -restrained animals, while Pratt (1938) used animals in the upright position, and Zeman & Wilber (1965) used animals in pronated position.
The mean electrical axis we found ranged from 0 to 30°, while Pratt (1938) with standing restrained animals found 0 to 76° and Pelentz (1971) with anesthetized animals found 20 to 80°. These differences can be attributed to age, body weight and thoracic perimeter, as well as the positio -ning of the heart in the thorax (Tilley 1992).
P wave is usually positive in lead II corroborant with Pratt (1938), Pelentz (1971) and Watabanabe et al. (1985). No normal range values were found for P wave amplitude for comparison purpose. P wave duration showed range from 37.3 to 50.3ms, similar to the values found by Zeman & Wilber (1965) that ranged from 30 to 60ms. QRS com -plex duration varied from 52.7 to 74.8ms, differing from all the other values found in literature that varied from 13 to 30ms (Pratt 1938, Farmer & Levy 1968, Pelentz 1971), from 44.8±9.5ms found by Marks et al. (2012) and 20ms found by Watanabe et al. (1985). The mean T wave found was of 0.06ms, ranging from 0.04 to 0.08, while Pelentz (1971) found that 90% of the animals had 0.01mV waves. The ST deviation was -0.01±0.08 differing to the finds cited by Wagner & Manning (1976) that ST deviation was up to 0.05mV. In association with the positioning of the animals, these differences could be explained by the use of anesthe-tics such as ether (Pelentz 1971, Watanabe et al. 1985) and pentobarbital (Marks et al. 2012).
The QT interval, essential for human drug studies, va-ried from 107.7 to 140.1ms, correlating to the findings of 130 ms obtained by Pelentz (1971), 110 ms obtained by Farmer & Levy (1968), and 107ms by Zeman & Wilber (1965). QT correction was made using the Bazett, Frideri -cia and Van der Water formulas, and considering the high HR, QTcV showed less variability from the original QT thus suggesting that the Van der Water formula should be em-ployed. That is in accordance with previous researchers (Spence et al. 1998, Oliveira et al. 2012). The need to esta -blish a suitable QT correction formula relies on the impor-tance to evaluate the occurrence of QT prolongation, which
leads to fatal arrhythmias such as Torsade de Pointes (Ha -mlin et al. 2003).
The differences in the waves’ length and amplitudes can be explained by the recording methodology. Some studies used invasive ECG (Zeman & Wilber 1965), plaque recor -dings (Farmer & Levy 1968), mechanical restraining (Pratt 1938) and anesthetized animals (Pelentz 1971), while our study used manually restrained conscious animals with a new electrocardiography acquisition system. QRS complex above the reference values has been described by authors using the present equipment when evaluation ECG from healthy animals. Special attention should be given when assessing these findings (Camacho et al. 2010).
Studies in humans and animals reveal that body weight and obesity can influence ECG tracings (Alpert et al. 2001, Talavera et al. 2008, Neto et al. 2010). In our study, the si -milarities found while comparing body weight/size of the animals can be attributed to the fact that all animals were standardized and healthy, with no signs of obesity.
CONCLUSIONS
The present study describes a computerized non-inva -sive method for surface ECG recordings in conscious guinea pigs.
This study establishes also normal range values for the species and states that Van der Water is the most suitable formula for QT correction.
REFERENCES
Akera T., Yamamoto S., Chubb J., McNish R. & Brody T.M. 1979. Biochemical basis for the low sensitivity of the rat heart to digitalis. Naunyn. Schmie -debergs Arch. Pharmacol. 308:81- 88.
Alpert M.A., Terry B.E. & Hamm C.R. 2001. Effect of weight loss on the ECG of normotensive morbidly obese patients. Chest 119:507-510.
Amani M., Sajad J., Ahmadiasl N., Usefzade N. & Zaman J. 2013. Effect of HEMADO on level of CK-MB and LDH enzymes after ischemia/reperfu -sion injury in isolated rat heart. Bio Impacts 3:101-104.
Bae M.H., Lee J.H., Yang D.H., Park H.S., Cho Y., Chae S.C. & Jun J.E. 2012. Er -roneous computer electrocardiogram interpretation of atrial fibrillation and its clinical consequences. Clin. Cardiol. 35:348-353.
Bazett H.C. 1920. An analysis of the time-relations of electrocardiograms. Heart 7:353-367.
Camacho A.A., Paulino J.R.D., Pasconi J.P.E. & Teixeira A.A.A. 2010. Com -parison between conventional and computerized electrocardiography in cats. Arq. Bras. Med. Vet. Zootec. 62:765-769.
Estes N.A. 2013. Computerized interpretation of ECGs: supplement not a substitute. Cir. Arrhythm. Eletrophysiol. 6:2-4.
Farmer J.B. & Levy G.P. 1968. A simple method for recording the electro -cardiogram and heart rate from conscious animals. Brit. J. Pharmacol. Chemother. 32:193-200.
Farraj A.K., Hazari M.S. & Cascio W.E. 2011. The utility of the small rodent electrocardiogram in toxicology. Toxicol. Sci. 121:11-20.
Fridericia L.S. 1920. Die Systolendauer im Elekstrokardiogramm bei nor -malen Menschen und bei Herzkranken. Acta Med. Scand. 53:469-486. Hamlin R.L., Kijtawomrat A., Keene B.W. & Hamlin D.M. 2003. QT an RR in
Malkin R. 1999. Experimental cardiac tachyarrhythmias in guinea pigs. J. Electrocardiol. 32:84-86.
Marks L., Borland S., Philp K., Ewart L., Lainée P., Skinner M., Kirk S. & Va -lentin J.P. 2012. The role of anesthetized guinea-pig in the preclinical cardiac safety evaluation of drug candidate compounds. Toxicol. Appl. Pharmacol. 263:171-183.
Morissette P., Nishida M., Trepakova, Imredy J., Lagrutta A., Chaves A., Hoagland K., Hoe C.L., Zrada M.M., Travis J.J., Zingaro G.J., Gerenser P., Friderichs G. & Salata J.J. 2013. The anesthetized guinea pig: an effective early cardiovascular derisking and lead optimization model. J. Pharma -col. Toxi-col. Methods 69:137-149.
Neto G.B.P., Brunetto M.A., Sousa M.G., Aulus C.C. & Camacho A.A. 2010. Effects of weight loss on the cardiac parameters of obese dogs. Pesq. Vet. Bras. 30:167-171.
Oliveira M.S., Muzzi R.A.L., Muzzi L.A.L., Cherem M. & Mantovani M.M. 2012. QT interval in healthy dogs: which method of correcting the QT interval in dogs is appropriate for use in small animal clinics? Pesq. Vet. Bras. 34:469-472.
Oliveira M.S., Muzzi R.A.L., Araújo R.B., Muzzi L.A.L., Ferreia D.F. & Silva E.F. 2014. Heart rate variability and arrhythmias evaluated with Holter in dogs with degenerative mitral valve disease. Arq. Bras. Med. Vet. Zoo. 66:425-432.
Pelentz T. 1971. Electrocardiogram of the guinea-pig. Acta Physiol. Pol. 22:113-121.
Peng S., Yu Y., Hao K., Xing H., Li D., Chen C., Huang A., Hong X., Feng Y., Zhang Y., Li J., Wang B., Wu D., Wang X. & Xu X. 2006. Heart rate-correct -ed QT interval duration is significantly associat-ed with blood pressure in Chinese hypertensives. J. Electrocardiol. 39:206-210.
Pereira-Júnior P.P., Marocolo M., Rodrigues F., Medei E. & Nascimento J.H.M. 2010. Noninvasive method for electrocardiogram recording in conscious rats: feasibility for heart rate variability analysis. An. Acad. Bras. Cienc. 82:431-437.
Pinto M.C., Borboleta L.R., Melo M.B. & Melo M.M. 2010. Tityus fasciolatus
envenomation induced by cardio-respiratory alterations in rats. Toxicon 55:1132-1137.
Pratt C.L.G. 1938. The electrocardiogram of the guinea-pig. J. Physiol. 92:268-272.
Shiotani M., Harada T., Abé J., Sawada Y., Hashimoto K., Hamada Y. & Hori I. 2005. Practical application of guinea pig telemetry system for QT evalu -ation. J. Toxicol. Sci.30:239-247.
Spence S., Soper K., Hoe C.M. & Coleman J. 1998. The heart rate-corrected QT interval of conscious beagle dogs: a formula based on analysis of co-variance. Toxicol. Sci. 45:247-258.
Talavera J., Guzman M.J., Del Palacio M.J., Albert A.P. & Bayón A. 2008. The normal electrocardiogram of four species of conscious raptors. Res. Vet. Sci. 84:119-125.
Tárraga K.M., Spinosa H.S. & Camacho A.A. 2000. Electrocardiographic evaluation of two anesthetic combinations in dogs. Arq. Bras. Med. Vet. Zootec. 52:138-143.
Tilley L.P. 1992. Essentials of Canine and Feline Electrocardiography: in -terpretation and treatment. 3rd ed. Lea and Febiger, Philadelphia. 470p. Van de Water A., Verheyen J., Xhonneux R. & Reneman R.S. 1989. An im -proved method to correct the QT interval of the electrocardiogram for changes in heart rate. J. Pharmacol. Toxicol. Methods 22:207-217. Watanabe T., Rautaharju P.M. & McDonald T.F. 1985. Ventricular action po
-tentials, ventricular extracellular po-tentials, and the ECG of guinea pig. Circ. Res. 57:362-373.
Wagner J.E. & Manning P.J. 1976. The biology of the guinea pig. American College of Laboratory Animal Medicine, Academic Press, New York, NY. 317p.
Zeman F.J. & Wilber C.G. 1965. Some characteristics of the guinea pig elec -trocardiogram. Life Sci. 4:2269-2274.