* Corresponding author: E-mail: leandro.bortolon@ embrapa.br
Received: August 21, 2014 Approved: September 14, 2015
How to cite: Rogeri DA, Gianello C, Bortolon L, Amorim MB. Substitution of Clay Content for P-Remaining as an Index of the Phosphorus Buffering Capacity for Soils of Rio Grande do Sul. Rev Bras Cienc Solo. 2016;40:e0140535.
Copyright: This is an open-access article distributed under the terms of the Creative Commons Attribution License, which permits unrestricted use, distribution, and reproduction in any medium, provided that the original author and source are credited.
Substitution of Clay Content for
P-Remaining as an Index of the
Phosphorus Buffering Capacity for
Soils of Rio Grande do Sul
Douglas Antonio Rogeri(1), Clesio Gianello(2), Leandro Bortolon(3)* and Magno Batista Amorim(4)
(1)
Instituto Federal de Santa Catarina, São Miguel do Oeste, Santa Catarina, Brasil. (2)
Universidade Federal do Rio Grande do Sul, Departamento de Solos, Porto Alegre, Rio Grande do Sul, Brasil. (3)
Empresa Brasileira de Pesquisa Agropecuária, Embrapa Pesca e Aquicultura, Palmas, Tocantins, Brasil. (4)
Universidade Federal do Rio Grande do Sul, Departamento de Solos, Programa de Pós-graduação em Ciência do Solo, Porto Alegre, Rio Grande do Sul, Brasil.
ABSTRACT: Mehlich-1 soil extract is currently used in Rio Grande do Sul (RS) and
Santa Catarina (SC) States, in Brazil, to evaluate soil phosphorus available to plants and Mehlich-1 is sensitive to soil buffering capacity. This limitation is overcome partly by soil separation into buffering classes based on soil clay content. However, soil clay content has some technical and operational limitations, such as the underestimation of soil clay levels in soils under no-till. The aim of this study was to evaluate the remaining phosphorus (P-rem) compared to soil clay content as an index of the buffering capacity in soils of RS. The relationship between P-rem and soil clay content was assessed using 200 soil samples from a wide range of locations across the state. In 20 representative soil types, P-rem, soil clay content, P maximum adsorption capacity, total and pedogenic Fe contents, amount of P2O5 needed to increase soil P in 1 mg kg
-1
extracted by Mehlich-1 and -3 methods and P capacity factor were determined. Furthermore, a pot experiment was carried out with plants to determine soil P content extracted by Mehlich-1 and -3 at the maximum technical efficiency (MET) and the maximum absorption efficiency (MEA). Correlation analyses were performed between P-rem and soil clay content and, with the attributes of soils involving the P buffering capacity. The relationship between P-rem and soil clay content was described as a decreasing exponential function; however, the adjustment was not adequate to propose critical levels for P-rem. The P-rem index was superior to soil clay index in practically all relationships with the attributes related to the soil buffering capacity of the soils. In some cases, the indexes were similar; however, P-rem was not lower than the soil clay content in any case. The P-rem is a more reliable index to represent soil buffering capacity than the soil clay content in soils from RS, and P-rem might be used to implement soil classes for Mehlich-1 and Mehlich-3 determinations of soil P.
Keywords: Mehlich-1, Mehlich-3, phosphate fertilization, phosphorus adsorption.
INTRODUCTION
Phosphorus (P) is a very reactive element in the soil and can form stable compounds of high bonding energy with colloids (Goldberg and Sposito, 1985); its availability to plants is inversely related to the bond energy involved (Novais and Smyth, 1999; Gatiboni et al., 2007). In the states of Rio Grande do Sul (RS) and Santa Catarina (SC), the estimate of the “available P” for plants is made using the Mehlich-1 method (CQFSRS/SC, 2004). Recently, the Mehlich-3 method has been proposed as a substitute for Mehlich-1 because it is a multi-element extractor and does not overestimate the P availability in soils fertilized with natural phosphate (Schlindwein and Gianello, 2008; Bortolon et al., 2009). However, both extractors are sensitive to soil buffering capacity, so that P extraction decreases with increased buffering (Anghinoni and Bohnen, 1974; Alcântara et al., 2008; Bortolon et al., 2010; Oliveira, 2010). Therefore, to compensate for the deficiency of the method and interpret the extracted concentration, it is necessary to separate the soils into buffering classes, for which the criterion in the states of RS and SC is the clay content. However, routine textural analysis in laboratories has some limitations because it is time-consuming, onerous and subject to many variations. Furthermore, because it is a measure of particle diameter (in this case smaller than 2 µm), routine textural analysis does not provide any information about the quality of the clay fraction (Bonfim et al., 2004; Novais et al., 2007). In RS and SC, the combination of geological diversity, climate, topography and other processes and formation factors has led to a wide variety of soil types with contrasting mineralogy (Brasil, 1973; Streck et al., 2008). Thus, it is likely that there are inconsistencies in the classification of soils due to the use of only one quantitative criterion, such as clay content, which is not sensitive to attributes related to the P sorption capacity of the soil. Moreover, with the consolidation and development of the no-tillage system, in which there is an increase of the organic matter content, recurrent problems are observed in routine laboratory assays related to the dispersion of clay in soils under this system (Sousa Neto et al., 2009; Miyazawa and Barbosa, 2011).
Within this scenario, it is relevant to assess other indices of soil buffering capacity to establish buffering classes and improve the estimation of the P content in soils by the Mehlich-1 and Mehlich-3 methods. The P-remaining method (P-rem), also known as the single point adsorption isotherm, is a technique that was proposed by Bache and Williams (1971) and is now used by some Brazilian states, together with the clay content, to determine values such as the P buffering capacity index for the classification of soils (Alvarez V et al., 1999; Sousa and Lobato, 2002; Wadt and Silva, 2011). The P-rem is negatively related to clay content (Freire, 2001; Alcântara et al., 2008; Broggi et al., 2010) and has the advantages of being faster and simpler than textural determination, as well as the potential for greater accuracy, because it is sensitive to the quality of the clay fraction and directly evaluates the P immobilization potential; in contrast, the clay content indirectly assesses this information (Alvarez V et al., 2000; Bonfim et al., 2004). In the states of RS and SC, P-rem has never been tested as an alternative to clay content, thus suggesting the potential for investigating the efficiency of this technique in the soil of these states to improve the estimates of P doses to be applied.
Selection of one index instead of another may be performed by means of the correlation coefficient determined between attributes of the soil and plants related to the soil-buffering capacity and the test indices, opting for that which presents the greatest degree of association (Corey, 1987). Moreover, assumptions such as cost per analysis and ease of execution should be taken into account in the selection.
MATERIALS AND METHODS
Soil selection
Twenty of the main soil classes that occur in the state of RS were selected (Table 1), prioritizing those which most frequently occur among the 11 physiographic regions, according to their agricultural potential and economic relevance. The samples were collected in the layer 0.00-0.20 m deep, preferably in areas under natural vegetation. Most of the soils had never been cultivated or fertilized. Three soils were selected under crop conditions (Tupanciretã, Ibirubá and São Gabriel) but with P concentrations below the critical level (CQFSRS/SC, 2004). After collection, the soils were air dried, passed through a sieve with a mesh of 2.0 mm (ADSS) and characterized (Table 1).
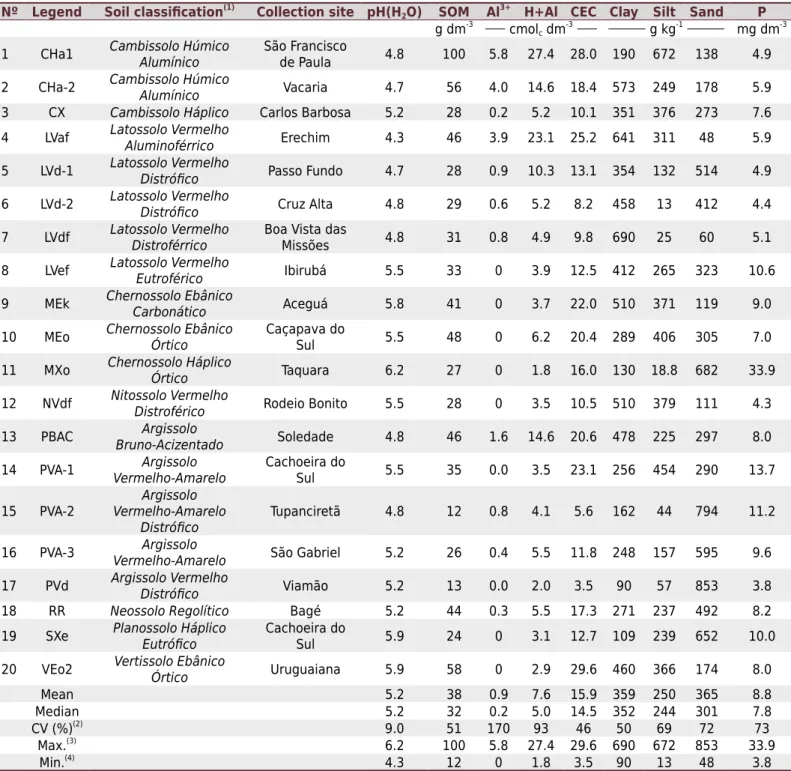
Table 1. Physical and chemical characterization of the 0.00-0.20 m layer of the soils
Nº Legend Soil classification(1) Collection site pH(H
2O) SOM Al
3+ H+Al CEC Clay Silt Sand P
g dm-3 cmolc dm -3
g kg-1 mg dm-3
1 CHa1 Cambissolo Húmico
Alumínico
São Francisco
de Paula 4.8 100 5.8 27.4 28.0 190 672 138 4.9
2 CHa-2 Cambissolo Húmico
Alumínico Vacaria 4.7 56 4.0 14.6 18.4 573 249 178 5.9
3 CX Cambissolo Háplico Carlos Barbosa 5.2 28 0.2 5.2 10.1 351 376 273 7.6
4 LVaf Latossolo Vermelho
Aluminoférrico Erechim 4.3 46 3.9 23.1 25.2 641 311 48 5.9
5 LVd-1 Latossolo Vermelho Distrófico Passo Fundo 4.7 28 0.9 10.3 13.1 354 132 514 4.9
6 LVd-2 Latossolo Vermelho Distrófico Cruz Alta 4.8 29 0.6 5.2 8.2 458 13 412 4.4
7 LVdf Latossolo Vermelho
Distroférrico Boa Vista das Missões 4.8 31 0.8 4.9 9.8 690 25 60 5.1
8 LVef Latossolo Vermelho
Eutroférico Ibirubá 5.5 33 0 3.9 12.5 412 265 323 10.6
9 MEk Chernossolo Ebânico
Carbonático Aceguá 5.8 41 0 3.7 22.0 510 371 119 9.0
10 MEo Chernossolo Ebânico
Órtico
Caçapava do
Sul 5.5 48 0 6.2 20.4 289 406 305 7.0
11 MXo Chernossolo Háplico
Órtico Taquara 6.2 27 0 1.8 16.0 130 18.8 682 33.9
12 NVdf Nitossolo Vermelho
Distroférico Rodeio Bonito 5.5 28 0 3.5 10.5 510 379 111 4.3
13 PBAC Argissolo
Bruno-Acizentado Soledade 4.8 46 1.6 14.6 20.6 478 225 297 8.0
14 PVA-1 Argissolo
Vermelho-Amarelo
Cachoeira do
Sul 5.5 35 0.0 3.5 23.1 256 454 290 13.7
15 PVA-2
Argissolo Vermelho-Amarelo
Distrófico Tupanciretã 4.8 12 0.8 4.1 5.6 162 44 794 11.2
16 PVA-3 Argissolo
Vermelho-Amarelo São Gabriel 5.2 26 0.4 5.5 11.8 248 157 595 9.6
17 PVd Argissolo Vermelho Distrófico Viamão 5.2 13 0.0 2.0 3.5 90 57 853 3.8
18 RR Neossolo Regolítico Bagé 5.2 44 0.3 5.5 17.3 271 237 492 8.2
19 SXe Planossolo Háplico Eutrófico Cachoeira do
Sul 5.9 24 0 3.1 12.7 109 239 652 10.0
20 VEo2 Vertissolo Ebânico
Órtico Uruguaiana 5.9 58 0 2.9 29.6 460 366 174 8.0
Mean 5.2 38 0.9 7.6 15.9 359 250 365 8.8
Median 5.2 32 0.2 5.0 14.5 352 244 301 7.8
CV (%)(2)
9.0 51 170 93 46 50 69 72 73 Max.(3)
6.2 100 5.8 27.4 29.6 690 672 853 33.9 Min.(4)
4.3 12 0 1.8 3.5 90 13 48 3.8
SOM: soil organic matter by wet digestion; Al3+
: extracted with 1 mol L-1 KCl; H+Al:by the SMP solution; CEC: cation exchange capacity at pH 7.0; P: extracted by the Mehlich-1 method (Tedesco et al., 1995); clay, silt and sand: the pipette method (Claessen, 1997). (1) Classification according to Santos et al. (2013). (2) Coefficient of variation around the mean. (3)
Maximum determined value. (4)
In addition, 200 soil samples from different locations of the state of RS were selected, which were obtained from samples submitted by producers to the Soil Analysis Laboratory of the Department of Soil Science, Federal University of Rio Grande do Sul (Universidade Federal do Rio Grande do Sul - UFRGS). In these samples, only the clay content and P-rem were determined to establish the degree of association between these measurements in a larger number of samples.
Chemical and physical analyses
Characterization of the soils determined the following (Tedesco et al., 1995): the pH in water, SMP index, cation exchange capacity at pH 7.0 (CEC), organic matter, titratable acidity (H+Al) and concentrations of P, K+
, Ca2+ , Mg2+
andAl3+
. The clay contents were determined by the pipette method (Claessen, 1997). Determination of the P-rem was conducted by adding 5.0 cm3
of ADSS and 50 mL of a solution containing 60 mg L-1
P and 10 mmol L-1
CaCl2 to a 100-mL Erlenmeyer flask. After stirring for 5 min, the suspension was left for 16 h according to Alvarez V et al. (2000). The determinations of P, K+
, Ca2+ , Mg2+
andAl3+
were performed by inductively coupled plasma optical emission spectrometry (ICP-OES) (Sikora et al., 2005).
In the soils, assays were performed related to the buffering capacity of P: (i) Fe and Al contents associated with oxides of low crystallinity and total pedogenic Fe oxides; (ii) maximum adsorption capacity of P (MACP); (iii) P capacity factor (PCF); (iv) P buffering capability - PBC (quantity of P2O5 required for a 1 mg kg
-1
P increase in analysis via the Mehlich-1 and -3 methods).
Iron and Al of low crystallinity were extracted by ammonium oxalate (FeOX) 0.2 mol L -1
(Schwertmann, 1964), and Fe attributed to total pedogenic oxides was collected with two successive extractions using dithionite-citrate sodium bicarbonate (FeDCB) at 80 °C (Mehra and Jackson, 1960). The total concentrations of Fe, Al, P and Mn were determined by sulfuric acid attack according to the procedure described in Claessen (1997). The elements in the extracts were quantified by ICP-OES.
The maximum adsorption capacity of P (MACP) was determined by adding 5.0 cm3 of soil (the volume of each soil was pre-weighed to express the results in units of mass) to Erlenmeyer flasks with a capacity of 150-mL, to which a solution of 50 mL of 10 mmol CaCl2 L
-1
was transferred containing different concentrations of P (0, 10, 20, 40, 100, 200, 400 and 500 mg L-1
). Next, the sample was shaken for 1 h in a helical motion stirrer and allowed to stand for 16 h. After this period, an aliquot was withdrawn from the supernatant, and the P in solution was determined by ICP-OES. The data obtained were mathematically fitted to the Langmuir equation to acquire the value of MACP and the constant related to the bonding energy (k), as described by Novais and Smyth (1999).
The P capacity factor (PCF) of the soils was determined by means of adsorption and desorption isotherms of P in the soil (Fox and Kamprath, 1970). Sorbed P was determined by adding 30 mL of a CaCl2 solution (10 mmol L
-1
) with different P concentrations (0, 10, 25, 50 and 100 mg L-1
) to 1.0 g of soil. The solutions were maintained in contact with the soil for 72 h, with alternating cycles of agitation (“back and forth” shaker) and rest. Next, the tubes were centrifuged, and the supernatant solution was completely removed; from this, the P was determined by ICP-OES. Desorbed P was determined by adding 30 mL of a CaCl2 solution (10 mmol L
-1
) to each tube, and the same procedure described for the evaluating sorption was performed. Then, for each soil, a 2nd degree polynomial function was fit between desorbed and sorbed P, where the PCF was considered the coefficient (b1) of the equation.
Experiment with plants
by the plants (P in maximum absorption efficiency - MAE) occurs. Additionally, the P buffering capacity (PBF) was determined in this study.
The treatments consisted of 20 soils, five P2O5 rates (0, 100, 200, 400 and 800 kg ha -1
) and three replications in a completely randomized design. The doses were calculated considering a soil mass of 2 × 10⁶
kg ha-1
. The rates used were therefore equivalent to 0, 50, 100, 200 and 400 mg kg-1
of P2O5; however, in this study, they are expressed in the unit kg ha-1. Triple superphosphate (TSP) was used as the P source and was applied to the soil in its powder form. The experimental units consisted of polyethylene pots with 8-L capacity, to which 6 kg of dry soil was added after homogenization with the treatments. The pots were moistened and distributed randomly in an open area, where they were exposed to the weather and, therefore, natural rainfall.
The soils were corrected with a mixture of CaO and MgO at the stoichiometric ratio of 3:1 to reach a pH(H2O) of approximately 6.0. Furthermore, a solution containing micronutrients was also applied, with concentrations equivalent to 4 mg kg-1
of Cu and Zn, 1 mg kg-1 of B and 0.1 mg kg-1
of Mo. The equivalent of 45 and 42.5 mg kg-1
of S and Mg, respectively, were also added to all soils presenting concentrations of these elements below the range “very high” (CQFSRS/SC, 2004). Soils with K contents below 250 mg kg-1
were fertilized with KCl to achieve this value. N was applied at planting and during cultivation at a dose equivalent to 125 mg kg-1
of N in the form of urea.
Corn (hybrid Pioneer 30F53) was sown ten days after the application of fertilizers, and three plants were cultured per pot for 20 days after emergence. At the end of this period, the plants were cut level with the ground and stored in an oven at 65 °C, until they reached a constant weight, after which the shoot dry mass (SDM) was determined. Subsequently, the plant tissue was ground and digested for quantification of the absorbed P (Tedesco et al., 1995). The P in the extract was determined by ICP-OES.
Soil samples were collected for evaluation of the “available P” before and after cultivation using a Dutch auger to collect three sub-samples from each pot. The samples were dried in an oven at 65 °C and ground in a porcelain mortar. Thus, P was extracted via the Mehlich-1 (Tedesco et al., 1995) and Mehlich-3 methods (Schlindwein, 2003). All determinations were made in duplicate, and data averages are used in the presentation of the results.
The amount of P2O5 necessary to increase P by 1 mg kg -1
in the analytical result (PBC) was quantified by the inverse (1/b) of the angular coefficient (b) of the 1st
degree polynomial equation (y = a + bx) adjusted between the P2O5 applied doses (independent variable) and P contents extracted by the Mehlich-1 and Mehlich-3 solutions (dependent variable) in soil samples collected after the corn harvest (35 days after fertilizer application). The increase rate in SDM per unit of P2O5 applied (DMIR) was obtained from the angular coefficient (b) of the polynomial equation adjusted between P2O5 rates and the dry matter production.
Statistical analysis
buffering capacity of P and the measurements of both the P-rem and clay content. The correlation was classified according to the degree of association between the variables as follows: low (0< |r| <0.50), moderate (0.50< |r| <0.75), strong (0.75< |r| <0.90) and extremely strong (|r| >0.90). Additionally, soil attributes related to the P buffering capacity were studied using descriptive statistics parameters.
RESULTS AND DISCUSSION
Relationship between the physical and chemical properties of the soils
The selected soils presented clay contents ranging from 90 to 690 g kg-1
, with a median of 352 g kg-1, and, for the most part, showed average to high probability (>50 %) of response to phosphatic fertilization, as the P content of almost all soils was below the critical level (CQFSRS/SC, 2004) (Table 1). The distribution of soils in buffering classes using the clay content as an index was two soils in class I (> 600 g kg-1); six soils in class II (400 to 600 g kg-1
); seven soils in class III (210 to 400 g kg-1
) and five soils in class IV (0 to 200 g kg-1
). The original P contents extracted by the Mehlich-1 method were separated in fertility ranges: “Very Low” (three soils), “Low” (eight soils); “Medium” (seven soils) and “High” (two soils).
The soils presented a mean P-rem value of 17.6 mg L-1
, median of 15.5 mg L-1
, minimum value of 0.5 mg L-1 (CHa1-São Francisco de Paula) and maximum of 47.5 mg L-1 (PVd-Viamão) (Table 2). The P-rem values are usually negatively associated with clay content (Bonfim et al., 2004; Alcântara et al., 2008; Broggi et al., 2010), because P-rem is a measure of non-adsorbed P (Novais et al., 2007). The PVd-Viamão soil had the lowest clay content (90 g kg-1
) and the highest value of P-rem (47.5 mg L-1
). However, the soil with the lowest P-rem value, CHa-1 (0.5 mg L-1), is classified as sandy (190 g kg-1 - Class IV) by the current system based on clay (CQFSRS/SC, 2004), suggesting a disagreement in the classification of some soils from RS when using different indices of the P buffering capacity.
The relation between P-rem and clay was described by an exponentially decreasing curve, for both the set of soils selected for the experiments and for a larger number of soils (200 samples), with coefficients of determination of 0.54 and 0.73, respectively (Figure 1). Furthermore, there was also a significant negative linear correlation between P-rem and clay, with r = -0.70** (20 soils) and r = -0.67** (200 soils). When both indices are used in the classification of soils, as is done for soils in the Brazilian state of Minas Gerais (Alvarez V et al., 1999) and for other soils of the Cerrado (Sousa and Lobato, 2002), it is interesting to have a significant relationship between them for soils of the region, in order to avoid inconsistencies in classification. For soils of Minas Gerais, Freire (2001) obtained a decreasing quadratic relationship (R2
= 0.74) of clay content with the P-rem.
However, for RS soils, the exponential function fit between the P-rem and clay suggests an ambiguity in interpretation of the P content of soils despite the high coefficient of determination (R2
= 0.73) if both indexes are concomitantly used in separating the soils into buffering classes (Figure 1). This phenomenon is observed because if the arrangement of the points on the graph is examined in more detail, there is a high dispersion of points in the range of 200 to 600 g kg-1
clay, with an interval of 400 g kg-1 clay and less than 15 mg L-1 on P-rem in amplitude. This can be observed by substitution in the adjusted equation between the measurements of the clay ranges currently used by the CQFSRS/SC (2004) in the separation of soils to create corresponding P-rem classes. Based on the equation, the P-rem classes would be Class I (0 to 10 mg L-1), Class II (10.1 to 13 mg L-1
), Class III (13.1 to 23 mg L-1
) and Class IV (23.1 to 60 mg L-1 ). From this classification, it can be observed that a small variation of only 3 mg L-1
in the P determined in the P-rem extract could classify the soil in Class I (equivalent to > 600 g kg-1
clay) or Class III (210 to 400 g kg-1
it could create confusion and give rise to technical questions regarding which soil to use, as the classification and fertilizer recommendations may be different.
The maximum adsorption capacity of P (MACP), a measure that reflects the sorption potential of the soil, presented an amplitude higher than 30 times between the soils (Table 2). The MACP values increased by 63.5 and 1,926.8 mg kg-1
for the soils SXe-Cachoeira do Sul and CHa1-São Francisco de Paula, respectively. The MACP was significantly correlated with the P-rem values (r = -0.74**
), as expected, because the measurement of P-rem is a point among those used in the adsorption isotherm for determination of the MACP (Vilar et al., 2010; Broggi et al., 2011); however, the correlation was not statistically significant with the clay content (r = 0.26ns
) (Table 3). Possibly due to the utilization of a large number of mineralogically distinct soils, the results of this work contradicts those of other studies that obtained a significant relationship between the MACP and clay (Corrêa et al., 2011; Pinto, 2012). The lack of significance suggests that the sorption power of P in soil is the result of not only a quantitative measurement of the relative proportion of particle size (<2 µm) but also the mineralogical composition of this fraction and land use history.
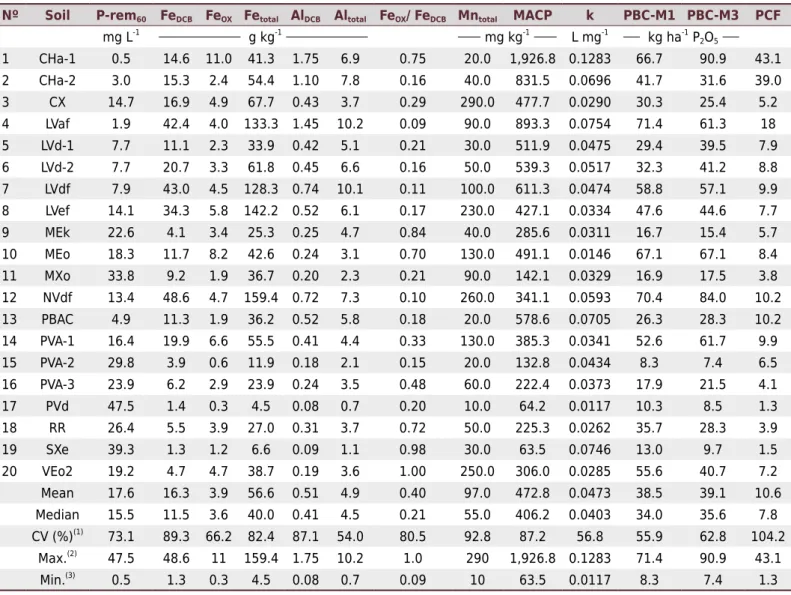
Table 2. Chemical attributes and measurements related to the P buffering capacity of the soils studies
Nº Soil P-rem60 FeDCB FeOX Fetotal AlDCB Altotal FeOX/ FeDCB Mntotal MACP k PBC-M1 PBC-M3 PCF
mg L-1
g kg-1
mg kg-1
L mg-1
kg ha-1
P2O5
1 CHa-1 0.5 14.6 11.0 41.3 1.75 6.9 0.75 20.0 1,926.8 0.1283 66.7 90.9 43.1
2 CHa-2 3.0 15.3 2.4 54.4 1.10 7.8 0.16 40.0 831.5 0.0696 41.7 31.6 39.0
3 CX 14.7 16.9 4.9 67.7 0.43 3.7 0.29 290.0 477.7 0.0290 30.3 25.4 5.2 4 LVaf 1.9 42.4 4.0 133.3 1.45 10.2 0.09 90.0 893.3 0.0754 71.4 61.3 18
5 LVd-1 7.7 11.1 2.3 33.9 0.42 5.1 0.21 30.0 511.9 0.0475 29.4 39.5 7.9
6 LVd-2 7.7 20.7 3.3 61.8 0.45 6.6 0.16 50.0 539.3 0.0517 32.3 41.2 8.8
7 LVdf 7.9 43.0 4.5 128.3 0.74 10.1 0.11 100.0 611.3 0.0474 58.8 57.1 9.9 8 LVef 14.1 34.3 5.8 142.2 0.52 6.1 0.17 230.0 427.1 0.0334 47.6 44.6 7.7 9 MEk 22.6 4.1 3.4 25.3 0.25 4.7 0.84 40.0 285.6 0.0311 16.7 15.4 5.7 10 MEo 18.3 11.7 8.2 42.6 0.24 3.1 0.70 130.0 491.1 0.0146 67.1 67.1 8.4 11 MXo 33.8 9.2 1.9 36.7 0.20 2.3 0.21 90.0 142.1 0.0329 16.9 17.5 3.8 12 NVdf 13.4 48.6 4.7 159.4 0.72 7.3 0.10 260.0 341.1 0.0593 70.4 84.0 10.2 13 PBAC 4.9 11.3 1.9 36.2 0.52 5.8 0.18 20.0 578.6 0.0705 26.3 28.3 10.2
14 PVA-1 16.4 19.9 6.6 55.5 0.41 4.4 0.33 130.0 385.3 0.0341 52.6 61.7 9.9
15 PVA-2 29.8 3.9 0.6 11.9 0.18 2.1 0.15 20.0 132.8 0.0434 8.3 7.4 6.5
16 PVA-3 23.9 6.2 2.9 23.9 0.24 3.5 0.48 60.0 222.4 0.0373 17.9 21.5 4.1
17 PVd 47.5 1.4 0.3 4.5 0.08 0.7 0.20 10.0 64.2 0.0117 10.3 8.5 1.3 18 RR 26.4 5.5 3.9 27.0 0.31 3.7 0.72 50.0 225.3 0.0262 35.7 28.3 3.9 19 SXe 39.3 1.3 1.2 6.6 0.09 1.1 0.98 30.0 63.5 0.0746 13.0 9.7 1.5 20 VEo2 19.2 4.7 4.7 38.7 0.19 3.6 1.00 250.0 306.0 0.0285 55.6 40.7 7.2 Mean 17.6 16.3 3.9 56.6 0.51 4.9 0.40 97.0 472.8 0.0473 38.5 39.1 10.6 Median 15.5 11.5 3.6 40.0 0.41 4.5 0.21 55.0 406.2 0.0403 34.0 35.6 7.8
CV (%)(1)
73.1 89.3 66.2 82.4 87.1 54.0 80.5 92.8 87.2 56.8 55.9 62.8 104.2 Max.(2) 47.5 48.6 11 159.4 1.75 10.2 1.0 290 1,926.8 0.1283 71.4 90.9 43.1
Min.(3)
0.5 1.3 0.3 4.5 0.08 0.7 0.09 10 63.5 0.0117 8.3 7.4 1.3
P-rem: P-remaining 60 mg L-1
; FeDCB: Fe by dithionite-citrate bicarbonate (Mehra and Jackson, 1960); FeOX: Fe by ammonium oxalate (Schwertmann, 1964); FeOX/FeDCB: Fe oxalate and Fe dithionite ratio; Total Fe, Al and Mn by sulfuric acid attack (Claessen, 1997); MACP: maximum adsorption capacity of phosphorus by the Langmuir isotherm; k: constant related to the binding energy obtained by the Langmuir equation; PBC-M1 and M3: rate of P2O5 necessary to increase P by 1 mg kg-1
in analysis via the Mehlich-1 and -3 methods; PCF: phosphate capacity factor (dimensionless) obtained by the
linear coefficient (b1) of the quadratic equation between P-sorbed and P-desorbed (Fox and Kamprath, 1970). (1) Coefficient of variation for the mean. (2)
Maximum encountered value. (3)
The correlations were moderate between P-rem and the total contents of pedogenic Fe (FeDCB) and AlDCB (Al resulting from the isomorphic substitutions in Fe oxides and partial dissolution of Al oxides of low crystallinity) (r = -0.57*
; r = -0.75*
, respectively) and also between P-rem and Fe of low crystallinity (FeOX; r = -0.50
*
). Unlike the P-rem, the clay contents moderately correlated only with the FeDCB (r = 0.66
**
) (Table 3). The lack of correlation between the clay content and FeOX is an indication that soil clay accumulation is not necessarily associated with the presence of Fe oxides of low crystallinity, which are described as having a high capacity of P adsorption (Hernández and Meurer, 1998; Donagemma et al., 2008). In addition to crystalline Fe oxides and clay minerals 1:1 (such as kaolinite), which have a lower potential to adsorb Fe oxides of low crystallinity, they can also significantly affect the adsorption of P, mainly due to the higher quantity generally found in soils (Torrent et al., 1994; Vilar et al., 2010). In a study with 60 RS soils, Oliveira (2015) found a significant correlation, although weak (r = -0.31*
), between the P-rem and the area of kaolinite obtained by x ray diffraction. The FeOX/FeDCB ratio, which expresses the degree of crystallinity, i.e., the proportion of Fe of low crystallinity in relation to the sum of pedogenic Fe oxides, did not correlate with the P-rem (r = 0.28ns
) or with clay (r = 0.30ns
) (Table 3).
The P2O5 rates required to increase P by 1 mg kg -1
in the analyses (PBC), via the Mehlich-1 and Mehlich-3 methods, after 35 days of phosphatic fertilizer application (Table 2). The rates varied from approximately 7 to 70 kg ha-1
and 8 to 90 kg ha-1
of P2O5 for the Mehlich-1 and
0 200 400 600
0 10 20 30 40 50 60 70 0 10 20 30 40 50 60 70
0 100 200 300 400 500 600
(a) (b)
P-Rem (mg L
-1)
P-Rem (mg L
-1)
Clay content (g kg-1) Clay content (g kg-1)
ŷ = 6.62 + 49.2*e(-0.034x)
R2 = 0.54
ŷ = 10.3 + 52.02*e(-0.07x)
R2 = 0.73
r = -0.67
Figure 1. P-remaining (P-Rem) as a function of the clay content in different soil samples. (a) Soils
used in the studies with plants; (b) Soils from different regions of the state of RS (200 samples).
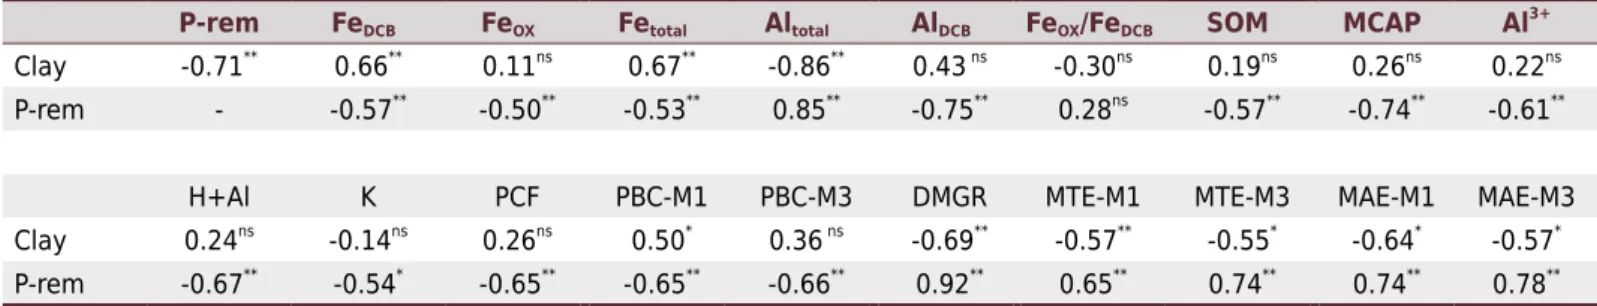
Table 3. Pearson’s simple linear correlation coefficients between P-remaining and clay with soil attributes related to the buffering
capacity of P
P-rem FeDCB FeOX Fetotal Altotal AlDCB FeOX/FeDCB SOM MCAP Al 3+
Clay -0.71**
0.66**
0.11ns
0.67**
-0.86**
0.43 ns
-0.30ns
0.19ns
0.26ns
0.22ns
P-rem - -0.57**
-0.50** -0.53** 0.85** -0.75** 0.28ns -0.57** -0.74** -0.61**
H+Al K PCF PBC-M1 PBC-M3 DMGR MTE-M1 MTE-M3 MAE-M1 MAE-M3 Clay 0.24ns
-0.14ns
0.26ns
0.50*
0.36 ns
-0.69**
-0.57**
-0.55*
-0.64*
-0.57*
P-rem -0.67**
-0.54* -0.65** -0.65** -0.66** 0.92** 0.65** 0.74** 0.74** 0.78**
ns, **, *: non-significant, significant at 1 and 5 % by the t-test, respectively. P-rem: P-remaining (60 mg L-1
); FeDCB and AlDCB: Fe and Al by dithionite citrate bicarbonate; FeOX: Fe by ammonium oxalate; Fe and Al total: by sulfuric acid attack; FeOX/FeDCB: ratio between Fe oxalate and Fe dithionite; SOM: soil organic matter; MACP: phosphorus maximum adsorption capacity; Al3+: exchangeable Al; H+Al: potential acidity; k: constant related to
the bonding energy; PCF: phosphate capacity factor; PBC-M1 and M3: P buffering capacity - rate of P2O5 necessary to increase P by 1 mg kg -1
in the analysis by the Mehlich-1 and -3 methods; DMGR: dry matter growth rate per unit of applied P2O5; MTE-M1 and M3: concentration of P extracted by
the Mehlich-1 and -3 methods at the maximum technical efficiency; MAE-M1 and M3: P content of the soil extracted by the Mehlich-1 and -3 methods
Mehlich-3 methods, respectively. The rate of P2O5 to increase P by 1 mg kg-1 is also known as the phosphate buffering capacity (PBC) of the soil (Lopes et al., 2004; Sousa et al., 2010) and is directly related to the sensitivity of the Mehlich extractor to the buffering capacity; the more sorptive the soil is, the less P is extracted by the method and the greater the PBC. This information is of great importance in defining doses for corrective fertilization to reach the critical level of P in soils (Schlindwein and Gianello, 2008; Sousa et al., 2010; Schlindwein et al., 2013). The PBC for the Mehlich-1 and Mehlich-3 methods showed a moderately negative correlation with the P-rem. Conversely, correlation with the clay content was weak and was only significant for the Mehlich-1 method (r = 0.50*
). The absent or weak relationship between the PBC and the clay content suggests that this index may not reflect the real limitations of P extraction by the Mehlich-1 and Mehlich-3 methods, and therefore, soils within the same buffering class by clay content may require very different P rates to achieve a determined level of fertility.
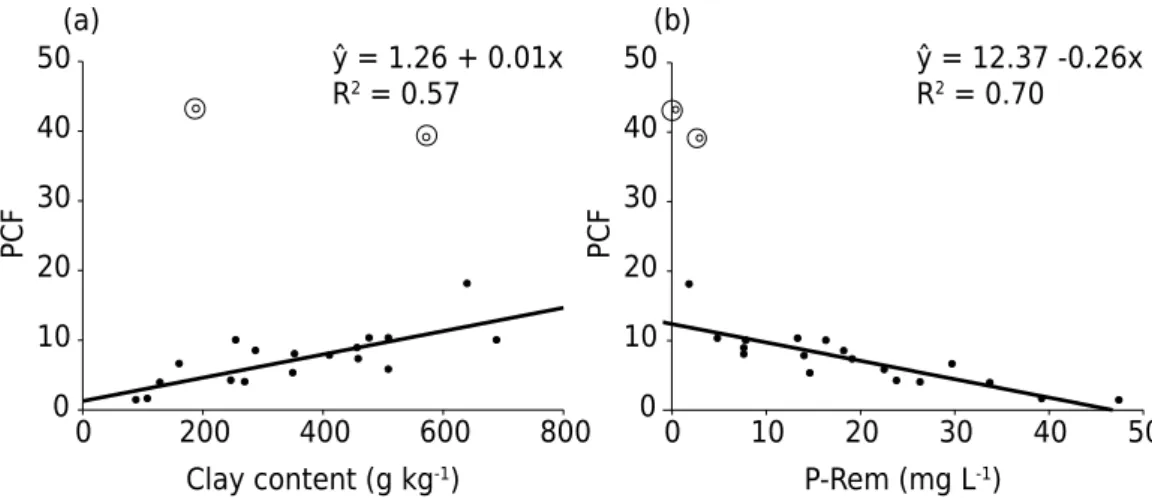
The P capacity factor (PCF) presented a negative association with P-rem (r = -0.65** ) but did not correlate with the clay content (r = 0.26ns
) (Figure 2). Although calculated in different ways (Muniz et al., 1985; Shirvani et al., 2005; Pinto, 2012), the PCF is defined by the equilibrium ratio between the quantity factor (Q - adsorbed labile P) and the intensity factor (I - solution P), and represents a measure of interdependence (ΔQ/ΔI) that exists between the solid phase and solution of the soil, which is also commonly referred to as the P buffering capacity (Novais et al., 2007). The lack of a correlation between clay and the PCF indicates that for some soils, because it is only quantitative, the clay content may be insufficient to explain the complexity of the P adsorption and desorption processes and can thus lead to errors when separating the soils in buffering classes for fertilizer recommendations. For example, although CHa-1 soil has a low clay content (Class IV - 190 g kg-1
), it presented the greatest FeOX content (11 g kg-1), which was approximately three times greater than the mean of the others and may explain its high MACP (> 9,000 kg ha-1
P2O5) and largest value of PCF (43.1). Furthermore, this soil has high Al3+
(5.8 cmolc kg -1
) and SOM (100 g kg-1
) contents, which can also contribute to P adsorption by precipitation with Al3+
and the formation of ternary complexes with SOM (Mello and Perez, 2009); as in this study, the P-rem also correlated with Al3+
(r = -0.67**
) and SOM (r = -0.57**) (Table 3). Bonfim et al. (2004) studied six soils from the state of Pernambuco and found a significant correlation of PCF with clay and P-rem, although the correlation coefficients were higher for P-rem, with values of 0.67**
and -0.91**
, respectively.
Assuming that the measurement of PCF estimates the real buffering capacity of the soil that is perceived by plants, the selection of clay content and/or P-rem as an index of this measurement may result in different classifications, mainly from soils with outlier values (Figure 2). The three soils presenting the highest PCF values were CHa1-São Francisco de Paula, CHa2-Vacaria and LVaf-Erechim, with values of 43.1, 39.0 and 18.0 (dimensionless), respectively. In the current classification adopted by the CQFSRS/SC (2004), which uses the clay content as an index, these soils are classified into three distinct buffering classes, namely, CHa-1 (Class IV - 190 g kg-1 clay), CHa-2 (Class II - 570 g kg-1 clay) and LVaf (Class I - 641 g kg-1
clay). Conversely, the three soils showed the highest MACP values (>3,500 kg ha-1 of P2O5) and lowest P-rem values (<3.0 mg L-1
). Therefore, if using the measurement of P-rem as the buffering capacity index, the three soils would be in the class of highest buffering capacity (Class I), which is consistent with their high PCF (Figure 2).
Relationship of the buffering capacity with the measurements of plant
development
extracted P content at the highest applied P rate was considered the maximum technical efficiency (MTE), as previously used by researchers in other studies (Muniz et al., 1985; Bonfim et al., 2004; Schlindwein and Gianello, 2008); however, these authors used the critical content (90 % of the MTE) instead of the MTE. In this study, the P content in the MTE was used instead of the critical content, as the latter is generally used
0 10 20 30 40 50
0 200 400 600 800
PC
F
0 10 20 30 40 50
PC
F
0 10 20 30 40 50
(a) (b)
Clay content (g kg-1) P-Rem (mg L-1)
ŷ = 1.26 + 0.01x
R2 = 0.57
ŷ = 12.37 -0.26x
R2 = 0.70
Figure 2. Regression between the P capacity factor (PCF) and the clay content (a) or the P-remaining values (P-Rem) (b). The outliers (circled points) were excluded from the regression calculation, for
two soils classified as Cambisoslo Húmico Alumínico (CHa-1 and CHa-2).
Table 4. Polynomial regression equation, coefficient of determination (R2) and phosphorus content for maximum technical efficiency
(MTE) extracted by Mehlich-1 (MTE-M1) and Mehlich-3 methods (MTE-M3)
Soil Mehlich-1 Mehlich-3
Equation(1) MTE-M1(2) R2 Equation (1) MTE-M3(2) R2
mg kg-1 mg kg-1
CHa-1 ŷ = 0.38 + 0.1397 x 17.0 0.82 ŷ = 0.50 +0.167 x 12.9 0.85
CHa-2 ŷ = -0.67 + 0.267 x 24.1 0.92 ŷ = -0.19 + 0.185 x 27.0 0.75
CX ŷ = -3.19 + 0.467 x 36.1 0.94 ŷ = -1.27 + 0.384 x 39.5 0.94
LVaf ŷ = 2.79 + 3.886 x 19.0 0.98 ŷ = -1.26 + 4.63 x 18.9 0.94
LVd-1 ŷ = -0.45 + 0.283 x 33.2 0.98 ŷ = -0.29 + 0.386 x 23.0 0.96
LVd-2 ŷ = -1.64 + 0.61 x - 0.0103 x2
29.5 0.96 ŷ = -1.27 + 0.644 x - 0.011 x2
23.1 0.94
LVdf ŷ = -0.19 + 0.257 x 21.3 0.93 ŷ = 0.35 + 0.261 x 18.8 0.85
LVef ŷ = -9.56 + 1.56 x - 0.034 x2
22.8 0.90 ŷ = -6.98 + 1.39 x - 0.031 x2
21.9 0.91 MEk ŷ = -14.86 + 2.08 x - 0.028 x2
37.1 0.93 ŷ = -4.04 + 1.02 x - 0.0099 x2
51.8 0.88 MEo ŷ = -25.4 + 4.92 x - 0.1679 x2
14.6 0.96 ŷ = -10.87 + 2.617 x - 0.078 x2
16.5 0.95
MXo ŷ = -7.89 + 0.303 x 80.1 0.81 ŷ = -1.03 + 0.454 x - 0.001 x2 51.1 0.95
NVdf ŷ = -5.20 + 1.384 x 13.2 0.96 ŷ = -2.27 + 1.22 x 12.2 0.99
PBAC ŷ = -0.91 + 0.226 x 37.0 0.98 ŷ = -0.73 + 0.236 x 34.6 0.97
PVA-1 ŷ = -21.62 +2.82 x - 0.060 x2
23 0.63 ŷ = -28.54 + 4.38 x - 0.113 x2
19.4 0.74
PVA-2 ŷ = -0.92 + 0.26 x - 0.0016 x2
81.2 0.99 ŷ = -0.24 + 0.196 x - 0.001 x2 98.3 0.99
PVA-3 ŷ = -2.27 + 0.44x - 0.0048x2
46.7 0.94 ŷ= -0.62 + 0.350 x - 0.0034 x2
51.5 0.95
PVd ŷ = -2.21 + 0.57 x - 0.0052 x2
50.4 0.96 ŷ = -1.48 + 0.446 x - 0.0034 x2
65.6 0.97 RR ŷ = -20.68 + 2.52 x - 0.044 x2
28.7 0.91 ŷ = -10.35 + 1.58 x - 0.024 x2
32.7 0.97 SXe ŷ = -2.13 + 0.52 x - 0.0055 x2 47.2 0.95 ŷ = -0.08 + 0.33 x - 0.0026 x2 63.9 0.96
VEo2 ŷ = -10.33 + 2.11 x - 0.047 x2
22.3 0.92 ŷ = -8.29 + 1.51 x - 0.0268 x2
28.2 0.86
(1)
Regression equation adjusted between phosphorus contents (x = mg kg-1
in reference to soil content at the maximum economic efficiency, which is obtained in field calibration experiments, is influenced by the price of fertilizers and products (Cate and Nelson, 1973) and usually fluctuates around 90 % of the MTE (CQFSRS/SC, 2004). However, due to the difficulty of conducting a field calibration experiment, the P contents were used in the MTE as analogues of the critical content to perform correlation analysis for the selection of indices.
Phosphorus levels for the MTE obtained by the Mehlich-1 and Mehlich-3 methods varied as a function of the different soil buffering capacities (Table 4). The soils presenting the extreme values were NVdf-Rodeio Bonito and PVA2-Tupanciretã, with levels of 13.2 and 81.2 mg kg-1
with Mehlich-1 and 12.2 and 98.3 with Mehlich-3, respectively. The contents of “available P” for the MTE of both extractors presented moderately negative correlations (0.5< |r| <0.75) with the main measurements associated with the soil buffering capacity (MACP, PCF, PBC). This indicates that the increase in soil buffering capacity reduces the amount of P extracted by the methods for MTE, corroborating with the CQFSRS/SC (2004), which is attributed to lower critical contents to compensate for the sensitivity of the Mehlich-1 extractor as the buffering capacity of the soils increases, in this case, using the clay content as the index.
The content of “available P” for the MTE was significantly correlated with both the clay content and the P-rem values. The correlation was negative with coefficients of -0.57** and -0.55* for clay and positive with coefficients of 0.65**
and 0.74**
for the P-rem for the Mehlich-1 and Mehlich-3 models, respectively (Table 3). Although the coefficients were moderate, the correlations indicate that compared to clay, the P-rem showed a greater capacity for the identification of sensitivity of the extractors considering the soil buffering capacity. Similarly to that which occurred in the MTE, the P contents for which the maximum absorption efficiency (MAE) were also better related to the P-rem (Table 3). This information corroborates with that of Bonfim et al. (2004), who found better relations of the critical content of P in the soil for Brachiaria brizantha with the P-rem than with clay, with coefficients of -0.31*
and -0.38**
for clay and 0.54**
and 0.68**
for P-rem for the Mehlich-1 and Mehlich-3 models, respectively. Similarly, in a study of soils from the state of Pernambuco, Broggi et al. (2010) found higher correlation coefficients between the critical content and P-rem compared to that with clay.
The shoot dry mass growth rate (DMGR) per unit of P2O5 applied to the soil was best related to the values of P-rem compared to clay (Table 3). The DMGR showed an extremely strong, positive correlation with P-rem (r = -0.92**) and a moderate correlation with clay (r = -0.69**). The DMGR is dependent on the sorption capacity and the original P content of the soils. Thus, low growth rates can occur in soils where “available P” levels are high or in very sorptive soils, which require high P rates to compensate for the low availability to plants as a function of the strong adsorption to the solid phase. Because the majority of selected soils presented low concentrations of “available P”, the DMGR may be associated with the soil buffering capacity, which can be determined by the correlation (r >0.60) with other measurements related to the soil buffering capacity (MACP, PCF and PBC). However, due to the higher correlation coefficients, the P-rem index was more sensitive to variations of the response potential of plants to the applied P.
adsorption process can alter the P-rem values in soil over the years and, therefore, modify the class; this practice would alter the critical P content in the interpretation, whereas in practice, it may not necessarily be altered. For example, Guareschi et al. (2012) found an increase of P-rem in the soil of 6.9 to 16.7 mg L-1
in an area with pasture (Brachiaria decumbens) and in a no-tillage planting system (20 years of implantation), respectively. Therefore, Sousa and Lobato (2003) suggested that the P-rem is determined in soils that have not been subject to phosphatic fertilizers or with high response potential to P. The authors also suggested not to repeat the process in subsequent years because it is expected that its value increases in old areas, those well fertilized with P and those with consolidation and evolution of the no-tillage planting system.
CONCLUSIONS
P-rem is a more reliable index of the soil buffering capacity than clay content and may be used to classify soils of the state of RS into buffering classes if there is the intention to continue using both Mehlich-1 and Mehlich-3 to estimate P availability to plants.
A significant relationship was observed between P-rem and clay, but the adjusted equation was inadequate to propose critical levels for P-rem.
Concomitant use of clay content and P-rem for the separation of soils from RS into classes for interpretation of P extracted by the Mehlich-1 and Mehlich-3 methods may lead to different classifications of some soils.
REFERENCES
Alcântara FA, Furtini Neto A, Resende AV. Extraction methods for phosphorus and their relationship with soils phosphorus-buffer capacity estimated by the remaining-phosphorus
methodology-a pot study with maize. Commun Soil Sci Plant Anal. 2008;39:603-15. doi:10.1080/00103620701828395
Alvarez V VH, Novais RF, Barros NF, Cantarutti RB, Lopes AS. Interpretação dos resultados das análises de solos. In: Ribeiro AC, Guimarães PTG, Alvarez V VH, editores. Recomendação para o uso de corretivos e fertilizantes em Minas Gerais: 5ª Aproximação. Viçosa, MG: Comissão de
Fertilidade do Solo do Estado de Minas Gerais; 1999. p.25-32.
Alvarez V VH, Novais RF, Dias LE, Oliveira JA. Determinação e uso do fósforo remanescente. Bol
Inf SBCS. 2000;25:27-32.
Anghinoni I, Bohnen H. Avaliação da disponibilidade de fósforo através de métodos químicos.
Agropec Sulriograndense. 1974;10:127-33.
Bache BW, Williams EG. A Phosphate sorption index for soils. J Soil Sci. 1971;22:209-301. doi:10.1111/j.1365-2389.1971.tb01617.x
Bonfim SEM, Freire FJ, Santos MVF, Silva TJA, Freire MBGS. Níveis críticos de fósforo para Braquiaria brizantha e suas relações com características físicas e químicas em solos
Pernambuco. Rev Bras Cienc Solo. 2004;25:323-8. doi:10.1590/S0100-06832004000200006
Bortolon L, Gianello C, Kovar JL. Phosphorus availability to corn and soybean evaluated by three soil-test methods for southern Brazilian soils. Commun Soil Sci Plant Anal. 2010;42:39-49. doi:10.1080/00103624.2011.528488
Bortolon L, Gianello C, Schlindwein JA. Avaliação da disponibilidade de fósforo no solo para o milho pelos métodos Mehlich-1 e Mehlich-3. Sci Agrár. 2009;10:305-12.
Brasil. Ministério da Agricultura. Levantamento de reconhecimento dos solos do Rio Grande do Sul Recife: DNPEA-MA; 1973. (Boletim técnico, 30).
Broggi F, Oliveira AC, Freire FJ, Freire MBGS, Nascimento CWA. Fator capacidade de fósforo em
solos de Pernambuco mineralogicamente diferentes e influência do pH na capacidade máxima
de adsorção. Cienc Agrotec. 2011;35:77-83. doi:10.1590/S1413-70542011000100009
Cate RB, Nelson LA. Discontinuous models for rapid correlation, interpretation and utilization of soil analysis and fertilizer response data international soil fertility evaluation and improvement program. [S.l.]: 1973. (Technical Bulletin, 7).
Claessen MEC, organizador. Manual de métodos de análise de solo. 2ª ed. Rio de Janeiro: Centro Nacional de Pesquisa de Solos; 1997.
Comissão de Química e Fertilidade do Solo-RS/SC - CQFSRS/SC. Manual de adubação e calagem para os estados do Rio Grande do Sul e Santa Catarina. Porto Alegre: SBCS, Núcleo Regional
Sul; 2004.
Corey RB. Soil test procedures: correlation. In: Brown JR, editor. Soil testing: sampling, correlation, calibration end interpretation. Madison: Soil Science Society of America; 1987. p.15-22.
Corrêa RM, Nascimento CWA, Rocha AT. Adsorção de fósforo em dez solos do Estado de
Pernambuco e suas relações com parâmetros físicos e químicos. Acta Sci Agron. 2011;33:153-9.
doi:10.4025/actasciagron.v33i1.3129
Donagemma GK, Ruiz HA, Fontes F. Fósforo remanescente em argila e silte retirados de
Latossolos após pré-tratamentos na análise textural. Rev Bras Cienc Solo. 2008;32:1785-91. doi:10.1590/S0100-06832008000400043
Fontana A, Pereira MG, Salton JC, Loss A, Cunha TJ. Fósforo remanescente e correlação com as
substâncias húmicas em um Latossolo Vermelho sob diferentes sucessões de cultura em plantio direto. Rev Bras Agrocienc. 2008;14:161-6. doi:10.18539/CAST.V14I1.1900
Fox RL, Kamprath EJ. Phosphate sorption isotherms for evaluating the phosphate requirements of soils. Proc Am Soc Agron. 1970;34:902-7. doi:10.1007/BF02182893
Freire FJ. Sistema para cálculo do balanço nutricional e recomendação de corretivos e
fertilizantes para cana de açúcar [tese]. Viçosa, MG: Universidade Federal de Viçosa; 2001.
Gatiboni LC, Kaminski J, Rheinheimer DS, Flores JPC. Biodisponibilidade de formas de fósforo acumuladas em solo sob sistema plantio direto. Rev Bras Cienc Solo. 2007;31:691-9. doi:10.1590/S0100-06832007000400010
Goldberg S, Sposito G. On the mechanism of specific phosphate adsorption by
hydroxylated mineral surfaces: a review. Commun Soil Sci Plant Anal. 1985;16:801-21. doi:10.1080/00103628509367646
Guareschi RF, Pereira MJ, Perin A. Deposição de resíduos vegetais, matéria orgânica leve,
estoques de carbono e nitrogênio e fósforo remanescente sob diferentes sistemas de manejo no cerrado goiano. Rev Bras Cienc Solo. 2012;36:909-20. doi:10.1590/S0100-06832012000300021
Hernández J, Meurer EJ. Adsorção de fósforo e sua relação com formas de ferro em dez solos do
Uruguai. Rev Bras Cienc Solo. 1998;22:223-30. doi:10.1590/S0100-06831998000200007
Lopes SA, Wiethölter S, Guilherme LRG, Silva CA. Sistema plantio direto: bases para o manejo da fertilidade do solo. São Paulo: ANDA; 2004.
Mehra OP, Jackson ML. Iron oxide removal from soils and clays by a
dithionite-citrate system buffered with sodium bicarbonate. Clays Miner. 1960;5:317-27.
doi:10.1346/CCMN.1958.0070122
Mello JWV, Perez DV. Equilíbrio químico das reações no solo. In: Melo VF, Alleoni LRF, editores Química e mineralogia do solo. Viçosa, MG: Sociedade Brasileira de Ciências do Solo; 2009.
p.151-249.
Miyazawa M, Barbosa GMC. Efeitos da agitação mecânica e matéria orgânica
na análise granulométrica do solo. Rev Bras Eng Agric Amb. 2011;15:680-5. doi:10.1590/S1415-43662011000700005
Muniz AS, Novais RF, Barros NF, Neves JCL. Nível crítico de fósforo na parte aérea da soja como
Novais RF, Smyth TJ, Nunes FN. Fósforo. In: Novais RF, Alvarez V VH, Barros NF, Fontes RLF, Cantarutti RB, Neves JCL, editores. Fertilidade do solo. Viçosa, MG: Sociedade Brasileira de
Ciência do Solo; 2007. p.471-550.
Novais RF, Smyth TJ. Fósforo em solo e planta em condições tropicais Viçosa, MG: UFV; 1999.
Oliveira CMB. Comportamento dos métodos Mehlich 1, Mehlich 3 e resina trocadora de
ânions frente ao poder tampão do solo e à utilização de fosfatos naturais [dissertação]. Lages:
Universidade do Estado de Santa Catarina; 2010.
Oliveira JS. Mineralogia e adsorção de fósforo em solos do Rio Grande do Sul [dissertação]. Porto Alegre: Universidade Federal do Rio Grande do Sul; 2015.
Pinto FA. Sorção e dessorção de fósforo em solos de Cerrado [dissertação]. Jataí: Universidade
Federal de Goiás; 2012.
Santos HG, Jacomine PKT, Anjos LHC, Oliveira VA, Oliveira JB, Coelho MR, Lumbreras JF, Cunha TJF. Sistema brasileiro de classificação de solos. 3ª ed. Rio de Janeiro: Embrapa Solos; 2013.
Schlindwein JA, Bortolon L, Fioreli-Pereira EC, Bortolon ESO, Gianello C. Phosphorus and potassium fertilization in no till southern Brazilian soils. Agric Sci. 2013;4:39-49. doi:10.4236/as.2013.412A004
Schlindwein JA, Gianello C. Calibração de métodos de determinação de fósforo em solos cultivados sob sistema plantio direto. Rev Bras Cienc Solo. 2008;32:2037-49. doi:10.1590/S0100-06832008000500025
Schlindwein JA. Calibração de métodos de determinação e estimativa de doses de fósforo e potássio em solos sob sistema plantio direto [tese]. Porto Alegre: Universidade Federal do Rio Grande do Sul; 2003.
Schwertmann U. Differenzierung der eisenoxide des bodens durch extraktion mit ammoniumoxalat-lösung. Z Pflanz Bodenkunde. 1964;105:194-202.
doi:10.1002/jpln.3591050303
Shirvani MH, Shariatmadari H, Kalbasi M. Phosphorus buffering capacity indices as related to
soil properties and plant uptake. J Plant Nutr. 2005;28:537-50. doi:10.1081/PLN-200049235
Sikora FJ, Howe PS, Hill LE, Reid DC, Harover DE. Comparison of colorimetric and ICP
determination of phosphorus in Mehlich-3 soil extracts. Commun Soil Sci Plant Anal. 2005;36:875-87. doi:10.1081/CSS-200049468
Sousa DMG, Lobato E. Cerrado: correção do solo e adubação. Planaltina: Embrapa Cerrados; 2002.
Sousa DMG, Rein TA, Goedert WJ, Lobato E, Nunes RS. Fósforo. In: Prochnow LI, Casarin V, Stipp SR, editores. Boas práticas para uso eficiente de fertilizantes. Piracicaba: IPNI; 2010. v.2. p.67-132. Sousa Neto EL, Figueiredo LHA, Beutler NA. Dispersão da fração argila de um Latossolo
sob diferentes sistemas de uso e dispersantes. Rev Bras Cienc Solo. 2009;33:723-8. doi:10.1590/S0100-06832009000300024
Streck EV, Kämpf N, Dalmolin RSD, Klamt E, Nascimento PC, Schneider P, Giasson E, Pinto LFS.
Solos do Rio Grande do Sul. 2ª ed. Porto Alegre: Emater: 2008.
Tedesco MJ, Gianello C, Bissani CA, Bohnen H, Volkweiss SJ. Análise de solo, plantas e outros
materiais. 2ª ed. Porto Alegre: UFRGS; 1995. (Boletim técnico, 5).
Torrent J, Schwertmann U, Barrón V. Phosphate sorption by natural hematites. Eur J Soil Sci.
1994;45:45-51. doi:10.1111/j.1365-2389.1994.tb00485.x
Vilar CC, Costa CS, Hoepers A, Souza Junior IG. Capacidade máxima de adsorção de fósforo relacionada a formas de ferro e alumínio em solos subtropicais. Rev Bras Cienc Solo.
2010;34:1059-68. doi:10.1590/S0100-06832010000400006