NitrogeN miNerAliZAtioN iN tropicAl soils UNder
eUcAlyptUs
philip James smethurst(1)*, José leonardo de moraes gonçalves(2), Ana paula pulito(2),
simone gomes(2), Keryn paul(3), clayton Alcarde Alvares(4,5) and José carlos Arthur Júnior(4)
(1) CSIRO, Hobart, Australia.
(2) Universidade de São Paulo, Escola Superior de Agricultura “Luiz de Queiroz”, Departamento de Ciência Florestal, Piracicaba, São Paulo, Brasil.
(3) CSIRO, Canberra, Australia.
(4) Instituto de Pesquisas e Estudos Florestais, Piracicaba, São Paulo, Brasil. (5) North Carolina State University, Raleigh, North Carolina, USA.
* Corresponding author.
E-mail: [email protected]
ABstrAct
the soil Nitrogen Availability predictor (sNAp) model predicts daily and annual rates of net N mineralization (NNm) based on daily weather measurements, daily predictions of soil water and soil temperature, and on temperature and moisture modifiers obtained during aerobic incubation (basal rate). the model was based on in situ measurements of NNm in Australian soils under temperate climate. the purpose of this study was to assess this model for use in tropical soils under eucalyptus plantations in São Paulo State, Brazil. Based on field incubations for one month in three, NNm rates were measured at 11 sites (0-20 cm layer) for 21 months. the basal rate was determined in in situ incubations during moist and warm periods (January to march). Annual rates of 150-350 kg ha-1 yr-1 NNm predicted by the sNAp model were reasonably accurate (r2 = 0.84). in other periods, at lower moisture and temperature, NNm rates were overestimated. therefore, if used carefully, the model can provide adequate predictions of annual NNm and may be useful in practical applications. for NNm predictions for shorter periods than a year or under suboptimal incubation conditions, the temperature and moisture modifiers need to be recalibrated for tropical conditions.
Keywords: forest soil, soil temperature, process-based model.
iNtrodUctioN
A quantitative understanding of nitrogen (N)
pools and fluxes can underpin improved N fertiliser
management in plantation forestry (Smethurst and Nambiar, 1990; Smethurst et al., 2004; Corbeels et al., 2005; Laclau et al., 2010) and agriculture (Keating et al., 2003; Manzoni and Porporato, 2009; Sansoulet et al., 2014; Thorburn et al., 2010). Net N mineralization (NNM), a key component of the N cycle, can be measured reliably using an unsophisticated in situ core technique (Raison et al., 1987). However, this technique is labour-intensive, which often precludes its use in N cycling research or fertiliser management.
Many models that incorporate predictions of NNM in forest soils are mechanistic or process-based, but none have been well-studied, and they require calibration and considerable input data, making them labour-intensive (Kirschbaum and Paul, 2002). A hybrid approach between measurement and modelling of NNM may be more cost-effective. Paul et al. (2002; 2003a,b; 2004) used a large Australian database of NNM measurements, from 33 native forest and plantation sites, to develop the SNAP (Soil Nitrogen Availability Predictor) model that is much less labour-intensive, and provided reasonable estimates of daily and annual NNM rates. The method was based on laboratory incubations at non-limiting soil water and warm temperatures (e.g. 37 oC), which provided a ‘basal
rate’ for NNM. Sub-optimal temperature and
water was accounted for using modifiers of the
basal rate. Rates of NNM determined in laboratory incubations were standardized to 40 oC using an exponential temperature response function. For
the water response, rates were fitted to a sigmoidal
function given by the upper and lower limits of
field-observed soil water content. Daily soil water and temperature were predicted for field conditions
using simple empirical sub-models calibrated for 18 sites in southern Australia. These soil and water predictions were used to adjust the basal
NNM rate from which daily rates in the field could
be estimated. These rates could then be tallied for a given period, e.g., monthly, seasonal or annual estimates. Annual estimates of NNM agreed well with in situ measurements across a range of sites (R2 = 0.76; Paul et al., 2002). The SNAP model was
most recently used at the headwater catchment scale as a component to understand and model the pools
and fluxes of mineral N in soil, ground water and
stream water (Smethurst et al., 2014).
As the SNAP method was developed using data from a temperate Australian climate, uncertainties remain regarding its usefulness under tropical conditions in Australia and elsewhere. Such uncertainties arose because tropical conditions have a degree of seasonal synchrony of soil temperature and water conditions favourable for mineralization. In the tropics, high soil temperature and water levels can often coincide, whereas in temperate regions favourable conditions are more asynchronous. In addition, parameterization of the SNAP model is subject to a high degree of empiricism. These factors together justify this study.
Brazil has a large and expanding tropical
eucalyptus plantation estate with increasing
evidence of N deficiency (Pulito, 2009) and rates of
N fertiliser have been raised during the past decade
to remedy this deficiency (Gonçalves et al., 2004). Part of the Brazilian eucalypt plantation industry resUmo: AVALIAÇÃO DO MODELO SNAP PARA PREDIZER A MINERALIZAÇÃO DE
NITROGÊNIO EM SOLOS DE PLANTAÇÕES DE EUCALIPTO
O modelo Soil Nitrogen Availability Predictor (SNAP) prevê as taxas diárias e anuais de mineralização líquida de N (MLN) a partir de medições diárias das condições climáticas, de predições diárias da umidade e temperatura do solo e de índices de correção da temperatura e umidade obtidos durante os processos de incubação aeróbica (taxa básica) para determinar a MLN. O modelo foi desenvolvido com base em medições in situ da MLN em solos australianos sob clima temperado. O objetivo deste estudo foi avaliar a adequação desse modelo para o uso em solos tropicais sob plantações de eucalipto no Estado de São Paulo, Brasil. Com base em incubações de campo por um mês, as taxas de MLN (0-20 cm de profundidade) foram medidas em 10 locais durante 21 meses. Os dados obtidos no período úmido e quente (janeiro a março) proveram as taxas básicas de mineralização. Taxas anuais de MLN in situ variando entre
150 e 350 kg ha-1 ano-1 de N foram preditas com boa precisão pelo modelo SNAP (R2 = 0,84). Em outros
períodos, sob condições de umidade e temperatura menores, as taxas de MLN foram superestimadas. Assim, com o uso cuidadoso, o modelo pode proporcionar predições adequadas da MLN anual, podendo ser útil em aplicações práticas. Para predições da MLN em períodos menores do que um ano ou se as condições de incubação estiverem fora da faixa ideal, os índices de correção da temperatura e umidade precisam ser recalibrados para condições tropicais.
currently uses the 3-PG process-based model
(Almeida et al., 2010; Stape et al., 2010; Gonçalves et
al., 2014), but 3-PG does not specifically include any
nutrient. As SNAP was the only model available and largely based on data from the plantation industry, industry partners of this research project were keen to use SNAP to enhance their understanding of NNM and its predictions for their soils.
This report is an evaluation of the SNAP model in soils under eucalyptus plantations in São Paulo State, Brazil. The hypothesis was that SNAP predictions of NNM rates would be comparable with rates estimated from in situ incubations.
mAteriAl ANd methods
sites
Eleven sites were identified that were expected
(based on the soil clay content) to cover a wide range
of rates of NNM and N deficiency degrees in the
soil surface layers. These sites have been reported previously as a part of other studies that included
an N fertiliser experiment at each site with at least three replicates (Gomes, 2009; Pulito, 2009). The experiments were located in the south-eastern part
of São Paulo State, Brazil, close to nine cities, and
were conducted by plantation companies (Duratex,
Suzano, VCP now Fibria) or the Forest Science Department of the University of São Paulo. The
experiments consisted of stands of Eucalyptus grandis or Eucalyptus grandis x urophylla, managed with standard practices of cultivation, watering, weed and pest control, and fertiliser application. Selected site characteristics are provided in table 1. The soil types were the most commonly used for
forest plantations in São Paulo State (Gonçalves, 2002; Gonçalves et al., 2013).
Each experiment included one control treatment
to which 4 - 42 kg ha-1 N was applied, close to each
seedling, within a month after planting. Details of other treatments can be found in Pulito (2009), but were not reported here as they were not used to appraise the SNAP model. Plots were arranged in a randomised block design with at least three replicates. Each plot included an unmeasured buffer strip, and at least 16 trees at a spacing of 3.0 × 2.0 m; measured plot area range was 96-360 m2.
measurements
The entire plot area, excluding the outer 3 m of
each plot, was randomly sampled, using a variation of the in situ core technique (Raison et al., 1987; Gomes,
2009) in the 0-20 cm layer, during approximately
one month per season (four times per year). In situ
core measurements were carried out at all sites for
table 1. selected characteristics of the experimental sites measured in samples of the 0-20 cm layer
site Soil classification(1) climate type(2) rainfall(3) Age(4) c:N total c total N p(5) ph(cacl 2)(6)
mmyr-1 yr g kg-1 mg kg-1 mg dm-3 Agudos (AGU) Typic Hapludox
(Latossolo Vermelho)
Cfa 1170 2.3 20 7.7 387 7.0 4.3
Altinópolis (ALT)
Typic Quartzipsamment (Neossolo Quartzarênico)
Cwa 1517 5.7 22 7.0 323 9.5 4.0
Angatuba
(ANG) (Neossolo Quartzarênico)Typic Quartzipsamment
Cfa 1262 1.8 24 7.1 301 6.5 4.0
Botucatu (BOT)
Typic Quartzipsamment (Neossolo Quartzarênico)
Cfa 1302 2.7 24 9.2 387 3.3 3.9
Capão Bonito (CB1)
Typic Hapludox (Latossolo Amarelo)
Cfa 1210 8.6 12 9.3 810 5.0 4.1
Capão Bonito 2 (CB2)
Typic Hapludox (Latossolo Vermelho)
Cfa 1210 0.9 14 7.9 589 2.4 2.6
Capão Bonito 3 (CB3)
Typic Dystropept
(Cambisol distrófico) Cfa 1210 1.1 18 13.4 774 2.7 3.9
Itatinga (ITA) Typic Hapludox (Latossolo Vermelho-Amarelo)
Cfa 1308 5.3 19 18.8 981 4.3 4.4
Paraibuna (PAR)
Typic Hapludox (Latossolo Vermelho-Amarelo)
Cfb 1249 10.9 19 24.5 1267 45.9 4.9
São Miguel Arcanjo (SMA)
Typic Hapludox (Latossolo Vermelho-Amarelo)
Cfb 1174 1.3 12 10.8 893 5.2 5.2
Votorantim (VOR)
Typic Paleudult (Argissolo Vermelho-Amarelo)
Cfb 1287 1.3 23 29.7 1276 4.6 4.6
(1) Gonçalves (2002), Gonçalves et al. (2012) for ITA site, Alvares et al. (2011) for CB sites; (2) Alvares et al. (2013); (3) Average annual rainfall from nearby weather stations; (4) Age of plantation in January 2008; (5) Resin-extractable-P; (6) pH measured in 0.01 mol L-1 CaCl
the year January to December 2008, which was the period used for the comparison of the measured annual rates. Soil cores were randomly sampled from the plots in a diagonal transect using steel tubes (length 30 cm, diameter 5 cm). Five initial
soil cores were bulked and mixed, and likewise five field-incubated cores. Soil cores were collected from
11 sites within a period of 8 days, which avoided large climate variations between sites. Incubations were conducted for one month every three months. The tubes were separately wrapped in plastic bags and transported in a vertical position (as originally in the
soil) to the laboratory in insulated boxes (temperature
2 °C). Refrigeration was used to minimise microbial
activity and N mineralization prior to extraction. Soil samples remained refrigerated until N extraction, and extractions were performed within two days after collection. For mineral N extraction, 10 g of soil (< 2 mm) was sampled, extracted (50 mL 2 mol L-1 KCl)
and analysed for NH+4 and NO−3 bystandard methods (Gomes, 2009). Soil water of each sample was
measured by weight loss when dried at 105 °C. Net N mineralization was calculated as the difference between the mineral N content (ammonium plus
nitrate) of the final and initial cores.
Soil temperatures were measured hourly using
thermistor sensors, of which daily maximum and
minimum values for the measurement period were recorded. Measurements were made at a depth of 10 cm at three locations per site for each 1-month in situ incubation. Daily maximum and minimum values
were averaged for each period to provide an estimate of the average soil temperature at 10 cm depth for the period. Soil water was measured gravimetrically in
bulked and mixed initial and final samples, as part of
the in situ core technique. Bulk density was measured in a separate set of soil cores (n = 3).
model
The SNAP model estimates field rates by adjusting a basal rate (k, determined by soil incubation) by soil temperature (Tm) and soil water
(Wm) modifiers (Paul et al., 2002; 2003a):
Nmin = k × Tm × Wm Eq. 1
Ideally, the basal rates are determined in incubations under constant soil temperature and water conditions highly favourable to mineralization,
but here instead one period of the field incubations was used. The modifier equations were:
Tm = exp[3.36(T-40/(T+31.79)] Eq. 2
where T is soil temperature (oC), and
Wm = 1/(1+6.63 e-5.69RFWC) Eq. 3 where RFWC is the relative field water content (defined as the water content relative to the upper
and lower limit of water content observed in the
field). Inputs required for SNAP were limited to
the readily measurable; climatic data are entered
on a daily basis, leaf area index (LAI) of the stand,
estimated depth of water uptake, litter mass and height, and fraction of soil surface area covered by the canopy, weeds or understorey and litter.
Soil water and temperature at a particular depth and date are predicted through simple sub-models of soil temperature (Paul et al., 2004) and soil water (Paul et al., 2003b), which had been calibrated across
many different soil types, depths and textural classes.
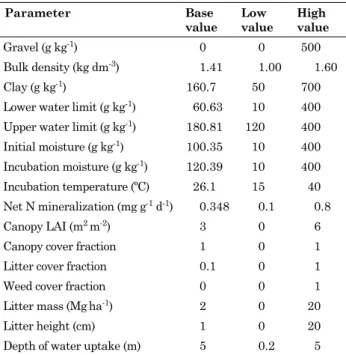
sensitivity analysis
To determine the sensitivity of model predictions to variations in input parameters, the percentage change in NNM rates resulting from a change in an input value within subjective reasonable limits, one input at a time was determined, for simulation of NNM at the Agudos site. Variations in input parameters that were tested are listed in table 2.
statistical analyses
Relationships between observations and predictions for soil water, soil temperature, and net N mineralization were described by regression
analysis and plotted, with a 95 % confidence interval
of prediction. SigmaPlot© software was used for
these analyses. Regression performance was assessed by using an R2 value and calculating the model efficiency (EF) = 1 - (SS/MS), where SS is the
residual sum of squares, and MS the sum of squares of the differences between each measurement and the mean of the measurements (Soares et al., 1995).
table 2. Base, low and high values of parameters used for the sensitivity analysis
parameter Base
value
low value
high value
Gravel (g kg-1) 0 0 500
Bulk density (kg dm-3) 1.41 1.00 1.60
Clay (g kg-1) 160.7 50 700
Lower water limit (g kg-1) 60.63 10 400 Upper water limit (g kg-1) 180.81 120 400 Initial moisture (g kg-1) 100.35 10 400 Incubation moisture (g kg-1) 120.39 10 400 Incubation temperature (ºC) 26.1 15 40 Net N mineralization (mg g-1 d-1) 0.348 0.1 0.8 Canopy LAI (m2 m-2) 3 0 6
Canopy cover fraction 1 0 1
Litter cover fraction 0.1 0 1
Weed cover fraction 0 0 1
Litter mass (Mgha-1) 2 0 20
Litter height (cm) 1 0 20
resUlts
soil temperature and soil water
M e a s u r e d a n d p r e d i c t e d r a n g e s o f s o i l
temperature were both approximately 16-28 °C, with a linear relationship that approximated a 1:1 fit, 95 % confidence intervals of prediction of approximately ±4 °C, and a tendency to
overestimate at higher temperatures (Figure 1). Soil temperature in this case was measured as the
mean maximum plus mean minimum temperature
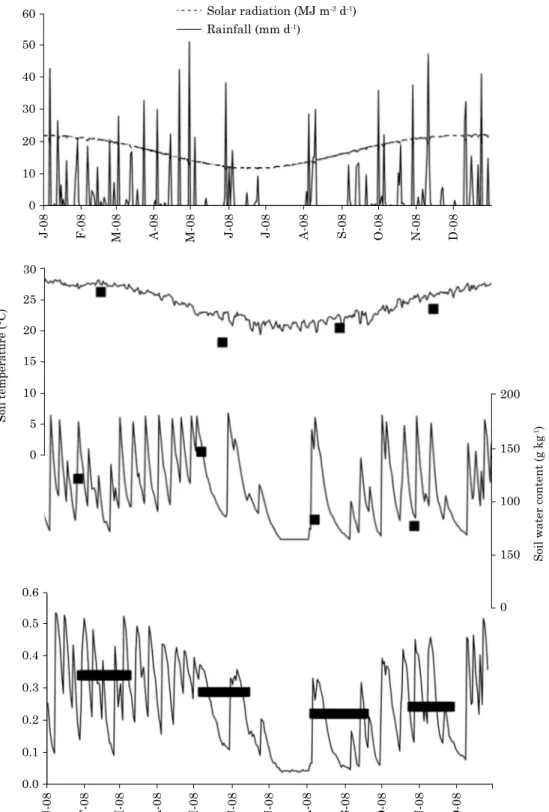
divided by two, averaged every three months. The SNAP model predicted daily soil temperatures, which were averaged for each 3 month period for
comparison with field measurements. Predicted
daily soil temperature was lowest in July and
highest in January (example for one site shown in figure 2).
The range of measured soil water was 10 to 380 g kg-1 (Figure 3). The range for predicted soil
water was slightly less (20 to 320 g kg-1), with a
linear relationship between the two that approached
a 1:1 fit, and with 95 % confidence intervals of prediction of approximately ±90 g kg-1. Predicted
daily soil water content was minimal and most
prolonged during the dry season, but maximal
(saturation) on many occasions throughout the year
except in the dry season (Figure 2).
Annual mineralization and seasonality
Measured NNM rates in the surface soil layer (0-20 cm) ranged from 148 to 340 kg ha-1 yr-1 N and
were weakly related to clay content (R2 = 0.43),
which is used as a general indicator of soil fertility in Brazilian forest plantations. Predicted annual rates
were not significantly different from rates estimated
by the in situ core technique up to a predicted rate of 370 kg ha-1 yr-1 N (R2 = 0.84), but higher rates were significantly over-predicted (Figure 4). Predicted daily rates of NNM reflected the observed seasonal
pattern in temperature and stochastic pattern of soil water (Figure 2). Basal rates (SNAP results, Table 3) were poorly correlated with measured NNM rates (R2 = 0.34).
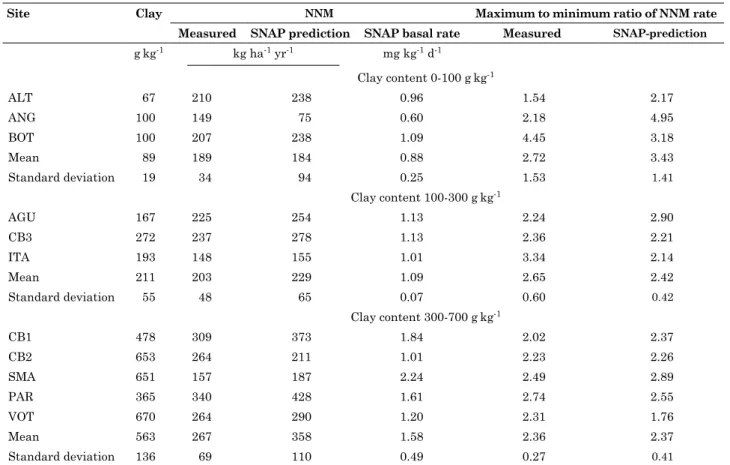
Seasonality of NNM rates was assessed at a
site as the maximum/minimum ratio of measured
seasonal rates. Due to the tropical climate, soil water content and NNM rates were lowest in the dry (June-August) and highest in the wet season (Jan-Mar). These ratios ranged from 1.5 to 4.5 across the 11 sites, which was similar for SNAP-predicted
ratios (1.8-5.0) (Table 3). There was no significant
correlation between these two sets of ratios (n = 11), but average ratios across all sites were similar, i.e. 2.5 measured compared to 2.7 predicted. Although the average SNAP-predicted seasonality was very close to the measured values, deviations at individual sites were substantial.
sensitivity analysis
The inputs with most influence on SNAP predictions were related to basal rate calculations, i.e. upper limit of water content, water content, temperature, and N mineralization during i n c u b a t i o n , w h i c h p r o d u c e d 2 - 4 o r d e r s o f magnitude of over- or under-prediction in several cases. Litter mass, cover and litter height, initial water content, and clay content had the lowest effects (Figure 5).
discUssioN
In general, these results reliably confirmed that
the SNAP model can be used to predict annual rates of NNM in tropical soils, aside from the temperate soils for which it was originally developed. As for the original development, incubations from which basal rates are calculated must be conducted under favourable soil temperature and water conditions. If not conducted in the laboratory, such conditions occur in situ in these Brazilian soils from January to March, and results based on incubations in this period generated adequate predictions of annual NNM rates and their seasonality.
The range of measured NNM rates was 148-340 kg ha-1 yr-1 N in the 0-20 cm soil layer.
Additional N would also have been mineralized at deeper depths. Considering that the N demand by a fast-growing tropical eucalyptus plantation
can be a maximum of 163 kg ha-1 yr-1 N (Cromer
et al., 1993), it is not surprising that few of
Measured soil temperature (°C)
30
28
26
24
22
20
18
16
16 18 20 22
SNAP-predicted soil temperature (°C)
24 26 28 30
AGU ALT ANG BOT CB1 CB2 CB3 ITA PAR SMA VOT Regression 95% CI of prediction 1:1
the plantations in this study responded to N fertilization (Pulito, 2009).
To assist further studies and the application of this technology, a discussion about the sources
of error in the current analysis is indicated. Rates of NNM measured by the in situ core technique include errors discussed by Raison et al. (1987), Adams et al. (1989), and Smethurst and Nambiar (1989), which also apply to our study. These errors
60 Solar radiation (MJ m-2 d-1)
Rainfall (mm d-1) 50
30 40
20
10
0
J-08 F-08 M-08 A-08 M-08 J-08 J-08 A-08 S-08 O-08 N-08 D-08
0.6
0.5
0.3 0.4
0.2
0.1
0.0
J-08 F-08 M-08 A-08 M-08 J-08 J-08 A-08 S-08 O-08 N-08 D-08
Soil temperature (°C)
Soil water content (g kg
-1) 30
25
20
15
10
0 5
200
150
100
150
0
include potential soil disturbance, root severance,
and modified environment (temperature and water)
effects on mineralization rates occurring in in situ
cores, as well as normal sampling and laboratory errors. Hence, our measured NNM rates were probably not completely accurate, and our study included additional error, i.e. the NNM rates in
this study were measured only in one month of each three-month period, i.e. one third of the year. The rates in the two unmeasured months of each three-month period were assumed to be identical to those during the measured period, which would not have been completely true. Predicted NNM rates are highly dependent on the incubation conditions,
for influencing the estimated basal rate. Deviations
from optimal temperature and water conditions would have led to error. Additionally, temperature
fluctuations in the field might have affected the
measured rates.
Site effects on NNM have several components: climate, soil type, slope, aspect, soil surface roughness,
management effects such as forest floor removal,
cultivation, thinning, and irrigation. Climate and micro-climate effects are captured by the SNAP model via the temperature and water modifiers and sub-models, and as inputs to these submodels,
e.g. leaf area index. Some potential site effects on
NNM are captured in the measurement of basal rate, as this is affected by organic matter quality and quantity. Basal rates (i.e. NNM during aerobic
incubation) can be expected to change somewhat
during a plantation rotation of several years and may require reassessment. Although the frequency of this requirement has not been studied in relation
to the SNAP model, there are numerous examples
Measured soil water content (g kg
-1)400
300
200
100
0
0 100 200 300
SNAP-predicted soil water content (g kg-1) 400
AGU ALT ANG BOT CB1 CB2 CB3 ITA PAR SMA VOT Regression 95% CI of prediction 1:1
figure 3. soil water - measured (three-monthly on initial core soil samples) versus the predicted daily value [ŷ = 14.5 + 0.910 x, R2 = 0.75, model efficiency (EF) = 0.71].
table 3. measured and sNAp-predicted rates and seasonality of net N mineralization (NNm) at individual sites grouped according to clay content
site clay NNm maximum to minimum ratio of NNm rate
measured sNAp prediction sNAp basal rate measured sNAp-prediction
gkg-1 kg ha-1 yr-1 mg kg-1 d-1
Clay content 0-100 gkg-1
ALT 67 210 238 0.96 1.54 2.17
ANG 100 149 75 0.60 2.18 4.95
BOT 100 207 238 1.09 4.45 3.18
Mean 89 189 184 0.88 2.72 3.43
Standard deviation 19 34 94 0.25 1.53 1.41
Clay content 100-300 gkg-1
AGU 167 225 254 1.13 2.24 2.90
CB3 272 237 278 1.13 2.36 2.21
ITA 193 148 155 1.01 3.34 2.14
Mean 211 203 229 1.09 2.65 2.42
Standard deviation 55 48 65 0.07 0.60 0.42
Clay content 300-700 gkg-1
CB1 478 309 373 1.84 2.02 2.37
CB2 653 264 211 1.01 2.23 2.26
SMA 651 157 187 2.24 2.49 2.89
PAR 365 340 428 1.61 2.74 2.55
VOT 670 264 290 1.20 2.31 1.76
Mean 563 267 358 1.58 2.36 2.37
of annual changes in rates of net N mineralization or potentially mineralizable N. In seven years of measurement, Mellilo et al. (2011) found that the minimum annual rates of NNM were about 40 %
lower than the maximum. In a five-year study,
O’Connell et al. (2004) found that minimum annual
rates of NNM could be 33 % lower than the maximum.
Some differences between annual rates are due to different climatic conditions, but there can also be
a change in organic matter quality. For example, in
a three year period, Smethurst and Nambiar (1995)
found that specific rates of net N mineralization
decreased from 207 to 90 g month-1 of N t-1 C. Such
changes in organic matter quality should be assessed
by aerobic incubation for quantification of the basal
rate and its use in the SNAP model.
The sensitivity analysis provides an indication of
the relative importance of correctly defining SNAP
input values (Figure 5). Compared to input values
used for SNAP predictions at the AUG site (Table 3),
subjectively chosen low and high realistic input values (Table 2, on a one-by-one basis) led to a 2-5 order of magnitude of over- or under-prediction of measured in situ rates. Water, temperature and N mineralization during basal rate incubations were critical, which reinforces the need for the choice of favourable incubation conditions and their accurate
quantification. When an incubation to determine a
basal rate is performed at low water content or low temperature, the further the conditions are from optimum the greater the adjustment required to calculate the basal rate, and the highly non-linear
modifier functions used lead to greater error.
Despite potential sources of error, there was good agreement between observed and predicted NNM rates. However, in further model testing and application, caution is required, including the
preference of laboratory over field incubations, and in situ incubations used at all times of the year. The measured NNM rates were highly correlated with SNAP-predicted rates of NNM (R2 = 0.84), but not
with basal rates (R2 = 0.09). This result shows that the use of the water and temperature modifiers in
SNAP, in combination with estimates of daily soil
Predicted rate of NNM (kg ha-1 yr-1 of N)
Measured rate of NNM (kg ha
-1 yr -1 of N)
400
300
200
100
100 200 300
1:1
400 500
0 0
1
1 1 1
figure 4. measured versus predicted rates of n e t n i t r o g e n m i n e r a l i z a t i o n ( N N m ) [ŷ = 72.7 + 1.41 x, R2 = 0.84, model efficiency (EF) = 0.35, n = 11] showing the 95 % confidence interval of prediction in relation to the 1:1 line.
100 10 0 10 100
Change (%)
Increase
Low Value High Value Gravel (g 100-1 g)
Bulk density (kg dm-3) Clay (g kg-1)
Lower water limit (g kg-1)
Upper water limit (g kg-1) Initial moisture (g kg-1) Incubation mosture (g kg-1) incubation temperature (°C) Net N mineralization (mg g-1 d-1) Canopy LAI (m-2 m-2)
Canopy cover fraction Litter cover fraction
Weed cover fraction Litter mass (Mg ha-1)
Litter height (cm) Depth of water uptake (m)
Decrease
1,000 10,000 100,000
water and temperature in the field, was essential to
predict NNM rates, and that basal rates alone were
not an index of N availability.
The predicted seasonality of NNM was more or less pronounced than that measured in several cases. This result suggests that the functions used to calculate seasonal trends, i.e. the water and/or
temperature sub-models, might need to be modified
to suit São Paulo conditions, if reliable daily rate estimates are required or if non-optimum incubation conditions are to be used.
A potentially useful, yet unexplored application
of the SNAP model is its use in plant production models that rely on the prediction of NNM and
nitrification (Keating et al., 2003; Jones et al., 2003;
Battaglia et al., 2004; van Noordwijk et al.,2011). Such models already use daily climate data, which would additionally require aerobic incubation and a few other inputs. The alternatives used in several of these models rely heavily on pH, C:N ratio or on clay content, which were found to be only weakly correlated with measured NNM rates.
coNclUsioNs
Rates of NNM predicted by the SNAP model were highly correlated with measured rates across 11 sites that covered a wide range of NNM. Hence, the SNAP model proved useful for predicting NNM rates in tropical soils of Brazil.
The SNAP model provides a basis for improving N management of eucalypt plantations in Sao Paulo State, Brazil. Testing in a wider range of temperate and tropical conditions is encouraged.
AcKNoWledgemeNts
We thank our collaborators in the Brazilian eucalypt plantation industry who provided access to
sites, assistance with sampling, financial support, and advice: Raul Chaves (Duratex), José Luiz Gava
(Suzano Pulp and Paper), and Cláudio Roberto Silva (Fibria). We also thank Phil Polglase, Daniel Mendham and three anonymous reviewers for comments on earlier drafts of this manuscript.
refereNces
Adams MA, Polglase PJ, Attiwill PM, Weston CJ. In situ studies of nitrogen mineralization and uptake in forest soils; some comments on methodology. Soil Biol Biochem.1989;21:423-9.
Almeida AC, Siggins A, Batista TR, Beadle C, Fonseca S, Loos R. Mapping the effect of spatial and temporal variation in climate and soils on Eucalyptus plantation production with 3-PG, a
process-based growth model. For Ecol Manage. 2010;259:1730-40. Alvares CA, Gonçalves JLM, Vieira SR, Silva CR, Franciscatte W. Spatial variability of physical and chemical attributes of some forest soils in southeastern of Brazil. Sci Agric. 2011;68:697-705. Alvares CA, Stape JL, Sentelhas PC, Gonçalves JLM, Sparovek G. Köppen’s climate classification map for Brazil. Meteorol Zeitschrift. 2013;22:711-28.
Battaglia M, Sands P, White D, Mummery D. CABALA: A linked carbon, water and nitrogen model of forest growth for silvicultural decision support. For Ecol Manage. 2004;193:251-82.
Corbeels M, McMurtrie RE, Pepper DA, Mendham DS, Grove TS, O’Connell AM. Long-term changes in productivity of eucalypt plantations under different harvest residue and nitrogen management practices: A modelling analysis. For Ecol Manage. 2005;217:1-18.
Cromer RN, Cameron DM, Rance SJ, Ryan PA, Brown M. Response to nutrients in Eucalyptus grandis. 2. Nitrogen accumulation. For Ecol Manage. 1993;62:231-43.
Gomes SS. Predição da disponibilidade de nitrogênio e potencial de resposta à fertilização nitrogenada em plantações de Eucalipto [dissertação]. Piracicaba: Universidade de São Paulo; 2009. Gonçalves JLM, Stape JL, Laclau JP, Smethurst P, Gava JL. Silvicultural effects on the productivity and wood quality of eucalypt plantations. For Ecol Manage. 2004;193:45-61. Gonçalves JLM. Principais solos usados para plantações florestais. In: Gonçalves JLM, Stape JL,editores. Conservação e cultivo de solos para plantações florestais. Piracicaba: Instituto de Pesquisas e Estudos Florestais; 2002. p.1-46.
Gonçalves JLM, Alvares CA, Gonçalves TD, Moreira RM, Mendes JCT, Gava JL. Mapeamento de solos e da produtividade de plantações de Eucalyptusgrandis com uso de sistema de informação geográfica. Sci For. 2012;40:187-201.
Gonçalves JLM, Alvares CA, Higa AR, Silva LD, Alfenas AC, Stahl J, Ferraz SFB, Lima WP, Brancalion PHS, Hubner A, Bouillet JPD, Laclau JP, Nouvellon Y, Epron D. Integrating genetic and silvicultural strategies to minimize abiotic and biotic constraints in Brazilian eucalypt plantations. For Ecol Manage. 2013;301:6-27.
Gonçalves JLM, Silva LD, Behling M, Alvares CA. Management of industrial plantations. In: Borges JG, Diaz-Balteiro L, McDill ME, Rodriguez LCE, editors. The management of industrial forest plantations - theoretical foundations and applications: Series managing forest ecosystems. Dordrecht: Springer; 2014. p.91-119. Jones JW, Hoogenboom G, Porter CH, Boote KJ, Batchelor WD, Hunt LA, Wilkens PW, Singh, U, Gijsman AJ, Ritchie JT. The DSSAT cropping system model. Eur J Agron. 2003;18:235-65. Keating BA, Carberry PS, Hammer GL, Probert ME, Robertson MJ, Holzworth D, Huth NI, Hargreaves JNG, Meinke H, Hochman Z, McLean G, Verburg K, Snow V, Dimes JP; Silburn M, Wang E, Brown S, Bristow KL, Asseng S, Chapman S, McCown RL, Freebairn DM, Smith CJ. An overview of APSIM, a model designed for farming systems simulation. Eur J Agron. 2003;18:267-88.
Laclau JP, Ranger J, Gonçalves JLM, Maquère V, Krusche AV, M’bou AT, Nouvellon Y, Saint-Andréa L, Bouillet JP, Piccolo MC, Deleporte P. Biogeochemical cycles of nutrients in tropical Eucalyptus plantations: Main features shown by intensive monitoring in Congo and Brazil. For Ecol Manage. 2010;259:1771-85.
M a n z o n i S , P o r p o r a t o A . S o i l c a r b o n a n d n i t r o g e n mineralization: Theory and models across scales. Soil Biol Biochem. 2009;41:1355-79.
Mellilo JM, Butler S, Johnson J, Mohan J, Steudler P, Lux H, Burrows E, Bowles F, Smith R, Scott L, Vario C, Hill T, Burton A, Zhou Y-M, Tang J. Soil warming, carbon-nitrogen interactions and forest carbon budgets. Proc Nat Acad Sci.
2011;108:9508-12.
O’Connell AM, Grove TS, Mendham DS, Rance SJ. Impact of harvest residue management on soil nitrogen dynamics in
Eucalyptus globulus plantations in south western Australia. Soil Biol Biochem. 2004;36:39-48.
Paul KI, Polglase PJ, O’Connell AM, Carlyle JC, Smethurst PJ, Khanna PK. Soil nitrogen availability predictor (SNAP): A simple model for predicting mineralization of nitrogen in forest soils. Aust J Soil Res. 2002;40:1011-26.
Paul KI, Polglase PJ, O’Connell AM, Carlyle CJ, Smethurst PJ, Khanna PK. Defining the relation between soil water content and net nitrogen mineralization. Eur J Soil Sci. 2003a;54:39-47. Paul KI, Polglase PJ, O’Connell AM, Carlyle CJ, Smethurst PJ, Khanna PK, Worledge D. Soil water under forests (SWUF): A model of water flow and soil water content under a range of forest types. For Ecol Manage. 2003b;182:195-211.
Paul KI, Polglase PJ, Smethurst PJ, O’Connell AM, Carlyle CJ, Khanna PK. Soil temperature under forests: A simple model for predicting soil temperature under a range of forest types. Agric For Meteorol. 2004;121:167-82.
Pulito AP. Resposta à fertilização nitrogenada e estoque de nitrogênio biodisponível em solos usados para plantações de Eucalyptus [dissertação] Piracicaba: Universidade de São Paulo; 2009.
Raij B, Andrade JC, Cantarella H, Quaggio JA. Análise química para avaliação da fertilidade de solos tropicais. Campinas: Instituto Agronômico; 2001.
Raison RJ, Connell MJ, Khanna PK. Methodology for studying fluxes of soil mineral N in situ. Soil Biol Biochem.1987;19:521-30. Sansoulet J, Pattey E, Kröbel, R, Grant B, Smith W, Jégo G, Desjardins RL, Tremblay N, Tremblay G. Comparing the performance of the STICS, DNDC, and DayCent models for predicting N uptake and biomass of spring wheat in Eastern Canada. Field Crops Res. 2014;156:135-50.
Smethurst PJ, Nambiar EKS. An appraisal of the in situ soil-core technique for measuring nitrogen uptake by a young Pinus radiata plantation. Soil Biol Biochem. 1989;21:939-42.
Smethurst PJ, Nambiar EKS. Effects of slash and litter management on fluxes of nitrogen and tree growth in a young Pinus radiata plantation. Can J For Res. 1990;20:1498-507. Smethurst PJ, Nambiar EKS. Changes in soil carbon and nitrogen during the establishment of a second crop of Pinus radiata. For Ecol Manage. 1995;73:145-55.
Smethurst P, Holz H, Moroni M, Baillie C. Nitrogen management in Eucalyptus nitens plantations. For Ecol Manage. 2004;193:63-80. Smethurst PJ, Petrone KC, Langergraber G, Baillie CC, Worledge D, Nash D. Nitrate dynamics in a rural headwater catchment: Measurements and modelling. Hydrol Proces. 2014;28:1820-34. Soares P, Tome M, Skovsgaard JP, Vanclay JK. Evaluating a growth model for forest management using continuous forest inventory data. For Ecol Manage.1995;71:251-65.
Stape JL, Binkley D, Ryan MG, Fonseca S, Loos RA, Takahashi EN, Silva CR, Silva SR, Hakamada RE, Ferreira JMA, Lima AMN, Gava JL, Leite FP, Andrade HB, Alves JM, Silva GGC, Azevedo MR. The Brazil eucalyptus potential productivity project: Influence of water, nutrients and stand uniformity on wood production. For Ecol Manage.2010;259:1684-94.
Thorburn PJ, Biggs JS, Collins K, Probert ME. Using the APSIM model to estimate nitrous oxide emissions from diverse Australian sugarcane production systems. Agric Ecosyst Environ. 2010;136:343-50.