www.biogeosciences.net/10/7971/2013/ doi:10.5194/bg-10-7971-2013
© Author(s) 2013. CC Attribution 3.0 License.
Biogeosciences
Shifting environmental controls on CH
4
fluxes in a sub-boreal
peatland
T. G. Pypker1,2, P. A. Moore3, J. M. Waddington3, J. A. Hribljan1, and R. C. Chimner1
1School of Forest Resources and Environmental Science, Michigan Technological University, Houghton, MI, USA 2Department of Natural Resource Sciences, Thompson Rivers University, Kamloops, BC, Canada
3School of Geography and Earth Sciences, McMaster University, Hamilton, ON, Canada
Correspondence to:T. G. Pypker (tpypker@tru.ca)
Received: 30 May 2013 – Published in Biogeosciences Discuss.: 15 July 2013
Revised: 11 October 2013 – Accepted: 23 October 2013 – Published: 6 December 2013
Abstract. We monitored CO2 and CH4 fluxes using eddy covariance from 19 May to 27 September 2011 in a poor fen located in northern Michigan. The objectives of this pa-per are to: (1) quantify the flux of CH4 from a sub-boreal peatland, and (2) determine which abiotic and biotic fac-tors were the most correlated to the flux of CH4 over the measurement period. Net daily CH4 fluxes increased from 70 mg CH4m−2d−1to 220 mg CH4m−2d−1from mid May to mid July. After July, CH4losses steadily declined to ap-proximately 50 mg CH4m−2d−1 in late September. During the study period, the peatland lost 17.4 g CH4m−2. Both abi-otic and biabi-otic variables were correlated with CH4 fluxes. When the different variables were analyzed together, the pre-ferred model included mean daily soil temperature at 20 cm, daily net ecosystem exchange (NEE) and the interaction be-tween mean daily soil temperature at 20 cm and NEE (R2= 0.47, p value <0.001). The interaction was important be-cause the relationship between daily NEE and mean daily soil temperature with CH4flux changed when NEE was neg-ative (CO2 uptake from the atmosphere) or positive (CO2 losses to the atmosphere). On days when daily NEE was negative, 25 % of the CH4flux could be explained by cor-relations with NEE, however on days when daily NEE was positive, there was no correlation between daily NEE and the CH4 flux. In contrast, daily mean soil temperature at 20 cm was poorly correlated to changes in CH4 when NEE was negative (17 %), but the correlation increased to 34 % when NEE was positive. The interaction between daily NEE and mean daily soil temperature at 20 cm indicates shifting envi-ronmental controls on the CH4flux throughout the growing season.
1 Introduction
Peatlands are a critical component in the global carbon (C) cycle because they represent a long-term sink of atmospheric carbon dioxide (CO2)(Gorham, 1991; Roulet, 2000). Today, soil C stocks in peatlands are estimated to up to 1850 Pg (1 Pg=1015g), equal to 12–30 % of the global soil C pool (McGuire et al., 2009; Schuur et al., 2008; Tarnocai, 2009). Moreover, peatland ecosystems currently sequester an es-timated 76 Tg (1012g) C−1yr−1 (Vasander and Kettunen, 2006; Zoltai and Martikainen, 1996). Peatlands are also a significant source of methane (CH4)because of the anaer-obic conditions in the often saturated peat (Olefeldt et al., 2012; Roulet, 2000; Turetsky et al., 2002; Turetsky et al., 2008b; Zhuang et al., 2007). However, because many of the world’s peatlands are located in northern climates where tem-perature and precipitation are expected to experience rapid change (IPCC, 2007; Räisänen, 1997), the fate of the stored carbon in peatlands is now in question (e.g. Frolking et al., 2011; Schuur et al., 2013).
facilitating CH4production (e.g. Liblik et al., 1997; Moore et al., 1998; Silvola et al., 1996). Soil temperature is also im-portant as temperature influences the rate of CH4production by methanogens (e.g. Valentine et al., 1994). However, the change in CH4production as a function of abiotic drivers can be modified by peat quality, with greater carbon lability re-sulting in higher temperature responses (Harden et al., 2012; Moore and Knowles, 1989; Updengraff et al., 1995). Hence, past work on ecosystem CH4 production in peatlands have reported a strong correlation between net ecosystem produc-tivity (NEP) and CH4efflux (Lai, 2009). As plant produc-tion increases, it is theorized, that a greater quantity of labile carbon for CH4is made available via root exudates or plant litter (e.g. Joabsson and Christensen, 2001; Waddington et al., 1996; Whiting and Chanton, 1993). While all of these abiotic and biotic drivers are important, throughout the year, one driver may exert a greater influence on CH4production. For example, in northern latitudes, CH4production in peat-lands is strongly influenced by soil temperature (Christensen et al., 2004; Turetsky et al., 2008b), whereas at the more southern limits, biological processes that produce CH4may be less sensitive to changes in temperature (Johnson et al., 2013; White et al., 2008). In addition to temperature, water table position and NEP, CH4emission have also been found to respond to nutrient levels, pH, abundance of other terminal electron acceptors, vegetation community structure and oxi-dation potential (Bubier, 1995; Liblik et al., 1997; Moore and Knowles, 1989; Segers, 1998; Silvola et al., 1996; Valentine et al., 1994) Updengraff et al., 2001).
In peatlands, the response of CH4fluxes to abiotic and bi-otic drivers have primarily been studied using chamber tech-niques (Lai, 2009). This technique can provide comparisons between sites, but it typically does not continuously capture the flux of CH4over the course of a whole day unless auto-mated chambers are used. Typically researchers monitor the flux of CH4 during a specified period of time (e.g. 1000 h to 1600 h) and then maybe quantify the diurnal fluxes over a few select days. Chambers also provide limited spatial rep-resentation of the site as the measurements are often limited to fewer than 20 locations within the peatland (Lai, 2009). The eddy covariance technique provides an ideal method for quantifying the flux of CH4continuously and it integrates the flux of CH4from the site.
We deployed an eddy covariance tower in a Sphagnum
dominated peatland located in Northern Michigan, USA to understand the importance of different abiotic and biotic fac-tors in controlling CH4efflux from peatlands. The peatland is located at the southern limit of the sub-boreal peatlands. This region is expected to experience 3–5◦C change in tempera-ture by 2100 (IPCC, 2007). Unlike high latitude peatlands, there have been fewer studies reporting the factors control-ling CH4fluxes from peatlands at their southern limit. The objectives of this project were to: (1) quantify the flux of CH4 from a sub-boreal peatland, and (2) determine which abiotic and biotic factors were the most important in controlling the
flux of CH4over the growing season. Because the substrate quality is low in poor fens, we hypothesize that the NEP has a greater control on CH4efflux relative to peat temperature during the growing season when NEP is positive.
2 Methods
2.1 Study site
The study site is located within the boundaries of Seney National Wildlife Refuge (NWR) (46◦19′N and 86◦03′W). Seney NWR is relatively flat with a southeast slope of 1.9 m km−1, and is part of the 3797 km2Manistique Water-shed (USFWS, 2009). Seney NWR is covered by open peat-lands, lowland swamps, and upland forests (USFWS, 2009). Underlying deposits include sand over Ordovician sandstone, limestone, and dolomite. Dominant vegetation at the study site consists of a ground cover ofSphagnumsp. (S. angus-tifolium, S. capillifolium, S. magelanicum), with an over-story of vascular species. The dominant vascular vegetation consists ofCarex oligosperma,Eriophorum vaginatum, and
Ericaceae (e.g. Chamaedaphne calyculata, Ledum groen-landicum,Kalmia polifolia, andVaccinium oxycoccus). Up-land areas are generally mixed hardwood forests with vary-ing tree species, includvary-ing American beech (Fagus grandi-foliaEhrh.), sugar maple (Acer saccharumMarsh.), yellow birch (Betula alleghaniensisBritton), red pine, eastern white pine, jack pine (Pinus banksianaLamb.), black spruce (Picea mariana(Mill.) B.S.P.) and balsam fir (Abies balsamea(L.) Mill.) (USFWS, 2009). Besides hydrology, fire, and human disturbance interacting with surficial geology influence the plant communities at Seney NWR (Bork et al., 2013; Droby-shev et al., 2008a; DrobyDroby-shev et al., 2008b). In the 1930s and 1940s, the refuge constructed a number berms and road net-works for the establishment of ponds for wildlife. The study site is located in the southern portion of Seney NWR and has greater than 200 m of continuous fetch in the dominant wind sector, with only 100 m from the lateral wind sectors. The site is classified as a poor fen and has a pH of 3.77±0.02 and has an average microtopographical variation of 0.30±0.08 m. The study site is representative of other sub boreal peatlands in the region (Hribljan, 2012; Janssen, 1967; Vitt, 2006). The climate is strongly influenced by Lake Superior and Lake Michigan, with an annual precipitation of 810 mm. Tempera-tures in the area range from−37◦C to 36◦C, with an average temperature of 5◦C (USFWS, 2009; Wilcox et al., 2006). 2.2 Instrumentation
Water vapour and CO2concentrations were measured using an LI-7500A open-path infrared gas analyzer (IRGA) (LI-COR Biosciences, Lincoln, Nebraska). Methane concentra-tions were measured using a LI-7700 open-path IRGA (LI-COR Biosciences). All EC sensors were mounted between 1.7 and 2.1 m above the average hummock surface, had a vertical and lateral separation less than 0.15 and 0.39 m re-spectively, and were oriented upwind of the tower based on the dominant summertime wind direction. EC data was sam-pled at 10 Hz, with mean values and fluxes calculated every 30 min. All high frequency data was recorded on a CR3000 datalogger (CS). All flux measurements are reported with positive values representing fluxes to the atmosphere and negative fluxes representing losses from the atmosphere.
Meteorological measurements were monitored using an array of standard equipment and the data was stored at 30 min intervals on a CR3000 datalogger (CS). Radiation measure-ments were made using a net short and long wave radiome-ter (CNR2, CS) Supplementary air temperature and humid-ity were measured and using an HMP45C (Vaisala Oyj, Helsinki, Finland) temperature and relative humidity probe mounted in a radiation shield at a height of 1.35 m. Peat tem-peratures profiles were measured in a representative hum-mock and hollow at each site using T-type thermocouple (Omega Engineering, CT, USA) wire inserted at depths of 0.01, 0.05, 0.1, 0.2, and 0.5 m relative to the local surface.
Measured hydrometric data included rainfall, soil volu-metric water content (VWC), and water table (WT) posi-tion. WT positions are reported in relation to the mean mi-crotopography of each site. Microtopography was mea-sured with a transit level at 0.5 m increments along a 50 m transect centered at the monitoring well of each site. Rain-fall was measured using a TE525 tipping bucket rain gauge (Texas Electronics, Dallas, TX, USA) mounted 0.7 m above the surface. WT levels were measured hourly in 1.5 m deep wells using self-logging Levellogger Junior pressure trans-ducers (Solinst, Georgetown, ON (Solinst)). WT measure-ments were corrected for changes in atmospheric pressure using a Barologger Gold barometric logger (Solinst). 2.3 High-frequency data processing and corrections
Prior to calculating half-hour covariances, high-frequency EC measurements were subjected to a spike detection al-gorithm analogous to that presented in Vickers and Mahrt (1997), where spikes were identified when a measurement exceeded the recursive mean by a standard deviation of 2.6 (also derived recursively). The mean was constructed as a re-cursive digital filter (Kaimal and Finnigan, 1994):
˜ ct =
1−1t
τf
˜ ct−1+
1t τf
ct
where ct is the measured value at timet,1tis the
incremen-tal time step between measurements (0.1 s), andτf is the RC
filter time constant (60 s). The cut-off for spike detection is
lower than the typical 3–5 SD range reported by others (e.g. Baldocchi et al., 1997; Humphreys et al., 2006; Vickers and Mahrt, 1997) because, given the above time constant, the re-cursive mean is more responsive to coherent transient depar-tures from the long-term mean compared to block averaging. Sonic anemometer wind vectors were mathematically ro-tated based on the tilt correction algorithms presented by Wilczak et al. (2001), also known as the planar fit method. The planar fit method helps to address the problem of over-rotation in sloping terrain associated with the more com-monly used method of Tanner and Thurtell (1969) as outlined by Foken et al. (2004).
Before calculating energy and mass fluxes, a time lag was introduced into the appropriate mass or energy time series in order to maximize the average covariance with the ro-tated vertical wind speed. Due to the large amount of noise in the CH4signal, the lag was restricted to 5 s, where Detto et al. (2011) show a relatively constant time lag of 0.9 s for a LI-7700. In the absence of a definitive peak cross-correlation within±5 s, the previous time lag was used. In addition to flux loss that results from the asynchrony in the measured time series due to finite instrument processing times, spectral transfer functions were used to correct for high-frequency spectral losses that result from sensor separation, line and volume averaging, and digital filtering. Frequency response corrections were calculated according to the analytical solu-tions presented in Massman (2000) and applied to despiked, rotated, and lagged covariances.
Errors in EC flux measurements associated with varia-tions in air density due to changing temperature and humid-ity were corrected based on the method outlined by Webb et al. (1980), and took the following general form:
Fx=Fx0+µ E ρd
ρx
1+µσ +κ H ρaCp
ρx
Ta
whereFx andFx0are the corrected and uncorrected flux of x (CO2 and CH4),µ is the ratio of the molar mass of air and water,EandH are the mean WPL-corrected latent and sensible heat fluxes,ρ is density where the subscriptsa,d, andvrepresent mean values for ambient air, dry air, and wa-ter vapour respectively,σ=ρv/ρa,Tais air temperature, and
κ is 1 for CO2 and equal to the WPL-H multiplier in the LI-7700 manual which corrects for temperature and pres-sure spectroscopic effects. The sensible heat flux used in the WPL correction is itself dependent on air density fluctuations when measured using a sonic-anemometer. Sonic tempera-tures were thus corrected using the method of Kaimal and Finnigan (1994).
2.4 Quality assurance and gap filling
for skewness and kurtosis were based both on those pre-sented by Vickers and Mahrt (1997) and measured empiri-cal probability distributions. A site dependent friction veloc-ity (u∗) threshold of∼0.08 m s−1was used as a basic rejec-tion criterion for removing measurements made under condi-tions without well developed turbulence. Although data was not explicitly rejected during periods of rainfall, data dur-ing this period was often rejected as a result of the afore-mentioned statistical criteria. Finally, half-hourly CO2fluxes were rejected if nighttime (PPFD≤10 µmol m−2s−1) mea-surements indicated uptake. Negative half-hourly CH4fluxes were similarly rejected. The reason we only removed nega-tive half-hour CH4fluxes was to allow for ebullition events to remain in the data. If a standard despiking protocol were used, the same negative CH4effluxes would have been re-moved, but we would have also removed any ebullition events. Because did not wish to remove rapid changes in the positive direction because of possible ebullition events, and because all the negative nighttime CH4fluxes were statistical outliers, we removed all negative nighttime CH4fluxes.
A comprehensive data quality flagging system was also used to identify half-hours with high-quality, questionable, and bad data (Foken et al., 2004). Data quality was assessed based on integral turbulence characteristics, stationary (Fo-ken and Wichura, 1996), and wind direction, where wind-sectors down-wind of the tower were considered inappropri-ate.
In order to calculate growing season net CO2fluxes, miss-ing data was filled usmiss-ing an artificial neural network (ANN). ANNs have been shown to be suitable for gap-filling EC CO2 flux data (Moffat et al., 2007) where standard meteorological and soil variables were used as driving variables. Day and night time gaps were modelled separately, where the dispar-ity in available data for these two time periods would result in a bias towards daytime conditions during ANN calibration and validation. Due to poorer correlation with measured en-vironmental variables, a simple look-up table based on peat temperature and moisture was used to fill missing CH4flux data. In total, 57 % of the CH4data and 54 % of the CO2data were filled using the aforementioned gap filling techniques. 2.5 Statistics
Statistics were completed in JMP 1.0 (SAS Institute Inc., Cary, NC, USA). To compare the correlation between indi-vidual abiotic and biotic variables CH4production, we used linear and nonlinear regressions. When creating a model to identify the combined explanatory power of the different variables and their interactions, we used multiple linear re-gressions. The best model was selected using both the Akaike Information Criterion (AIC) and the Bayesian Information Criterion (BIC).
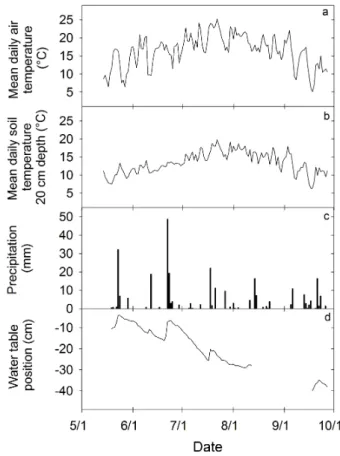
Fig. 1.Mean daily air temperature(a), mean daily soil temperature
(b), precipitation(c), and water table position relative to the surface
(d)in a poor fen from 19 May to 27 September 2011.
3 Results
3.1 Meteorological variables
From 19 May to 27 September 2012, mean daily air temper-ature rose from approximately 10◦C in mid May, to max-imum of approximately 25◦C in late July (Fig. 1a). Mean daily soil temperature at 20 cm rose from below 10◦C in May to above 17◦C in early August (Fig. 1b). During the mea-surement period, precipitation totaled 290 mm (Fig. 1c). June received the most precipitation (97 mm), but each month re-ceived at least 47 mm of rainfall. WT position steadily de-clined throughout the measurement period, falling from 5 cm below the surface in late May, to approximately 40 cm be-low the surface in mid September (Fig. 1d). WT position re-sponded to precipitation events, particularly those in excess of 20 mm.
3.2 Seasonal and diurnal CO2and CH4fluxes
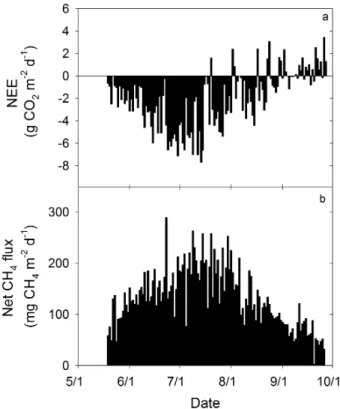
Fig. 2.Daily net ecosystem CO2exchange (NEE)(a)and net daily
CH4(b)fluxes from a poor fen from 19 May to 27 September, 2011.
The peatland is located in the Upper Peninsula of Michigan, USA. Positive values represent fluxes to the atmosphere and negative val-ues represent losses from the atmosphere.
of –3.8 g CO2m−2d−1 (n=9, SE = 1.0 g CO2m−2d−1) in late July (Fig. 2a). Daily NEE steadily declined after late July. After the beginning of September, daily NEE ranged from approximately –4.4 to 3.4 g CO2m−2d−1. CH4 losses to the atmosphere increased from a daily mean of 63 mg CH4m−2d−1 (n=8, SE = 8.7 mg CH4m−2d−1) to a daily mean of 192 mg CH4m−2d−1 (n=9, SE = 13 mg CH4m−2d−1) from mid May to mid July. After July, CH4 losses steadily declined to daily mean of 48 mg CH4m−2d−1 (n=9; SE = 7.6 mg CH4m−2d−1) in late September. The mean net daily CH4 efflux was 152 (SE = 6.7), 192 (SE = 8.0), 130 (SE = 6.9) and 66 (SE = 4.5) mg CH4m−2d−1 for June, July, August and September, respectively. The peatland lost 17.4 g CH4m−2 during the study period. Diurnally, NEE followed a typical sinusoidal trend, with mean diurnal NEE during the study period ranging from the atmosphere gaining 2.0 µmol CO2m−2s−1 at night to the atmosphere losing –3.8 µmol CO2m−2s−1 during midday (Fig. 3a). In contrast, there was little diurnal variation in magnitude of the net diurnal CH4flux over the study period. Mean diurnal net CH4effluxes ranged between 90 and 112 nmol CH4m−2s−1(Fig. 3b). However, there was more variability in the net CH4flux at night.
Fig. 3.Mean diurnal net ecosystem CO2exchange (NEE)(a)and
net CH4(b)fluxes for poor fen from 19 May to 27 September 2011.
Error bars represent the standard error. Positive values represent fluxes to the atmosphere and negative values represent losses from the atmosphere.
3.3 Environmental and biological controls of CH4fluxes
Fig. 4. Relationship between mean daily air temperature, mean daily soil temperature, water table position and the net daily
CH4flux. There were significant exponential relationships between
mean daily soil temperature (50.3 exp0.070x,R2=0.23,p value
<0.0001) and mean daily air temperature (53.9 exp0.05x, R2=
0.25,pvalue<0.0001). Positive CH4flux values represent fluxes
to the atmosphere and negative values represent losses from the at-mosphere.
a decline in net daily CH4fluxes, but the explanatory power was weak (R2=0.06;pvalue<0.01) (Fig. 5). Daily solar radiation was weakly correlated to CH4flux (data not shown; R2=0.14;pvalue<0.0001). Lastly, as daily NEE became more negative, net daily CH4 fluxes to the atmosphere in-creased (Fig. 6). From 19 May to 27 September 2012, daily NEE explained 28 % of the net daily CH4fluxes measured the same day (R2=0.28,p value <0.0001). While mean daily air temperature, mean daily soil temperature at 20 cm depth, WT position and daily NEE were all individually as-sociated with net daily CH4fluxes, the individual R2values were very low, thereby suggesting that multiple regression would better explain the net daily CH4flux.
Fig. 5.The relationship between water table position and net CH4
flux after accounting for mean daily air temperature. The net CH4
flux at 15◦C was estimated using the exponential equation relating
mean daily air temperature to the CH4flux (Fig. 4). The difference
between the measured and predicted net CH4flux was then used in
the graph above to determine if water table position had an impact
on the net CH4flux after mean daily temperature effects were
ac-counted for. The linear regression is significant, but the data explain
very little of the variance (R2=0.06). Positive CH4flux values
rep-resent fluxes to the atmosphere and negative values reprep-resent losses from the atmosphere.
Fig. 6.Relationship between daily net ecosystem CO2 exchange
(NEE) and net daily CH4fluxes measured on the same day. Fluxes
were measured from 19 May to 27 September 2012. The linear
re-lationship has anR2of 0.28 and apvalue<0.0001. Positive
val-ues represent fluxes to the atmosphere and negative valval-ues represent losses from the atmosphere.
Fig. 7.The relationship between daily net ecosystem CO2exchange (NEE)(a, b)and mean daily air temperature(c, d)and net daily
CH4fluxes for periods when daily NEE was negative(a, c)and positive(b, d). Positive NEE and CH4flux values represent fluxes to the
atmosphere and negative values represent losses from the atmosphere.
and mean daily soil temperature at 20 cm had anR2of 0.47 (pvalue<0.001). Given the nearly identicalR2, the more direct biological connection between soil temperature and CH4flux, and the strong correlation between mean daily soil temperature and mean daily air temperature (R2=0.65), we chose to proceed with a model that included mean daily soil temperature and daily NEE. Because of the significant inter-action between daily NEE and mean daily soil temperature, we analyzed the relationship between the net daily CH4 ef-flux to both daily NEE and daily mean soil temperature on days when daily NEE was negative (net CO2uptake by the surface) and positive (net CO2loss from the surface) (Fig. 7). For the following analysis using linear regression all relation-ships were created using non-transformed data. The residuals for all the regressions had equal variance and were normally distributed. Net daily CH4fluxes were strongly correlated to daily NEE when daily NEE was negative because the slope of the line was statistically different from zero (R2=0.25,p value<0.001) (Fig. 7a). However, when daily NEE was pos-itive, there is no correlation between daily NEE and net daily CH4fluxes because the slope of the line was not statistically different from zero (R2=0.00, p value >0.75) (Fig. 7b).
Hence, NEE is not correlated to net daily CH4 fluxes on days when NEE is positive. In contrast, a relationship be-tween mean daily soil temperature and net daily CH4fluxes only explain 17 % of the variance in net daily CH4flux when daily NEE was negative (p value <0.001) (Fig. 7c), but when daily NEE was positive, mean daily soil temperature explained 34 % of the variance in the net daily CH4fluxes (p value<0.001) (Fig. 7d). The slope of the lines relating mean daily soil temperature and net daily CH4efflux were not sta-tistically different (pvalue>0.05), thereby suggesting that relationship between net daily CH4did and mean daily soil temperature did not differ when NEE was positive or neg-ative. However, the higherR2does suggest that mean daily soil temperature can explain more of the variance in net daily CH4efflux on days when NEE is positive.
4 Discussion
4.1 Growing season CH4fluxes
(e.g. Moore and Knowles, 1990; Roulet et al., 1992; Shan-non and White, 1994) to greater than 200 mg CH4m−2d−1 (e.g. Moore et al., 1994). Throughout the growing season, the CH4 effluxes in this study are on the middle to up-per end of the reported fluxes for bogs and poor fens, with fluxes ranging from 100 mg CH4m−2d−1 to greater than 225 mg CH4m−2d−1. From 19 May to 27 September, fluxes totaled 17.4 g CH4m−2, suggesting that these sites are a sig-nificant source of CH4during the spring and summer months (Roulet et al., 1992; Moore et al, 1994). During the win-ter months, the WT position typically rises and the deep snow pack prevents freezing. The combination of a high WT position and above freezing temperatures could pro-mote CH4 fluxes from the peatland throughout the winter. For example, past work in a restored wetland in Denmark (Herbst et al., 2011) and sub-arctic peatland in Greenland (Jackowicz-Korczynski et al., 2010) demonstrate that when the soils do not freeze, CH4 efflux can still be maintained between 1 and 10 mg CH4m−2d−1. Because the soils in this site do not freeze (data not shown), we could assume that our site maintained a flux similar to other unfrozen peat-land sites. If we assume the CH4efflux was between 1 and 10 mg CH4m−2d−1for the periods outside of our measure-ment dates, the site would have produced between between 17.6 and 18.9 g CH4m−2during 2011.
4.2 Varying controls on CH4fluxes
Past work demonstrates that air temperature and soil temper-ature are strongly correlated to CH4efflux (e.g. Godin et al., 2012; Lai, 2009; Segers, 1998). In our study, both mean daily air and soil temperatures at 20 cm depth were correlated CH4 flux (Fig. 4a, b). Past work has foundQ10values to range be-tween 1.5 to 16 (Lai, 2009). OurQ10values ranged between 1.7 and 2.0 for mean daily soil and air temperatures, respec-tively, which is on the lower end of previous measurements. WT position remained favourable for CH4emission for much of the measurement period, ranging between 10 and 40 cm below the surface, thereby allowing temperature to influence CH4 production. The sensitivity of the CH4 efflux to tem-perature may have been partially mitigated by the low pH or low quality substrate. Past work has demonstrated that most methanogenic bacteria have an optimum CH4production at a pH between 6 and 8, with production declining at a pH more typical of a poor fen or bog (Garcia et al., 2000; Williams and Crawford, 1984). Furthermore, decreases in substrate quality tended to reduce theQ10value (Dunfield et al., 1993; Valen-tine et al., 1994). Lastly, the range of temperatures used to quantify theQ10value only ranged between 5.1 and 25.0◦C. As WT position increased from 10 to 30 cm below the surface, CH4 efflux increased. Initially this may appear to contradict literature demonstrating that shallower water ta-bles result in greater CH4 efflux (Bubier et al., 1993; Har-greaves and Fowler, 1998; Pelletier et al., 2007; Roulet et al., 1992). However, after adjusting for the effect of
tempera-ture, WT position was weakly, but significantly correlated to daily CH4flux. Past work has also demonstrated that lower-ing WT positions can be associated with greater CH4efflux (e.g. Bellisario et al., 1999; Treat et al., 2007). The associa-tion between lower WT posiassocia-tion and higher CH4efflux could result from higher substrate temperatures, as in this study, or because the lower WT position reduces pressure, thereby al-lowing gas bubbles to be released (Kellner et al., 2004; Strack et al., 2005).
4.3 Substrate quality
5 Conclusions
This peatland is located at the southern-limit of sub-boreal peatlands and the CH4losses during the growing season are high, relative to other peatlands. Daily CH4efflux was cor-related to both mean daily soil temperature at 20 cm, daily NEE and the interaction between mean daily soil temperature and daily NEE. The correlation between net daily CH4efflux with daily NEE and mean daily soil temperature changed when NEE was negative or positive. When daily NEE was negative, daily NEE was significantly correlated with net daily CH4 fluxes. However, when NEE was positive, daily NEE was not significantly correlated with net daily CH4 ef-flux. In contrast, mean daily soil temperature was signifi-cantly correlated with net daily CH4fluxes when daily NEE was positive or negative. However, when daily NEE was positive, mean daily soil temperature explained considerably more of the variance in net daily CH4efflux. The interaction between NEE and mean daily soil temperature has implica-tions for the loss of CH4from this peatland under future cli-mate conditions. As NEE varies because of a warmer clicli-mate, the changes in NEE may counteract or reinforce some of the effects increased soil temperature will have on CH4 fluxes. Furthermore, changes in the temperature and hydrology of this system may alter the vegetation, which will subsequently affect NEE, and the pathway for CH4to the atmosphere.
Acknowledgements. The authors gratefully acknowledge Robin Conklin, Elizabeth Boisvert, Chris Johnson, Jamie Bourgo, Laura Kangas, and Laura Matkala for their help with site construction, as well as field work. We would like to thank the reviewers and the editor for their very helpful comments. This research was supported by the U.S. Department of Energy’s Office of Science (BER) through the Midwestern Regional Center of the National Institute for Climatic Change Research at Michigan Technological University and by a Natural Science and Engineering Council (NSERC) of Canada Discovery Grant and Discovery Accelerator Supplement to JM Waddington. Additional support was provided by the Ecosystem Science Center at Michigan Technological University. The project would not have been possible without the cooperation of the U.S. Fish and Wildlife Service in allowing us to access this site. In particular, we wish to thank the staff of Seney National Wildlife Refuge. The findings and conclusions in this article are those of the authors and do not necessarily represent the views of the U.S. Fish and Wildlife Service.
Edited by: P. Stoy
References
Alm, J., Talanov, A., Saarnio, S., Silvola, J., Ikkonen, E., Aaltonen, H., Nykanen, H., and Martikainen, P. J.: Reconstruction of the carbon balance for microsites in a boreal oligotrophic pine fen, Finland, Oecologia, 110, 423–431, 1997.
Baldocchi, D., Valentini, R., Running, S., Oechel, W., and Dahlman, R.: Strategies for measuring and modelling carbon dioxide and water vapour fluxes over terrestrial ecosystems, Global Change Biol., 2, 159–168, 1996.
Baldocchi, D. D., Vogel, C. A., and Hall, B.: Seasonal variation of carbon dioxide exchange rates above and below a boreal jack-pine forest, Agric. For. Meteorol., 83, 147–170, 1997.
Basiliko, N. and Yavitt, J. B.: Influence of Ni, Co, Fe, and Na addi-tions on methane production in Sphagnum-dominated Northern American peatlands, Biogeochemistry, 52, 133–153, 2001. Bellisario, L. M., Bubier, J. L., Moore, T. R., and Chanton, J. P.:
Controls on CH4 emissions from a northern peatland, Global
Biogeochem. Cycles, 13, 81–91, 1999.
Bork, S. P., Pypker, T. G., Corace III, R. G., Chimner, R. A., MacLean, A.L., and Hribljan, J. A.: A case study in large-scale wetland restoration at Seney National Wildlife Refgue, Upper Michigan, U.S.A. American Midland Naturalist, 169, 286–302, 2013.
Bubier, J. L.: The relationship of vegetation of methane emission and hydrochemical gradients in northern peatlands, J. Ecol., 83, 403–420, 1995.
Bubier, J. L., Moore, T. R., and Roulet, N. T.: Methane emis-sions from wetlands in the midboreal region of Northern Ontario, Canada, Ecology, 74, 2240–2254, 1993.
Christensen, T. R., Johansson, T. R., Akerman, H. J., Mas-tepanov, M., Malmer, N., Friborg, T., Crill, P., and Svens-son, B. H.: Thawing sub-arctic permafrost: Effects on vegeta-tion and methane emissions, Geophys. Res. Lett., 31, L04501, doi:10.1029/2003GL018680, 2004.
Coles, J. R. P. and Yavitt, J. B.: L Control of methane metabolism in a forested northern wetland, New York State, by aeration, sub-strates, and peat size fractions, Geomicrobiology J., 19, 293–315, 2002.
Detto, M., Verfaillie, J., Anderson, F., Xu, L. K., and Baldocchi, D.: Comparing laser-based open- and closed-path gas analyzers to measure methane fluxes using the eddy covariance method, Agric. For. Meteorol., 151, 1312–1324, 2011.
Drobyshev, I., Goebel, P. C., Hix, D. M., Corace III, G., and Semko-Duncan, M. E.: Interactions among forest composition, structure, fuel loadings and fire history: A case study of red pine-dominated forests of Seney National Wildlife Refuge, Upper Michigan, For. Ecol. Manage., 256, 1723–1733, 2008a.
Drobyshev, I., Goebel, P. C., Hix, D. M., Corace III, G., and Semko-Duncan, M. E.: Pre- and post-European settlement fire history of red pine dominated forest ecosystems of Seney National Wildlife Refuge, Upper Michigan, Can. J. For. Res., 38, 2497–2514, 2008b.
Dunfield, P., Knowles, R., Dumont, R., and Moore, T. R.: Methane production and consumption in temperate and sub-arctic peat soils – response to temperature and pH, Soil Biol. Biochem., 25, 321–326, 1993.
Foken, T., Gockede, M., Mauder, M., Mahrt, L., Amiro, B. D., and Munger, J. W.: Post-field data quality control, edited by: Lee, X., Massman, W. J., and Law, B.: Handbook of Micrometeorology: A guide for surface flux measurement and analysis, Kluwer, Dor-drecht, 181–208, 2004.
Frolking, S., Talbot, J., Jones, M. C., Treat, C. C., Kauffman, J. B., Tuittila, E. S., and Roulet, N.: Peatlands in the Earth’s 21st century climate system. Environ. Rev., 19, 371–396, 2011. Garcia, J. L., Patel, B. K. C., and Ollivier, B.: Taxonomic
phyloge-netic and ecological diversity of methanogenic Archaea, Anaer-obe, 6, 205–226, 2000.
Godin, A., McLaughlin, J. W., Webster, K. L., Packalen, M., and Basiliko, N.: Methane and methanogen community dynamics across a boreal peatland nutrient gradient, Soil Biol. Biochem., 48, 96–105, 2012.
Gorham, E.: Northern peatlands: role in the carbon cycle and prob-able responses to climatic warming, Ecol. Appl., 1, 182–195, 1991.
Hajek, T., Ballance, S., Limpens, J., Zijlstra, M., and Verhoeven, J. T. A.: Cell-wall polysaccharides play an important role in decay resistance of Sphagnum and actively depressed decomposition in vitro, Biogeochem., 103, 45–57, 2011.
Harden, J. W., Koven, C. D., Ping, C. L., Jorgenson, T., Kuhry, P., Michaelson, G. J., O’Donnell, J. A., Schuur, E. A. G., Tarnocai, C., Johnson, K., and Grosse, G.: Field information links per-mafrost carbon to physical vulnerabilities of thawing, Geophys. Res. Lett. 39, L15704, doi:10.1029/2012GL051958, 2012. Hargreaves, K. J. and Fowler, D.: Quantifying the effects of
wa-ter table and soil temperature on the emission of methane from peat wetlands at the field scale, Atmos. Environ., 32, 3275–3282, 1998.
Herbst, M., Friborg, T., Ringgaard, R., and Soegaard, H.: Interpret-ing the variations in atmospheric methane fluxes observed above a restored wetland, Agric. For. Meteorol., 151, 841–853, 2011. Hribjlan, J. A.: The effect of long-term water table manipulations
on vegetation, pore water, substrate quality, and carbon cycling in a northern poor fen peatland, PhD. Thesis, Michigan Techno-logical University, 162 pp, 2012.
Humphreys, E. R., Lafleur, P. M., Flanagan, L. B., Hedstrom, N. R., Syed, K. H., Glenn, A.,J., and Granger, R.: Summer carbon diox-ide and water vapor fluxes across a range of northern peatlands, J. Geophys. Res., 111, G04011, doi:10.1029/2005JG000111, 2006. IPCC: Climate change 2007: The physical science basis,
Cam-bridge, 2007.
Jackowicz-Korczynski, M., Christensen, T. R., Backstrand, K., Crill, P., Friborg, T., Mastepanov, M., and Strom, L.: Annual cy-cle of methane emission from a subarctic peatland, J. Geophys. Res.-Biogeo., 115, G02009, doi:10.1029/2008JG000913, 2010. Joabsson, A. and Christensen, T. R.: Methane emissions from
wet-lands and their relationship with vascular plants: an Arctic exam-ple, Glob. Change Biol., 7, 919–932, 2001.
Joabsson, A., Christensen, T. R., and Wallen, B.: Vascular plant con-trols on methane emissions from northern peatforming wetlands, Trends Ecol. Evol., 14, 385–388, 1999.
Johnson, C. P., Pypker, T. G., Hribljan, J. A., and Chimner, R. A.: Open top chambers and infrared lamps: A comparison of heating
efficacy and CO2/CH4 dynamics in a northern Michigan
peat-land, Ecosystems, doi:10.1007/s10021-013-9646-3, 2013. Kaimal, J. and Finnigan, J.: Atmospheric boundary layer flows:
Their structure and measurement, Oxford University Press, New York, 1994.
Kellner, E., Price, J. S., and Waddington, J. M.: Pressure variations in peat as a result of gas bubble dynamics, Hydrol. Proc., 18, 2599–2605, 2004.
Lai, D. Y. F.: Methane Dynamics in Northern Peatlands: A Review, Pedosphere, 19, 409–421, 2009.
Liblik, L. K., Moore, T. R., Bubier, J. L., and Robinson, S. D.: Methane emissions from wetlands in the zone of discontinuous permafrost: Fort Simpson, Northwest Territories, Canada, Global Biogeochem. Cy., 11, 485–494, 1997.
Long, K. D., Flanagan, L. B., and Cai, T.: Diurnal and seasonal variation in methane emissions in a northern Canadian peatland measured by eddy covariance, Global Change Biol., 16, 2420– 2435, 2010.
Massman, W. J.: A simple method for estimating frequency re-sponse corrections for eddy covariance systems, Agric. For. Me-teorol., 104, 185–198, 2000.
McGuire, A. D., Anderson, L. G., Christensen, T. R., Dallimore, S., Guo, L., Hayes, D. J., Heimann, M., Lorenson, T. D., MacDon-ald, R. W., and Roulet, N.: Sensitivity of the carbon cycle in the Arctic to climate change, Ecol. Mono., 79, 523–555, 2009. Moffat, A. M., Papale, D., Reichstein, M., Hollinger, D. Y.,
Richard-son, A. D., Barr, A. G., Beckstein, C., Braswell, B. H., Churkina, G., Desai, A. R., Falge, E., Gove, J. H., Heimann, M., Hui, D., Jarvis, A. J., Kattge, J., Noormets, A., and Stauch, V. J.: Compre-hensive comparison of gap-filling techniques for eddy covariance net carbon fluxes, Agric. For. Meteorol., 147, 209–232, 2007. Moore, T. R., Heyes, A., and Roulet, N. T.: Methane emissions
from wetlands, southern Hudson-Bay lowland, J. Geophys. Res.-Atmos., 99, 1455–1467, 1994.
Moore, T. R. and Knowles, R.: The influence of water-table levels on methane and carbon-dioxide emissions from peatland soils, Can. J. Soil Sci., 69, 33–38, 1989.
Moore, T. R. and Knowles, R.: Methane emissions from fen, bog and swamp peatlands in Quebec, Biogeochem., 11, 45–61, 1990. Moore, T. R., Roulet, N. T., and Waddington, J. M.: Uncertainty in predicting the effect of climatic change on the carbon cycling of Canadian peatlands, Clim. Change, 40, 229–245, 1998. Olefeldt, D., Roulet, N. T., Bergeron, O., Crill, P.,
Bäck-strand, K., and Christensen, T. R.: Net carbon accumu-lation of a high-latitude permafrost palsa mire similar to permafrost-free peatlands, Geophys. Res. Lett., 39, L03501, doi:10.1029/2011GL050355, 2012.
Pelletier, L., Moore, T. R., Roulet, N. T., Garneau, M., and Beaulieu-Audy, V.: Methane fluxes from three peat-lands in the La Grande Riviere watershed, James Bay low-land, Canada. J. Geophys. Res.-Biogeosci., 112, G01018, doi:10.1029/2006JG000216, 2007.
Räisänen, J.: Objective comparison of patterns of CO2induced
cli-mate change in coupled GCM experiments, Clim. Dyn., 13, 197– 211, 1997.
Rinne, J., Riutta, T., Pihlatie, M., Aurela, M., Haapanala, S., Tuovi-nen, J. P., Tuittila, E. S., and Vesala, T.: Annual cycle of methane emission from a boreal fen measured by the eddy covariance technique, Tellus B, 59. 449–457, 2007.
Roulet, N. T.: Peatlands, carbon storage, greenhouse gases, and the Kyoto protocol: Prospects and significance for Canada, Wet-lands, 20, 605–615, 2000.
Roulet, N. T., Ash, R., and Moore, T. R.: Low boreal wetlands as a source of atmosphereic methane, J. Geophys. Res.-Atmos., 97, 3739–3749, 1992.
T. R., Ciais, Pl, Crosby, B. T., Czimczik, C. I., Grosse, G., Harden, J., Hayes, D. J., Hugelius, G., Jastrow, J. D., Jones, J. G., Kleinen, T., Koven, C.D., Krinner, G., Kuhry, P., Lawrence, D. M., McGuire, A. D. M., Natali, S. M., O’Donnel, J. A., Ping, C. L., Riley, W. J., Rinke, A., Romanovsky, V. E., Sannel, A. B. K., Schadel, C., Schaefer, K., Sky, J., Subikn, Z. M., Tarnocai, C., Turetsky, M. R., Waldrop, M. P., Walter Anthony, K. M., Wick-land, K. P., Wilson, C. J., and Zimov, S. A.: Expert assessment of vulnerability of permafrost carbon to climate change, Climatic Change, 119, 359–374, doi:10.1007/10584-013-0730-7, 2013. Segers, R.: Methane production and methane consumption: a review
of processes underlying wetland methane fluxes, Biogeochem., 41, 23–51, 1998.
Shannon, R. D. and White, J. R.: 3-year study of controls on methane emissions from 2 michigan peatlands, Biogeochem., 27, 35–60, 1994.
Silvola, J., Alm, J., Ahlholm, U., Nykanen, H., and Martikainen, P.
J.: CO2fluxes from peat in boreal mires under varying
tempera-ture and moistempera-ture conditions, J. Ecol., 84, 219–228, 1996. Strack, M., Kellner, E., and Waddington, J. M.: Dynamics of
biogenic gas bubbles in peat and their effects on peatland biogeochemistry, Global Biogeochem. Cycles, 19, GB1003, doi:10.1029/2004GB002330, 2005.
Tanner, C. and Thurtell, G.: Anemoclinometer measurements of Reynolds stress and heat transport in the atmospheric surface layer, University of Wisconsin, Madison, Wisconsin, 1969. Tarnocai, C., Canadell, J. G., Schuur, E. A. G., Mazhitova, G., and
Zimov, S.: Soil organic carbon pools in the northern circumpolar permafrost region, Global Biogeochem. Cycles, 23, GB20123, doi:10.1029/2008GB00327, 2009.
Tokida, T. T., Miyazaki, T., Mizoguchi, M., Nagata, O., Takakai, F., Kagemoto, A., and Hatano, R.: Falling atmopsheric pres-sure as a trigger for methane ebullition from peatland, Global Biogeochem. Cycles, 21, GB2003, doi:10.1029/2006GB002790, 2004.
Treat, C. C., Bubier, J. L., Varner, R. K., and Crill, P. M.: Timescale dependence of environmental and plant-mediated controls on CH4 flux in a temperate fen, J. Geophys. Res.-Biogeosci., 112, G1014, doi:10/129/2006JG000210, 2007.
Turetsky, M. R., Wieder, R. K., and Vitt, D. H.: Boreal peatland C fluxes under varying permafrost regimes, Soil Biol. Biochem., 34, 907–912, 2002.
Turetsky, M. R., Crow, S. E., Evans, R. J., Vitt, D. H., and Wieder, R. K.: Trade-offs in resource allocation among moss species con-trol decomposition in boreal peatlands, J. Ecol., 96, 1297–1305, 2008a.
Turetsky, M. R., Treat, C. C., Waldrop, M. P., Waddington, J. M., Harden, J. W., and McGuire, A. D.: Short-term response of methane fluxes and methanogen activity to water table and soil warming manipulations in an Alaskan peatland, J. Geophys. Res., 113, G00A10, doi:10.1029/2007JG000496, 2008. Updegraff, K., Pastor, J., Bridgham, S. D., and Johnston, C. A.:
En-vironmental and substrate controls over carbon and nitrogen min-eralization in northern wetlands, Ecol. Appl., 5, 151–163, 1995. Updegraff, K., Bridgham, S. D., Pastor, J., Weishampel, P., and
Harth, C.: Response of CO2and CH4emissions from peatalnds
to warming and water table manipulation, Ecol. App. 11, 311– 326, 2001.
USFWS: Seney National Wildlife Refuge Comprehensive Conser-vation Plan, Fort Snelling, MN, 2009.
Valentine, D. W., Holland, E. A., and Schimel, D. S.: Ecosystem and physiological controls over methane production in northern wetlands, J. Geophys. Res.-Atmos., 99, 1563–1571, 1994.
van Breemen, N.: HowSphagnumbogs down other plants, Trends
Ecol. Evolution, 10, 270–275, 1995.
Vasander, H. and Kettunen, A.: Carbon in boreal peatlands, in: Bo-real peatland ecosystems. Ecological Studies, edited by: Wieder, R. K. and Vitt, D. H., Springer-Verlag, Heidelberg, 165–194, 2006.
Vickers, D. and Mahrt, L.: Quality control and flux sampling prob-lems for tower and aircraft data, J. Atmos. Oceanic Technol., 14, 512–526, 1997.
Vitt, D. H.: Functional characteristics and indicators of boreal peat-lands, in: Boreal Peatland Ecology, edited by: Wieder, R. K. and Vitt, D. H., 9–24, Springer-Verlag, New York, 2006.
Waddington, J. M., Roulet, N. T., and Swanson, R. V.: Water
ta-ble control of CH4emission enhancement by vascular plants in
boreal peatlands, J. Geophys. Res.-Atmos., 101, 22775–22785, 1996.
Webb, E. K., Pearman, G. I., and Leuning, R.: Correction of flux measurments for density effects due to heat and water-vapor transfer, Q. J. Royal Meteorol. Soc., 106, 85–100, 1980. White, J. R., Shannon, R. D., Weltzin, J. F., Pastor, J., and
Bridgham, S. D.: Effects of soil warming and drying on methane cycling in a northern peatland mesocosm study, J. Geophys. Res.-Biogeosci., 113, G00A06, doi:10.1029/2007JG000609, 2008. Whiting, G. J. and Chanton, J. P.: Primary production control of
methane emission from wetlands, Nature, 364, 794–795, 1993. Wilcox, D. A., Sweat, M. J., Carlson, M. L., and Kowalski, K. P.: A
water-budget approach to restoring a sedge fen affected by diking and ditching, J. Hydrol., 320, 501–517, 2006.
Wilczak, J. M., Oncley, S. P., and Stage, S. A.: Sonic anemometer tilt correction algorithms, Bound.-Lay. Meteorol., 99, 127–150, 2001.
Williams, R. T. and Crawford, R. L.: Methane production in Min-nesota peatlands, Appl. Environ. Microbiol., 47, 1266–1271, 1984.
Yavitt, J. B. and Seidmann-Zager, M.: Methanogenic conditions in northern peat soils, Geomicrobiol. J., 23, 119–127, 2006. Zhuang, Q., Melillo, J. M., McGuire, A. D., Kicklighter, D. W.,
Prinn, R. G., Steudler, P. A., Felzer, B. S., and Hu, S.: Emissions
of CH4and CO2in Alaska: Implications for the region’s
green-house gas budget, Ecol. App., 17, 203–212, 2007.