ABSTRACT
RESUMO
Submitted on April 22th, 2014 and accepted on April 19th, 2017. 1This study is part of the first author’s Master’s dissertation.
2 Universidade Federal de Lavras, Departamento de Ciência dos Alimentos, Lavras, Minas Gerais, Brazil. [email protected]; [email protected]; [email protected] 3 Universidade Federal de Lavras, Departamento de Medicina Veterinária, Lavras, Minas Gerais, Brazil. [email protected]; [email protected]
4 Embrapa Gado de Leite, Juiz de Fora, Minas Gerais, Brazil. [email protected]
5 Universidade Federal Fluminense, Departamento de Saúde Coletiva Veterinária e Saúde Pública, Niterói, Rio de Janeiro, Brazil. [email protected] *Corresponding author: [email protected]
Milk quality and financial management at different scales of production
on dairy farms located in the south of Minas Gerais state, Brazil
1The objective of this study was to analyze the relationship between aspects related to financial management and scale of production with quality traits (total bacteria count - TBC; somatic cell count - SCC) and composition (protein, fat, lactose, total solids, and non-fat solids) of refrigerated bulk tank milk from 100 dairy farmers located in the south of Minas Gerais state, Brazil, by application of a semi-structured questionnaire. Dairy farmers were categorized according to the daily milk production: small (lower than 150 L); medium (151 to 500 L); and large (higher than 501 L). Chi-square tests and identification of possible relative risks between financial aspects and current regulation standards (Normative Instruction No. 62 of December 29, 2011, Ministry of Agriculture, Livestock and Supply) associated to TBC (higher 300,000 CFU/mL) and SCC (higher than 500,000 cells/mL) means from bulk tank milk among different milk scales productions were performed. Bulk tanks milk composition met the legislation standards and had not differ between scales of production; however, SCC means within all scales, and TBC of small farmers had not attended the legislation standards and differences were identified (P < 0.05). Regarding the financial management aspects, most farmers had no control over incomes, costs, nor calculated milk production cost, with decreased incidences as scale of production increased. Chi-square tests identified that producers that had no concern about milk quality payment bonuses had TBC means 2.95 times more likely (P < 0.05) to be above the current regulations. Small dairy farmers had a greater negligence of the costs management and hygienic milk production as compared to medium and large farmers.
Key words: somatic cell count; total bacterial count; management; dairy cattle.
Marcel Gomes Paixão2*, Marcos Aurélio Lopes3, Geraldo Márcio da Costa3, Guilherme Nunes de Souza4,5, Luiz Ronaldo de Abreu2, Sandra Maria Pinto2
10.1590/0034-737X201764030001
Qualidade do leite e gestão financeira em diferentes escalas de produção em propriedades
leiteiras localizadas no sul de Minas Gerais, Brasil
INTRODUCTION
Dairy activity is present all over Brazil, and it generates income, taxes and jobs. Minas Gerais state deserves special attention in this activity, and in the third quarter of 2013 it produced 1,553,256 million of liters of milk, representing 25.9% of this country total supply within this period, a slightly higher production as compared to the same period of 2012 within this state (IBGE, 2013). However, the Brazilian milk production chain has undergone a series of transformations, or a restructuring process, which had generated a series of consequences for the different agents involved. It can be observed that the primary production has become more dependent on industry, losing autonomy over its production processes and scale of production (Bortoleto, 2000).
The globalization of the economy and its follow competitiveness, have turned milk quality traits (somatic cell count and total bacterial count) in the main concern for the production chain in order to obtain good economic results (Vieira, 2010). In this scenario, dairy industries started to establish new conditions for the acquisition of bulk tank milk, by remunerating farmers that produced milk with quality and in larger volumes, in order to obtain dairy products with higher industrial yield and better sensorial aspects, reduction of transport costs, and optimization of milk supply routes.
Several reasons contribute to explain these previous cited changes, e.g., the lack of milk quality standardization and volumes of raw milk offered to industry (Martins, 1999). These transformations in the milk production chain and market have concerned the dairy farmers on the need of a good management of the activity, which leaded to a more efficient and competitive production; and thus farmers have been assuming a businessman position and leaving behind the amateurism, by establishing permanent financial management regardless of their production system size (Lopes et al., 2010).
Recent studies have studied some milk quality traits (milk composition and hygienic-sanitary aspects - SCC and TBC) and its association with different production scales (Borges et al., 2013; Bodenmüller et al., 2010), while others have studied technical and management efficiency of dairy farmers and its association with different scales of production (Fassio et al., 2005; Gonçalves et al., 2008; Lopes et al., 2008). However, there are no studies associating both milk quality traits and financial management of dairy farms within different scales of production. It is well known that to raise productivity and bulk milk quality (e.g., adequate levels of total solids and hygienic-sanitary traits) in a herd, the income of dairy activity is, at least in part, the main key to achieved this goal; because it allows investments that can raise productivity with a rapidly payback period, and also contributes to the whole milk production process as investments in herd sanity, feed, and establishment of good agricultural practices for milk quality (Paixão et al., 2014). The objective of this study was to analyze the relationship between some aspects related to financial management and scale of production with milk quality outcomes of 100 dairy farms located in six counties in the south of Minas Gerais state, Brazil.
MATERIAL AND METHODS
Prior to the study, of the total of 13 milk supply lines and 150 dairy farmers suppliers from a dairy industry located in Lavras county, Minas Gerais state, Brazil, 10 milk supply lines and 100 dairy farms were randomly select to participated. The selected farms, located in the counties of Lavras (12), Ijaci (34), Ribeirão Vermelho (3), Itumirim (31), Bom Sucesso (10) and Ibituruna (10) were mapped during November to December 2011 using a Garmin® Etrex
Vista HCX Global Positioning System (GPS), followed by transference of the data to a computer using GPS Trackmaker® software version 13.
médias de CBT (> 300.000 UFC/mL) e CCS (> 500.000 células/mL) e entre as diferentes escalas de produção. A composi-ção do leite, em todas as escalas, atendiam a normativa e não diferiram; porém, as médias de CCS, em todas as escalas, e as de CBT nos pequenos produtores, não atendiam, sendo verificadas diferenças (P < 0,05). Quanto ao gerenciamento, a maioria não controlava as receitas e despesas e não estimavam o custo de produção, com incidências decrescentes tanto quanto maior a escala. Os testes “qui-quadrados” revelaram que os produtores que não possuíam conhecimento do preço pago pelas bonificações pela qualidade do leite apresentaram 2,95 vezes mais chances (P < 0,05) da CBT estar acima do estabelecido pela normativa vigente. Verificou-se que os pequenos produtores apresentaram maior descaso no controle gerencial e na produção higiênica do leite, quando comparados aos médios e grandes.
A semi-structured questionnaire with questions related to general aspects of production and financial management of the farms was elaborated and applied from January to April 2012 in the selected farms. The data was transferred to an electronic spreadsheet and answers were grouped by categorization and frequency. Categorical (qualitative) data were transcribed according to its category code, while open questions and quantitative data were categorized before transcription. Farmers were grouped according to daily milk scales of production as previously described by Lopes et al. (2008): small (lower than 151 liters per day); medium (151 to 500 liters per day); and large (higher than 500 liters per day).
Data from bulk milk tank analyses [somatic cell count (SCC), total bacterial count (TBC), fat content, protein, and lactose] and daily production were acquired from the dairy industry milk quality extension team, and means were calculated from an interval period of 12 months of analyses (at least one bulk tank milk analyses per month - six months prior and after the beginning of the study, respectively). In cases where farmers no longer sold the milk to the dairy industry during this interval period, data from the previous 12 months prior to their exit were used for calculus. In order to obtain a normal distribution of the data for TBC and SCC means calculus, a logarithmic transformation (Log10) were performed before analyses of variance (ANOVA).
The bulk milk tank samples were collected by the dairy industry milk quality extension team, properly packaged and sent to Clínica do Leite, at “Luiz de Queiroz” School of Agriculture (ESALQ/USP) monthly. Milk composition and SCC analyses were performed on Bentley Combi System 2300® electronic equipment and TBC analyses were
performed on IBC BactoCount® electronic equipment
(Bentley Instruments Incorporated, Chaska, United States of America).
Analyses of variance and means tests were performed using SISVAR (Statistical Analysis System) software by the Scott-Knott test (Ferreira, 2008). Chi-square tests and relative risks between variables were performed using SPSS Statistics®17.0 software (SPSS, 2008). Each outcome were
classified in two categories (problematic and control) and scales of production in three categories (small, medium, large) prior to the chi-square tests. Factors associated at P < 0.05 were considered significant if the inferior confidence interval (ICI) and the superior confidence interval (ICS) had values higher than 1.
RESULTS AND DISCUSSION
The descriptive characteristics of the 100 enrolled dairy farms located in six different counties in the southern region of the state of Minas Gerais classified by scales of Table 1:
Descriptive characteristics of 100 enrolled dairy farms located in six dif
ferent counties in the south of Minas Gerais state, Brazil, classified by daily scale of milk production in a
12-months analyses period Counties (n = 6 )
Scale of milk production
1
Small (n = 47)
Medium (n= 35)
Large (n = 18)
T
otal (n = 100)
Bom Sucesso
0
5
5
10
Ibituruna
3
5
2
10
Ijaci
22
8
4
34
Itumirim
17
10
4
31
Lavras
5
5
2
12
Ribeirão
V
ermelho
0
2
1
3
Continuous variables Average daily production (L/farm)
77.06 ± (36.32)
286.3 ± (104.28)
741.2 ± (430.95)
269.84 ± (317.19)
T
otal production (L/day) (% of the total)
3,621.7 (13.42%)
10,021.4 (37.14%)
13,340.8 (49.44%)
26,983.9 (100%)
Number of lactating cows (mean)
13.42 ± (5.60)
32.08 ± (16.50)
56.27 ± (32.00)
27.33 ± (22.74)
A
verage daily production per cow (L)
6.29 ± (3.54)
9.99 ± (3.89)
13.7 ± (3.28)
8.9 ± (4.55)
Estimate of the average annual production per cow (L)
2
1,883.92 ± (1,086.28)
3,048.94 ± (1,187.20)
4,177.06 ± (1,031.54)
2,689.57 ± (1,399.22)
1According to Lopes
et al
. (2008): small (lower than 151 liters per day), medium (151 to 500 liters per day), and large (higher than 500 liters per day);
production are described in Table 1. It can be observed that the majority of farmers produced less than 151 liters daily, accounting for only 13.42% of the company’s total daily milk supply.
The average daily production was 269.84 liters per farm (Table 1), higher than previously reported in Brazil (52 L/ farm/day) and in Minas Gerais state (88 L/farm/day) in the year of 2006 (Zoccal, 2008). According to this author, although an increase was observed in the last decade in the daily milk supply from Brazilian farmers, the production per farm still lower as compared to international standards, because countries such United States, New Zealand and Australia production vary from 2,000 to 3,000 L/farm/day. The average number of lactation cows per farm was 27.33. The overall average for daily milk production per cow during the study period was 8.9 L (Table 1), higher than the Brazilian average (5.1 L/cow/day) in the year of 2011 (SEAB, 2013). The estimated milk production per cow/ year, considering a lactation period of 305 days, was 2,689.57 (± 1,399.22) L; lower than previously described by Fassio et al. (2006) (4,157 L/cow/year) in the state of Mi-nas Gerais, but higher than this country average (1,394 L/ cow/year) (Embrapa, 2010) and similar with values from higher producing regions (2,628 L/cow/year) such as north of Rio Grande do Sul, west of Santa Catarina, and southwest of Paraná, Brazil (Zoccal et al., 2011).
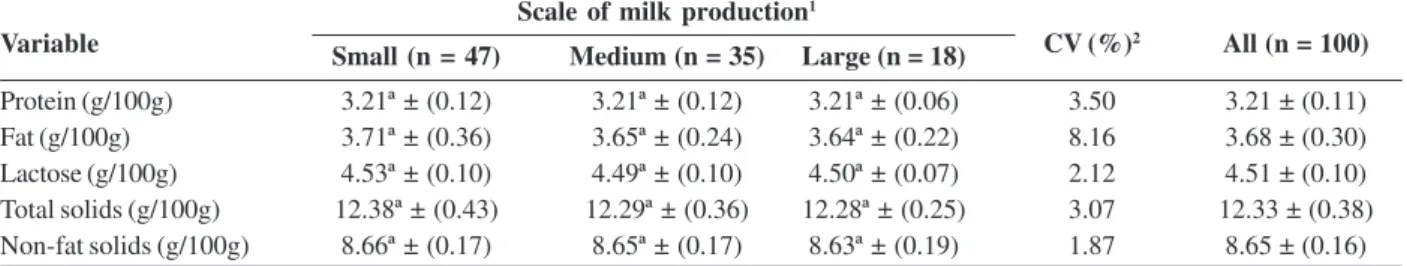
Means of bulk tank milk composition analyses from the 100 enrolled dairy farms located in six different counties in the south of Minas Gerais state, Brazil, classified by daily scale of production in a 12-months analyses period are presented in Table 2. We identified that all composition traits were in compliance with the current normative of milk quality in Brazil (Normative Instruction No. 62, of 2011) which standardize the minimum values for protein, fat and non-solids fat of 2.9 g/100g; 3.0 g/100g; and 8.4 g/100g for refrigerated raw milk (Brazil, 2011) respectively. Milk composition traits had not differed within daily production scales (P < 0.05).
Protein means in our study were higher as compared to Borges et al. (2013) (ranging from 3.0 to 3.15g/100g) that
studied milk composition at different production scales in 183 dairy farms located in Central Mineira and Minas West mesoregions in the state of Minas Gerais. These authors also had not identified statistical differences in protein means within different scales of production. According to Stelwagen (2011) protein levels in bulk tank milk is associated to genetic and non-genetic factors (diet, endocrine factors, environmental temperature, milking frequency, lactation stage and mastitis).
Fat mean values in our study (3.68 g/100g – Table 2) were similar to results previously reported by Bodenmüller et al. (2010) (3.72 g/100g) of 1,196 dairy farms bulk milk tank analyses from a dairy industry located in Londrina, Paraná, Brazil. Fat content had the higher variation among milk components, and according to McGuire et al. (2011) this variation is associated to breed, diet, lactation stage, season, environment temperature, and body score condition of the animals.
Our lactose means ranged from 4.49 to 4.52 g/100g (Table 2) and it was slightly higher than those previously reported by Borges et al. (2013) (4.37 to 4.47 g/ 100g). According to Bodenmüller et al. (2010) somatic cell count and total bacterial count has a positive association with milk lactose, thus, this milk component is impaired when milk sanitary-hygiene aspects are poorly handled.
Our total and non-fat solids results were similar than previously reported by Ribas et al. (2004) (12.32 and 8.62% for total and non-fat solids respectively) in a study that enrolled 257,540 bulk milk samples from 3 Brazilian states (Paraná, Santa Catarina and São Paulo) during January 1999 and November 2001. Paiva et al. (2012) stated that an increase in the raw milk solids content is crucial for the dairy industry in order to raise its products yield, and thus, increasing the competitiveness both in national and international dairy products market.
Means and standard deviations of the total bacterial count (TBC) and somatic cell count (SCC) analyses of bulk tank milk from 100 enrolled dairy farms located in six different counties in the south of Minas Gerais state, Brazil, classified by daily scale of production in a 12-months analyses period
Table 2: Means followed by the standard deviations of bulk tank milk composition analyses from 100 enrolled dairy farms located in six different counties in the south of Minas Gerais state, Brazil, classified by daily scale of production in a 12-months analyses period
Scale of milk production1
Small (n = 47) Medium (n = 35) Large (n = 18)
Protein (g/100g) 3.21ª ± (0.12) 3.21ª ± (0.12) 3.21ª ± (0.06) 3.50 3.21 ± (0.11)
Fat (g/100g) 3.71ª ± (0.36) 3.65ª ± (0.24) 3.64ª ± (0.22) 8.16 3.68 ± (0.30)
Lactose (g/100g) 4.53ª ± (0.10) 4.49ª ± (0.10) 4.50ª ± (0.07) 2.12 4.51 ± (0.10)
Total solids (g/100g) 12.38ª ± (0.43) 12.29ª ± (0.36) 12.28ª ± (0.25) 3.07 12.33 ± (0.38)
Non-fat solids (g/100g) 8.66ª ± (0.17) 8.65ª ± (0.17) 8.63ª ± (0.19) 1.87 8.65 ± (0.16)
Means within a line with different superscripts differs in ANOVA test (P < 0.05); 2CV = Coefficient of variation. 1According to Lopes et al.
(2008): small (lower than 151 liters per day), medium (151 to 500 liters per day), and large (higher than 500 liters per day).
are presented in Table 3. Our TBC results of small farmers was higher than the minimum standards (300,000 CFU/mL) from the current legislation (Normative Instruction number 62 of December 29, 2011, in the South, Southeast and West-Center regions, with dates from September 1, 2013) (Brasil, 2011); but in accordance with the same legislation at the time of the analysis in such region (600,000 CFU/mL). Our Log10TBC means of small farmers were greater as compared to medium and large farmers (P < 0.05) (Table 3). This results suggest that small farmers probably has smaller incomes, in concordance with Alves et al. (2004) which affirms that small farmers faces many financial difficulties in order to optimize production and many times they remain outside the process of modernization of agriculture, and thus directly impairing the quality of milk produced.
Small farmers also had a low contribution in the total volume of milk supplied to the dairy industry in study (13.42%), but its contribution to the total milk TBC rate (calculated by multiplying the volume of milk collected on each farm by the number of its CFU/mL, and divided by the sum of the total milk volume multiplied by its CFU/mL) was high (34.71%) (Table 3). This results show the importance of strategic plans in order to improve hygienic aspects during milking routine and refrigeration of milk. A proper milking routine should include the correct sanitization of utensils, milking equipment, milking clean cows, and a periodical check for the bulk tank temperature (Paixão et al., 2014), because a small volume of milk with a very high load of microorganisms can influence the quality of the milk truck.
The SCC mean within all farmers scales were not in compliance with the current legislation (500,000 cells/mL) but were in compliance at the period of collection (2011) (600,000 cells/mL) (Normative Instruction No. 62) (Table 3). The contribution rate of SCC of each daily production scale in the total SCC was similar to the percentages of contributions in the volume of milk collected daily. Besides lactose means within all daily production scales farmers did not statistically differ (P < 0.05), medium farmers that had a greater SCC means also presented a slightly lower lactose means as compared to small and large farmers, in agreement with Borges et al. (2013) who identified a simi-lar situation. According to Shuster et al. (1991) the lower synthesis of lactose is caused by destruction of the secretory tissue, leading to a leakage of lactose from the alveolus to the bloodstream due to an increased permeability of the membrane, and also by lactose fermenters intramammary pathogens.
The frequency of farms and relative risks of financial management aspects associated to bulk tank milk total bacterial count (TBC) and somatic cell count (SCC) higher than the standard values of the legislation from the 100 enrolled dairy farms located in six different counties in the south of Minas Gerais state, Brazil, classified by daily Table 3:
Means and standard deviations of total bacterial count (TBC) and somatic cell count (SCC) analyses of bulk tank milk from 100 enrolled dairy farms located in six dif
ferent counties in
the south of Minas Gerais state, Brazil, classified by daily scale of production in a 12-months analyses period Scale of milk
TBC
Log
10
TBC
Contribution rate
SCC
Log
10
SCC
Contribution rate
production
1
(CFU/mL of milk)
(CFU/mL of milk)
for the total TBC
2
(cells/mL of milk)
(cells/mL of milk)
for the total SCC
2
Small (n = 47)
404,000 ± (529,000)
5.33
b ± (0.53)
34.71%
528,000 ± (270,000)
5.67ª ± (0.24)
12.85%
Medium (n = 35)
152,000 ± (205,000)
4.85ª ± (0.55)
37.66%
591,000 ± (375,000)
5.70
a ± (0.25)
37.42%
Large (n = 18)
67,000 ± (94,000)
4.62ª ± (0.38)
27.63%
531,000 ± (169,000)
5.70
a ± (0.14)
49.73%
CV
3 (%)
10.18
4.0
All (n = 100)
252,559 ± (405,783)
5.03 ± (0.58)
100.00%
551,421 ± (297,977)
5.68 ± (0.23)
100.00%
Means within a column with dif
ferent superscripts dif
fers in
ANOV
A
test (
P
<
0.05);
1According to Lopes
et al
. (2008): small (lower than 151 liters per day), medium (151 to 500 liters per day), and lar
ge
(higher than 500 liters per day);
Marcel Gomes Paixão
et al.
V
içosa, v
. 64, n.3, p. 213-221, mai/jun, 2017
of production in a 12-months analyses period
Scale of milk production1
All Small Medium Large
n = 100 n = 47 n = 35 n = 18
n % n % n %
< 300 76 28 59.6 31 88.6 17 94.4 SCC6 0.822 1.11
> 300† 24 19 40.4 4 11.4 1 5.6
< 500 52 25 53.2 18 51.4 9 50.0 TBC5 0.822 1.11
> 500† 48 22 46.8 17 48.6 9 50.0
Yes 23 4 8.5 12 35.3 7 46.7 TBC5 0.334 1.79
No† 73 43 91.5 22 64.7 8 53.3 SCC6 0.343 0.63
Yes 25 4 8.5 14 41.2 7 46.7 TBC5 0.502 1.46
No† 71 43 91.5 20 58.8 8 53.3 SCC6 0.160 0.51
Yes 16 2 4.4 8 24.2 6 40.0 TBC 5 0.612 1.42
No† 77 43 95.6 25 75.8 9 60.0 SCC 6 0.181 0.47
Yes 17 5 10.9 7 21.2 5 33.3 TBC5 0.178 2.80
No† 77 41 89.1 26 78.8 10 66.7 SCC6 0.644 0.78
Yes 38 12 26.7 17 51.5 9 60.0 TBC5 0.048 2.95
No† 55 33 73.3 16 48.5 6 40.0 SCC6 0.496 0.75
1According to Lopes et al. (2008): small (lower than 151 liters per day), medium (151 to 500 liters per day), and large (higher than 500 liters per day); 2Cat. = Categories [OR estimated for the problematic category (†) as compared to the non-problematic for TBC or SCC response variable]. When the number of frequencies differs from the total of cases, data were lost. 3Ref. = Referential response variable of the chi-square test and relative risks (TBC or SCC); 4OR = Relative risks (odds ratio); 5P-value estimated for TBC higher than referential values (300,000 CFU/mL of milk); 6P-value estimated for SCC higher than referential values (500,000 cells/mL of milk).
TBC x 103(CFU/mL of milk)
SCC x 103(cells/mL of milk)
Do you control the incomes?
Do you control the costs?
Do you use spreadsheet for costs?
Do you know how much is your production cost?
Do you know how much you are paid for milk quality bonuses?
scale of production in a 12-months analyses period are presented in Table 4. We identified that 40.4% of the total of small farmers had TBC means higher than the legislation limits. Similar proportions within daily milk production scales farmers had SCC above the legislation limits (varying from 46.8% to 50.0% for small and large farmers, respectively) (Table 4). In agreement with our study, Mattioda & Bittencourt (2010) studying different production scales milk farmers in the region of Fernandes Pinheiro, Pará state, Brazil, also identified that smaller farmers had greater bulk tank milk TBC as compared to the others categories of farmers.
We identified that the majority of farmers had no control over incomes (including raw milk vending, animals and manure), but small farmers had the highest absence of incomes control (Table 4), which suggest the lack of professionalism within these farmers classes. According to Oliveira & Pereira (2009), the sustainability of a particu-lar activity, or, in other words, its long-term survival capacity, is directly associated with its economic management.
Most farmers had no control over their costs, and the greater proportion of them was classified under the small
farmer category. Spreadsheets were not used for costs control in one-third of the farmers which declared that had it under control. The use of spreadsheets, both electronic or a simple field notebook, are essential for financial costs control, because it facilitate the division of expenses into groups and assist milk quality extension teams and farmers to make future decisions (Lopes & Lopes, 1999). The majority of farmers (77%) reported that they were unaware of their average cost of production; and one farmer reported that knew their costs of production, but do not use a spreadsheet to record it. According to Gomes & Alves (1999), the correct determination of the dairy farm activity production cost is complex, due to its complexity, such as incomes that proceed from meat vending along with milk, family labor, and continuous production.
The majority (55%) of the farmers reported that do not know how much the dairy industry pay for milk quality bonuses neither how much this extra income can represents monthly; and a higher proportion was identified among small farmers as compared to medium and large farmers. Paixão et al. (2014) studying different hypothetical scenarios in order to calculate the implementation costs of different levels of good agricultural practices (GAP) (low,
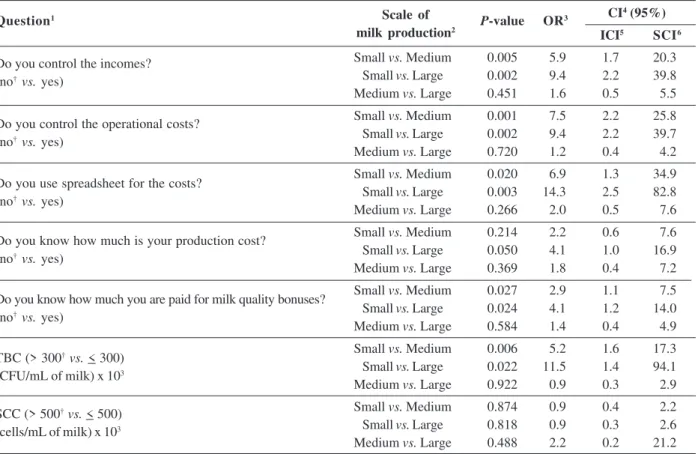
Table 5: Chi-square tests and relative risks of different scales of productions associated to financial management aspects and hygiene-sanitary quality of bulk tank milk in a 12-months analyses period from 100 enrolled dairy farms located in six different counties in the south of Minas Gerais state, Brazil
CI4 (95%)
ICI5 SCI6
Small vs. Medium 0.005 5.9 1.7 20.3
Small vs. Large 0.002 9.4 2.2 39.8
Medium vs. Large 0.451 1.6 0.5 5.5
Small vs. Medium 0.001 7.5 2.2 25.8
Small vs. Large 0.002 9.4 2.2 39.7
Medium vs. Large 0.720 1.2 0.4 4.2
Small vs. Medium 0.020 6.9 1.3 34.9
Small vs. Large 0.003 14.3 2.5 82.8
Medium vs. Large 0.266 2.0 0.5 7.6
Small vs. Medium 0.214 2.2 0.6 7.6
Small vs. Large 0.050 4.1 1.0 16.9
Medium vs. Large 0.369 1.8 0.4 7.2
Small vs. Medium 0.027 2.9 1.1 7.5
Small vs. Large 0.024 4.1 1.2 14.0
Medium vs. Large 0.584 1.4 0.4 4.9
Small vs. Medium 0.006 5.2 1.6 17.3
Small vs. Large 0.022 11.5 1.4 94.1
Medium vs. Large 0.922 0.9 0.3 2.9
Small vs. Medium 0.874 0.9 0.4 2.2
Small vs. Large 0.818 0.9 0.3 2.6
Medium vs. Large 0.488 2.2 0.2 21.2
1Odds ratio and P-values calculated for the problematic category (†) as compared to the non-problematic; 2According to Lopes et al.
(2008): small (lower than 151 liters per day), medium (151 to 500 liters per day), and large (higher than 500 liters per day); 3OR = Odds
ratio (relative risk); 4CI = Total confidence interval; 5ICI = Inferior confidence interval; 6SCI = Superior confidence interval.
Question1 Scale of P-value OR3
milk production2
Do you control the incomes?
(no†vs. yes)
Do you control the operational costs?
(no†vs. yes)
Do you use spreadsheet for the costs?
(no†vs. yes)
Do you know how much is your production cost?
(no†vs. yes)
Do you know how much you are paid for milk quality bonuses?
(no†vs. yes)
TBC (> 300†vs. < 300)
(CFU/mL of milk) x 103
SCC (> 500†vs. < 500)
medium and high) associated to milk quality improvement in a dairy farm, identified that, despite its higher initial investment, producers under the high GAP scenario had a higher and faster economic returns due to higher SCC and TBC bonuses paid from the dairy industry, as compared to the others hypothetical scenarios.
Financial management factors had no association with SCC levels above the current regulations in the chi-square tests. However, farmers that had no information about how much the dairy industry pay for milk quality bonuses had 2.95 times more likely (P = 0.048) of TBC means to be above the current regulation as compared to farmers who had information about theses bonuses (Table 4). Our results suggest that simple information about monetary values paid for milk quality bonuses has an impact on farmer’s attitude, and thus, an indirect positive impact on the milking routine hygiene.
Chi-square tests and relative risks of different scales of productions associated to financial management aspects and hygiene-sanitary quality of bulk tank milk in a 12-months analyses period from 100 enrolled dairy farms located in six different counties in the south of Minas Ge-rais state, Brazil are presented in Table 5. Small farmers had a greater negligence of costs control and hygienic production of bulk tank milk (TBC), as compared to medium and larger farmers, because from all chi-square tests performed for “small vs. medium” and “small vs. large” farmers, small farmers had an positive association with all negative category (P < 0.05), with an exception for the negative categories of the questions “Do you know how much is your production cost?” (no vs. yes) (P = 0.214) and for SCC (> 500,000 cells/mL vs. < 500,000 cells/mL) (small vs. medium and small vs. large, P = 0.874 and 0.818, respectively) (Table 5). Greater odds ratios (relative risks) were identified for “small vs. large” as compared to “small vs. medium” farmers for all problematic categories tested (with an exception for SCC); in addition, small farmers had 4.1 times more likely to had no information about their production costs (P = 0.05) as compared to larger farmers, evidencing that farmers with higher scales of production had greater concerns about management control of their dairy activity as compared to small farmers. An increase on farms productivity without a rapidly investment in technologies or changes in production system - for a better yield of the land, labor and costs - is only possible if the management of the dairy activity is sturdily improved (Ferreira Junior & Cunha, 2004).
No significant association (P < 0.05) was identified between medium and large farmers within all problematic categories tested. Our results indicate that, unlike the small farmers, medium and large scales of production farmers had greater concerns about hygienic quality of milk (TBC) and costs management of their farm.
CONCLUSIONS
Aspects related to financial management, bulk tanks milk composition and quality traits of 100 dairy farms located in six different counties in the south of Minas Ge-rais state, Brazil, were studied. Bulk tanks milk composition were in agreement with the current legislation; although, hygienic aspects of milking routine and udder health status from studied herds still requires attention from farmers and milk quality extension teams in order to reduce bulk tank milk TBC and SCC to legislation standards.
Negligence about financial management aspects related to the dairy activity increased as farmer’s daily scale of production decreased. Our results suggest that small farmers, which produces milk volumes lower than 150 liters per day, requires special attention from milk quality extension teams in order to improve productivity. Farmers that were aware of milk quality bonuses payment produced milk with a greater hygienic standard, and our results suggest that this awareness has a direct impact on farmer’s attitude, and an indirect impact on milking routine hygiene. Field professionals should draw farmer’s attention to the benefits that this bonuses has on their monthly income and also consumer’s health.
COMMITTEE OF ETHICS ON
RESEARCH
This study was approved and performed in accordance with the technical standards of biosafety and ethics from Plataforma Brasil and registered under protocol number 132.569.
ACKNOWLEDGEMENTS
To CNPq and FAPEMIG for the financial support and to UFLALEITE study group from Federal University of Lavras for the data collection support.
REFERENCES
Alves E (2004) Retornos à escala e mercado competitivo: teoria e evidências empíricas. Revista de Economia e Agronegócio, 2:311-334.
Bodenmüller AF, Damasceno JC, Previdelli ITS, Santana RG, Ra-mos CECO & Santos GT (2010) Tipologia de sistemas de pro-dução baseada nas características do leite. Revista Brasileira de Zootecnia, 39:1832-1839.
Borges LR, Fonseca LM, Martins RT & Oliveira MCPP (2013) Milk quality according to the daily range in farm production in the Mesoregion Central Mineira and Oeste of Minas Gerais regions, Brazil. Arquivo Brasileiro de Medicina Veterinária e Zootecnia, 65:1239-1246.
Brasil (2011) Instrução normativa nº 62, de 29 de dezembro de 2011 - Regulamento Técnico de Produção, Identidade e Quali-dade do Leite tipo A, Leite Cru Refrigerado, Leite Pasteurizado, Leite Cru Refrigerado e seu Transporte a Granel. DOU, 30/12/ 2011, Seção 1, p. 6.
Embrapa – Empresa Brasileira de Pesquisa Agropecuária (2010) Produção de leite, vacas ordenhadas e produtividade animal no Brasil – 1980/2010. Available at: <http://www.cnpgl.embrapa.br/ nova/informacoes/estatisticas/producao/tabela0230.php> Accessed on: January 10th, 2014.
Fassio LH, Reis RP & Dos Reis AJ (2005) Custos e shut-down
point da atividade leiteira em Minas Gerais. Revista de Econo-mia e Sociologia Rural, 43:759-777.
Fassio LH, Reis RP & Geraldo LG (2006) Desempenho técnico e econômico da atividade leiteira em Minas Gerais. Revista Ciên-cia e Agrotecnologia, 30:1154-1161.
Ferreira Junior S & Cunha NRS (2004) Eficiência técnica na ativi-dade leiteira de Minas Gerais: um estudo a partir de três sistemas de produção. In: 42º Congresso Brasileiro de Economia e Soci-ologia Rural, Cuiabá. Anais, Sober. CD-ROM.
Ferreira DF (2008) SISVAR: um programa para análises e ensino de estatística. Revista Symposium, 6:36-41.
Gomes AP & Alves E (1999) Identificando ineficiências na produ-ção de leite. Boletim do Leite, 6:1-2.
Gonçalves RML, Vieira WC, Lima JE & Gomes ST (2008) Analysis of technical efficiency of milk-producing farms in Minas Ge-rais. Economia aplicada, 12:321-335.
IBGE - Instituto Brasileiro de Geografia e Estatística (2013) Indi-cadores IBGE: Estatística da Produção Pecuária Setembro de 2013. Available at: <http://www.ibge.gov.br/home/estatistica/ indicadores/agropecuaria/producaoagropecuaria/abate-leite-cou-ro-ovos_201302_publ_completa.pdf>. Accessed on: January 02nd, 2014.
Lopes MA, Dias AS, Carvalho FM, Lima ALR, Cardoso MG & Carmo EA (2010) Efeito do tipo de mão-de-obra nos resultados econômicos de sistemas de produção de leite na região de La-vras (MG) nos anos 2004 e 2005. Revista Brasileira de Agrociência, 16:125-132.
Lopes MA, Dias AS, Carvalho FM, Lima ALR, Cardoso MG & Carmo EA (2008) Efeito da escala de produção nos resultados econômicos de sistemas de produção de leite na região de La-vras (MG, Brasil), em 2004 e 2005. Asociación Latinoamericana de Producción Animal, 16:129-137.
Lopes MA & Lopes DCF (1999) Desenvolvimento de um sistema computacional para cálculo do custo de produção do leite. Re-vista Brasileira de Agroinformática, 2:01-12.
Martins PC (1999) O pró-leite em Juiz de Fora: um caso de suces-so em gestão de propriedades agrícolas. In: Simpósio sustentabilidade da pecuária de leite no Brasil, Goiânia. Anais, Embrapa. p.189-199.
Mattioda F & Bittencourt JVM (2010) Qualidade do leite de pe-quenas propriedades rurais da região sudeste do Paraná. In: XXX Encontro nacional de engenharia de produção. Available at: <http://pg.utfpr.edu.br/dirppg/ppgep/ebook/2010/CONGRES-SOS/ENEGEP/21.pdf> Accessed on: January 21st, 2014.
Mcguire MA, Baumanm DE & Harvatine KJ (2011) Mammary Gland, milk biosynthesis and secretion, milk fat. In: Roginski H, Fuquay JW & Fox PF (Eds.) Encyclopedia of Dairy Sciences. London, Elsevier. p.359-366.
Oliveira AS & Pereira DH (2009) Gestão econômica de sistemas de produção de bovinos leiteiros. In: 1º Simpósio brasileiro de agropecuária sustentável, Viçosa. Anais, UFV. p.106-133. Paiva CAV, Cerqueira MMOP, Souza MRS & Lana AMQ (2012)
Evolução anual da qualidade do leite cru refrigerado processado em uma indústria de Minas Gerais. Arquivo Brasileiro de Medi-cina Veterinária e Zootecnia, 64:471-478.
Paixão MG, Lopes MA, Pinto SM & Abreu LR (2014) Impacto econômico da implantação das boas práticas agropecuárias re-lacionadas com a qualidade do leite. Revista Ceres, 66:612-621. Ribas P, Hartmann W, Monardes HG & Andrade UVCA (2004) Sólidos Totais do Leite em Amostras de Tanque nos Estados do Paraná, Santa Catarina e São Paulo. Revista Brasileira de Zootecnia, 33:2343-2350.
SEAB – Secretaria de Estado da Agricultura e do Abastecimento (2013) Cultura - Análise da Conjuntura Agropecuária Ano 2012/ 13 - Leite. Available at: <http://www.agricultura.pr.gov.br/arqui-vos/File/deral/Prognosticos/leite_2012_13.pdf>. Accessed on: January 21st, 2014.
Shuster DE, Harmon RJ, Jackson JA & Hemken EW (1991) Suppression of milk production during endotoxin-induced mastitis. Journal of Dairy Science, 74:3763-3774.
SPSS - Statistical procedures for social sciences (2008) SPSS. Version 17. Chicago, Survey Tips. CD ROM.
Stelwagen K (2011) Mammary Gland, Milk Biosynthesis and Secretion: Lactose. In: Roginski H, Fuquay JW & Fox PF (Eds.) Encyclopedia of Dairy Sciences. London, Elsevier. p.367-372. Vieira VF (2010) Características físico-químicas e sensoriais de queijos mussarela elaborados a partir de leites com diferentes contagens de células somáticas. Dissertação de Mestrado. Uni-versidade Estadual do Sudoeste da Bahia, Ilhéus. 71p. Zoccal R (2008) Cai o número de produtores e sobe a produção de
leite em Minas Gerais. Available at: <http://www.cileite.com.br/ panorama/especial15.html>. Accessed on: January 11th, 2014.