Repositório ISCTE-IUL
Deposited in Repositório ISCTE-IUL:
2018-04-17
Deposited version:
Post-print
Peer-review status of attached file:
Peer-reviewed
Citation for published item:
Lacorte, S., Luís, S., Gómez-Canela, C., Sala-Comorera, T., Courtier, A., Roig, B....Calas-Blanchard, C. (2018). Pharmaceuticals released from senior residences: occurrence and risk evaluation.
Environmental Science and Pollution Research. 25 (7), 6095-6106
Further information on publisher's website:
10.1007/s11356-017-9755-1
Publisher's copyright statement:
This is the peer reviewed version of the following article: Lacorte, S., Luís, S., Gómez-Canela, C., Sala-Comorera, T., Courtier, A., Roig, B....Calas-Blanchard, C. (2018). Pharmaceuticals released from senior residences: occurrence and risk evaluation. Environmental Science and Pollution Research. 25 (7), 6095-6106, which has been published in final form at https://dx.doi.org/10.1007/s11356-017-9755-1. This article may be used for non-commercial purposes in accordance with the Publisher's Terms and Conditions for self-archiving.
Use policy
Creative Commons CC BY 4.0
The full-text may be used and/or reproduced, and given to third parties in any format or medium, without prior permission or charge, for personal research or study, educational, or not-for-profit purposes provided that:
• a full bibliographic reference is made to the original source • a link is made to the metadata record in the Repository • the full-text is not changed in any way
The full-text must not be sold in any format or medium without the formal permission of the copyright holders.
Environmental Science and Pollution Research
Pharmaceuticals released from senior residences: occurrence and risk evaluation
--ManuscriptDraft--Manuscript Number: ESPR-D-17-02015
Full Title: Pharmaceuticals released from senior residences: occurrence and risk evaluation
Article Type: Research Article
Keywords: senior residences; pharmaceuticals; predicted environmental concentrations; risk management; 10 µg/L.
Corresponding Author: Sílvia Lacorte
Instituto de Diagnostico Ambiental y Estudios del Agua SPAIN
Corresponding Author Secondary Information:
Corresponding Author's Institution: Instituto de Diagnostico Ambiental y Estudios del Agua Corresponding Author's Secondary
Institution:
First Author: Sílvia Lacorte
First Author Secondary Information:
Order of Authors: Sílvia Lacorte Silvia Luis Cristian Gómez-Canela Teresa Sala-Comorera Audrey Courtier Benoit Roig Ana Brett
Claire Joannis Cassan Juan Ignacio Aragones Lucia Poggio
Thierry Noguer Luisa Lima Carlos Barata
Carole Calas-Blanchard Order of Authors Secondary Information:
Funding Information:
Abstract: One of the main pursuits, yet most difficult, in monitoring studies is to identify the sources of environmental pollution. In this study we have identified, for the first time, senior residences from south European countries as an important source of pharmaceuticals in the environment. We have estimated that compounds released from effluents of senior residences at a concentration of only 10 µg/L can reach river waters at a concentration higher than 0.01 µg/L, which is the European Medicines Agency threshold for risk evaluation of pharmaceuticals in surface waters. This study has been based on 5 establishments for the elder in Portugal, Spain and France, hosting from 52 to 139 patients. We have compiled the pharmaceuticals dispensed on
and laxatives the main drugs families administered. According to excretion rates, dilution in the sewage grid and elimination in wastewater treatment plants and reported toxicity, amoxilin, glucosamide, ibuprofen, metformin, paracetamol and megestrol were the compounds bearing the higher environmental hazards. Finally, we discuss the risk management actions related to the discharge of pharmaceuticals from senior
residences to surface waters. Suggested Reviewers: Chang'er Chen
Stockholm University [email protected]
Expert in monitoring of pharmaceuticals Reemtsma Thorsten
Helmholtz-Zentrum fur Umweltforschung UFZ [email protected]
Expert in monitoring and risk assessment of pharmaceuticals Rosa Marcé
URV
Espert in pharmaceuticasl in the environment Opposed Reviewers:
Additional Information:
Question Response
§Are you submitting to a Special Issue? Yes
(If “yes”) Please select a Special Issue from the following list:
as follow-up to "§Are you submitting to a Special Issue?
"
Pharmaceuticals released from senior residences: occurrence and risk
1
evaluation
2 3
Silvia Lacorte1, Silvia Luis2, Cristian Gómez-Canela1, Teresa Sala-Comorera1, 4
Audrey Courtier3, Benoit Roig3, Ana Maria Brett4, Claire Joannis-Cassan5, Juan 5
Ignacio Aragonés6, Lucia Poggio6, Thierry Noguer7, Luisa Lima 2, Carlos 6
Barata1, Carole Calas-Blanchard7 7
8
1 Department of Environmental Chemistry, IDAEA-CSIC. Jordi Girona 18-26, 9
08034 Barcelona, Catalonia, Spain. 10
11
2 Instituto Universitário de Lisboa (ISCTE-IUL), Centro de Investigação e 12
Intervenção Social (CIS-IUL), Lisboa, Portugal 13
14
3 Université de Nimes, EA7352 CHROME, Rue du Dr Georges Salan, 30021 15
Nimes, France 16
17
4, Departamento de Química, Faculdade de Ciências e Tecnologia, 18
Universidade de Coimbra, 3004-535 Coimbra, Portugal 19
20
5 Université de Toulouse; INPT; CNRS; LGC (Laboratoire de Génie Chimique); 21
4, Allée Emile Monso, F-31030 Toulouse, France 22
23
6 Facultad de Psicología, Universidad Complutense de Madrid, Madrid, Spain 24
25
7 Laboratoire Biocapteurs, Analyses, Environnement, BAE-LBBM USR 3579, 26
Université de Perpignan Via Domitia, 52 Av Paul Alduy, 66860 Perpignan 27 cedex, France 28 29 30 ABSTRACT 31 32
One of the main pursuits, yet most difficult, in monitoring studies is to identify 33
the sources of environmental pollution. In this study we have identified, for the 34
first time, senior residences from south European countries as an important 35
source of pharmaceuticals in the environment. We have estimated that 36
compounds released from effluents of senior residences at a concentration of 37
only 10 µg/L can reach river waters at a concentration higher than 0.01 µg/L, 38
which is the European Medicines Agency threshold for risk evaluation of 39
pharmaceuticals in surface waters. This study has been based on 5 40
establishments for the elder in Portugal, Spain and France, hosting from 52 to 41
139 patients. We have compiled the pharmaceuticals dispensed on a daily base 42
Manuscript Click here to download Manuscript Pharmaceuticals released
from senior residences10_final.docx
Click here to view linked References
1 2 3 4 5 6 7 8 9 10 11 12 13 14 15 16 17 18 19 20 21 22 23 24 25 26 27 28 29 30 31 32 33 34 35 36 37 38 39 40 41 42 43 44 45 46 47 48 49 50 51 52 53 54 55 56 57 58 59 60 61
and calculated the consumption rates. Up to 636 g of pharmaceuticals are 43
consumed daily, being analgesics, antiepileptic, antibiotic, anticonvulsant, 44
antidiabetic and laxatives the main drugs families administered. According to 45
excretion rates, dilution in the sewage grid and elimination in wastewater 46
treatment plants and reported toxicity, amoxilin, glucosamide, ibuprofen, 47
metformin, paracetamol and megestrol were the compounds bearing the higher 48
environmental hazards. Finally, we discuss the risk management actions related 49
to the discharge of pharmaceuticals from senior residences to surface waters. 50
51
Keywords: senior residences; pharmaceuticals; predicted environmental
52
concentrations; risk management; 10 µg/L. 53
54
Introduction
55
Water pollution today represents a major challenge both at the economic 56
and social level. Quality of water must be preserved both for human protection 57
and to safeguard the environment from compounds capable to exert an effect at 58
low levels of concentration. Although the Water Framework Directive requires 59
European countries to control certain compounds classified as "priority 60
pollutants", monitoring programs have identified a diffuse and persistent 61
pollution in water due to other compounds. These compounds are the so-called 62
emerging pollutants and are refractory to traditional wastewater treatment. 63
Among others, pharmaceuticals are of concern given their high incidence and 64
global distribution in river waters (Banjac et al. 2015, Zhang et al. 2013). Their 65
presence in the environment has been attributed to the discharge of hospital 66
effluents (Gómez-Canela et al. 2014, Langford &Thomas 2009, Santos et al. 67
2013, Verlicchi et al. 2010), domestic water (Rabiet et al. 2006) and effluents 68
from Wastewater Treatment Plants (WWTP) (Gómez-Canela et al. 2012, 69
Santos et al. 2013, Verlicchi et al. 2012), but to date, no attention has been paid 70
to senior residences. 71
In Europe and over the world, the phenomenon of aging and over-aging has 72
led to societies where 15-20% of the population is over 65 years. Countries with 73
aging populations have to increase their resources according to the demands of 74
elderly people being necessary to ensure environmental sustainability and 75 1 2 3 4 5 6 7 8 9 10 11 12 13 14 15 16 17 18 19 20 21 22 23 24 25 26 27 28 29 30 31 32 33 34 35 36 37 38 39 40 41 42 43 44 45 46 47 48 49 50 51 52 53 54 55 56 57 58 59 60 61
public health. The homes for elderly people are infrastructures that articulate 76
diverse services in response to biopsychosocial needs and have become 77
popular in most European countries. Senior residences have a configuration of 78
typically 50-150 individuals and provide lodging, meal services and health and 79
social assistance. With an estimated consumption of 5-10 pills/patient, the total 80
consumption of pharmaceuticals is of hundreds of milligrams. These 81
compounds are excreted through urine of faeces and are released to the main 82
urban grid without any type of treatment. There, waters are transported to the 83
WWTP, which unable to eliminate the total load of pharmaceuticals, contribute 84
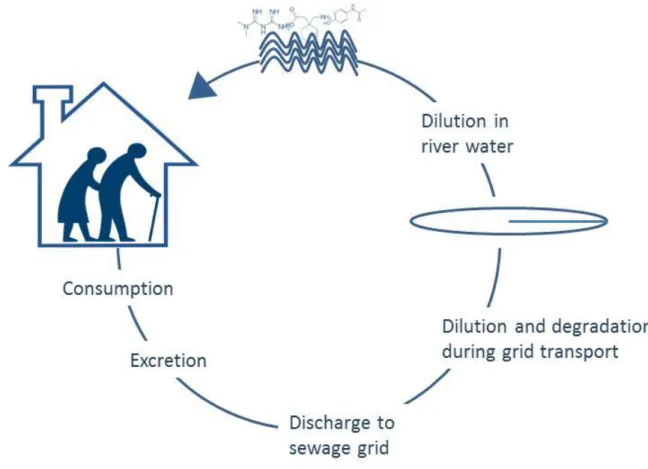
to their release to receiving waters, posing the environment at risk (Figure 1). 85
This problem is magnified all around the world due to the aging effect and the 86
increased population established in senior residences. Thus, senior residences 87
can represent a point source pollution of pharmaceuticals to the environment. 88
The European Medicines Agency (EMEA) is an agency of the European 89
Union (EU), responsible for the scientific evaluation, supervision and safety 90
monitoring of medicines developed by pharmaceutical companies for use in the 91
EU (European Medicines Agency (EMEA) 2006). Among other activities, they 92
monitor the safety of medicines across their life cycle. In 2006, EMEA proposed 93
the calculation of predicted environmental concentrations (PEC) to estimate the 94
presence of pharmaceuticals in environmental waters and recommended to 95
evaluate their risk when PEC values in surface water were equal or above the 96
threshold value of 0.01 µg/L. This model takes into account the consumption of 97
a specific drug, the excretion rates and the dilution factor in a particular region 98
and permits to prioritize specific drugs with potential to cause pharmacological 99
effects at specific water concentrations (Fick et al. 2010). The efficiency and 100
applicability of the approach to determine the theoretical presence of 101
pharmaceuticals in surface and wastewaters and to prioritize compounds for 102
further monitoring has been demonstrated by the increasing number of research 103
papers that use this methodology, as in Italy (Riva et al. 2015), Germany 104
(Kümmerer &Al-Ahmad 2010), NW England (Booker et al. 2014), France 105
(Besse et al. 2008), Catalonia (Franquet-Griell et al. 2015), The Netherlands 106
(Oosterhuis et al. 2013) and Poland (Oldenkamp et al. 2013). Consumption or 107
prescription data have demonstrated to be very valuable to determine the 108 1 2 3 4 5 6 7 8 9 10 11 12 13 14 15 16 17 18 19 20 21 22 23 24 25 26 27 28 29 30 31 32 33 34 35 36 37 38 39 40 41 42 43 44 45 46 47 48 49 50 51 52 53 54 55 56 57 58 59 60 61
occurrence of pharmaceuticals in the environment (Ortiz de García et al. 2013, 109
van Nuijs et al. 2015). According to PEC values and toxicological information, it 110
is then possible to determine the potential risk of pharmaceuticals in the 111
environment (van Leeuwen &Vermeire 2007). 112
Our hypothesis is that senior residences represent an important source, yet 113
unexplored, of pharmaceuticals to the environment. In this study we propose an 114
innovative scheme for the prioritization and risk management of 115
pharmaceuticals discharged from senior residences based on consumption 116
data, excretion, dilution and toxicity. We have followed EMEA guidelines for risk 117
evaluation and we provide a list of pharmaceuticals consumed in high quantities 118
in senior residences for which actions have to be implemented to reduce the 119 environmental impact. 120 121 Methodology 122
Nursing homes studied
123
Home for the elderly can be classified in different categories, each with its 124
own specialization, particularity and functioning, as they host people with 125
different types of illnesses. In this study we have selected 5 residences, 1 in 126
France, 2 in Spain and 2 in Portugal. For comparability purposes among the 127
three countries, the residences selected were all mixed model residences that 128
had a high number of beds (>50), and that were located in urban areas. We 129
considered as mixed model residences those that were either i) oriented to 130
housing (i.e, for independent individuals that do not require help or assistance) 131
and oriented to general impairment (for individuals with general loss of activities 132
of daily function), or ii) oriented to housing, or general impairment, or specific 133
types of diseases, and, in addition, provide services to other elderly people, 134
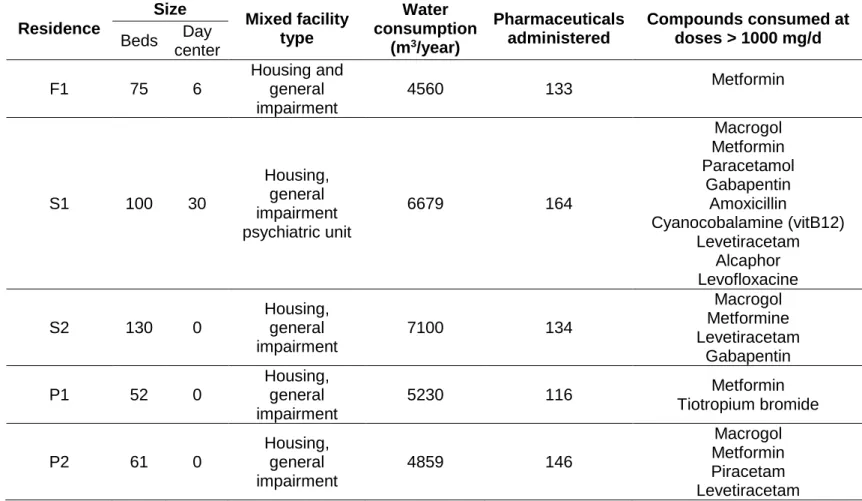
such as day care center. The specific description of each residence (number of 135
beds, type of facility and the annual water consumption) is indicated in Table 1. 136
In each residence, we interviewed the manager and the head health 137
professional to obtain information on the type of patients, sickness and level of 138
impairment. All this information was key to define the typology of the residence 139
and treatments performed. Then, each residence provided data on the 140 1 2 3 4 5 6 7 8 9 10 11 12 13 14 15 16 17 18 19 20 21 22 23 24 25 26 27 28 29 30 31 32 33 34 35 36 37 38 39 40 41 42 43 44 45 46 47 48 49 50 51 52 53 54 55 56 57 58 59 60 61
consumption of pharmaceuticals, as the number of pills, injections or other 141
presentations of a specific drug, and their concentration. This information was 142
compiled to identify the main pharmaceutical families administered and to 143
calculate the total amount consumed (g per day) in each residence. To compare 144
the consumption rates in the 5 residences, consumption data was normalized 145
per patient so that data is given also in mg/d/inhab. Data correspond to 146
consumptions in 2015, except for F1 and S1 which correspond to 2016. 147
148
Estimation of the Predicted Environmental Concentrations
149
PECs calculation were adapted from EMEA guidelines to determine the 150
predicted concentrations in effluents from senior residences (PECres) and in 151
rivers waters (PECriv). The former permitted to determine pharmaceuticals 152
released to sewage waters according to high consumption and high excretion. 153
On the other hand, PECriv considered the dilution in the sewage grid, the 154
elimination in WWTP and the final dilution to receiving waters. PEC values are 155
always given in µg/L. 156
When calculating PECres, one of the main particularities that might affect 157
the discharge of pharmaceuticals is the people wearing diapers. This implies 158
that an inferior amount of pharmaceuticals than the one that was actually 159
consumed will be discharged. This factor is included in the PECres formula: 160
161
where, 162
- Consumption (g/day) is the quantity of each pharmaceutical delivered in 163
each senior residence. 164
- Fexc is the excreted fraction of the unchanged drug, considering both 165
urine and feces. When different values were reported in the bibliography, 166
the highest one was used to consider the worst case scenario. Selected 167
values ranged from negligible to >90%, depending on the compound. For 168
those drugs whose values could not be found, no value was assigned. 169 (eq. 1) 1 2 3 4 5 6 7 8 9 10 11 12 13 14 15 16 17 18 19 20 21 22 23 24 25 26 27 28 29 30 31 32 33 34 35 36 37 38 39 40 41 42 43 44 45 46 47 48 49 50 51 52 53 54 55 56 57 58 59 60 61
- Fdiap is the percentage of patients using diapers. In this study, we used 170
the value of 50% as it represents the mean percentage of patients in 171
senior residences using diapers. 172
- Water consumption (L/d) is the water consumed in each residence per 173
patient per day in 2015 (Table 1). 174
- Inhab is the number of patients in each residence (Table 1). 175
To evaluate the amount of pharmaceuticals discharged to the river waters, 176
PECriv were estimated using the formula: 177
178
where: 179
- Fgrid is an expected 10% dilution of effluent waters from senior 180
residences to the general sewage grid. 181
- Fwwtp is the removal fraction in WWTP. Removal data was obtained 182
from EPI Suite by Environmental Protection Agency (EPA) (EPA 2013). 183
In the cases that no information was available a default value of 0 was 184
used. 185
- DF is the Dilution Factor from WWTP effluents to receiving water and 186
was considered 75.73 for France, 25.92 for Spain and 61.23 for Portugal, 187
as suggested by Keller (Keller et al. 2014). This differential dilution factor 188
is used to better estimate PEC values according to the differences in 189
river flows and dynamics among countries. 190
For compounds with PECriv > 0.01 µg/L, as proposed by EMEA, the 191
environmental hazards were calculated. Environmental risks to aquatic animals 192
were estimated from the hazard quotient index (HQ) depicted in eq 3, using the 193
estimated PECs and PNECs. The latter parameters was obtained from eq 4 194
using reported ecotoxicological information from Ecotox (EPA), Drugbank or 195
toxicological data sheets of Sigma-Aldrich, Sciencelab and Santa Cruz 196
Biotechnology. As limited information for aquatic species ecotoxicity was found 197
for most selected pharmaceuticals, PNEC was estimated using the lowest 198
chronic LOEC or acute LC50s considering application factors (FA) of 100 and 199 (eq. 2) 1 2 3 4 5 6 7 8 9 10 11 12 13 14 15 16 17 18 19 20 21 22 23 24 25 26 27 28 29 30 31 32 33 34 35 36 37 38 39 40 41 42 43 44 45 46 47 48 49 50 51 52 53 54 55 56 57 58 59 60 61
1000, respectively. For those substances having only mammalian toxicological 200
LD50 information an additional factor of 10 was used (i.e. FA=10000). 201 ) 3 . (eq PNEC PEC HQ i i 202 ) 4 . (eq FA ENPOINTi PNECi 203
where PECi and PNEC are the estimated PEC and PNEC of contaminant i. 204
Total hazard quotients HQTotal considering all selected pharmaceuticals were 205
determined using the independent action concept (eq. 5) assuming that 206
compounds act independently and that their effects were uncorrelated. 207
1
( .5) 1 1 eq HQ HQ n i i Total
208where HQi is the hazard quotient of compound i. 209
210
Prioritization and risk evaluation
211
As highlighted by Donnachie et al. (2016), it is not feasible to monitor all 212
possible pharmaceuticals present in the environment and it is necessary to 213
prioritize those that can represent the greatest threat (Donnachie et al. 2016). 214
The consumption data permitted to prioritize compounds with the highest 215
potential impact in river waters from France, Spain and Portugal. Figure 2 216
exemplifies the workflow used, which is based on: 217
(i) listing of pharmaceuticals according to the consumed data in each 218
senior residence. 219
(ii) calculation of the predicted concentration in the effluents of the senior 220
residence (PECres) for all compounds and all residences. 221
(iii) preselection of compounds with PECres > 10 µg/L to study their 222
transport through the sewage grid and elimination in the WWTP. This 223
concentration was tentatively selected to obtain the EMEA threshold 224
level of 0.01 µg/L. 225
(iv) calculation of PEC in river waters and ranking of compounds with 226
PECriv higher than the 0.01 µg/L threshold level proposed by EMEA. 227 1 2 3 4 5 6 7 8 9 10 11 12 13 14 15 16 17 18 19 20 21 22 23 24 25 26 27 28 29 30 31 32 33 34 35 36 37 38 39 40 41 42 43 44 45 46 47 48 49 50 51 52 53 54 55 56 57 58 59 60 61
(v) toxicity evaluation using Daphnia magna or other species EC50 or 228
LC50 values, depending on available data. 229
(vi) selection of toxic compounds for which risk assessment is needed. 230
All this information has been compiled in a database that allows the 231
prioritization of those substances that may produce an environmental effect. 232 233 Results 234 Consumption of pharmaceuticals 235
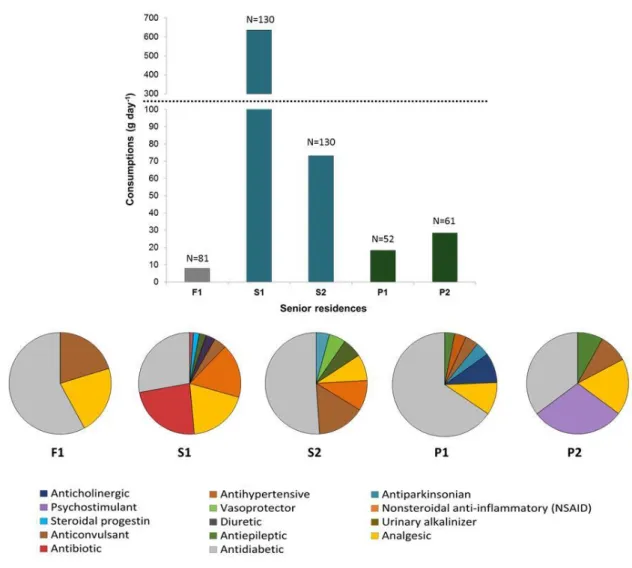
Figure 3 shows the consumption of pharmaceuticals in the 5 senior residences 236
located in France, Spain and Portugal. The net total amount of pharmaceuticals 237
ranged between 7.9 and 636 g/d, being the residences in Spain the ones with 238
the highest consumption. According to the size of each residence, this 239
corresponds to an average consumption per day per patient ranged from 48.3 240
mg in F1 to 4889 mg in S2, although the levels were quite similar in S2 and P1 241
and P2 (between 365 to 563 mg/inhab/d). Considering these quantities and 242
taking into account that senior residences have become a living preference in 243
many countries, the amounts of pharmaceuticals discharged to the sewage grid 244
can become a real problem. For instance, there are >8000 senior residences in 245
France, 5339 in Spain and 4787 in Portugal, which suggest that the estimated 246
total consumption of pharmaceuticals from senior residences should not be 247
disregarded in terms of contribution of pharmaceuticals load to the sewage grid 248
and indirectly, to the environment. If we consider an average discharge of 100 249
g/day in a median residence of 100 patients, that would mean than on a country 250
base, from 478 to 800 kg of pharmaceuticals are discharged daily from senior 251
residences in south-west Europe. These waters enter the sewage system in 252
most countries, but eventually could be discharged without any treatment. Thus, 253
the incurred risk is high. 254
The number of pharmaceuticals consumed in each senior residence ranged 255
between 133 and 164 (Table 1). Main pharmaceuticals consumed (> 1 g/d) in 256
each of the five studied residence are also indicated in Table 1. These highly 257
consumed drugs are similar to those detected in Iraq where paracetamol, 258
amoxicillin and metformin has an annual consumption exceeding 1000 tonnes 259 1 2 3 4 5 6 7 8 9 10 11 12 13 14 15 16 17 18 19 20 21 22 23 24 25 26 27 28 29 30 31 32 33 34 35 36 37 38 39 40 41 42 43 44 45 46 47 48 49 50 51 52 53 54 55 56 57 58 59 60 61
per year (Al-Khazrajy &Boxall 2016). Observed differences in main consumed 260
drugs in French, Spanish and Portuguese residences evidenced the different 261
and specific treatments that patients can receive. A total of 397 common 262
pharmaceuticals were consumed in the 5 senior residences studied, which 263
belong to 90 therapeutic classes. Table SI1 shows all pharmaceuticals 264
consumed in the 5 senior residences studied, indicating their Anatomical 265
Therapeutic Chemical classification code (ATC) (WHO 2017). On the other 266
hand, the main therapeutic classes consumed are indicated in Figure 3 and 267
include antidiabetic, analgesic, antibiotics, and antiepileptics as the main 268
treatments for the elderly. Figure 3 also reflects the high variability of each 269
therapeutic group consumed in the 3 countries, suggesting specific 270
pharmacological protocols per country or either specific medication according to 271
impairment intrinsic of each patient or typology of residence. 272
273
Flow of pharmaceuticals from senior residences to river waters
274
Of the total number of pharmaceuticals consumed, we determined the PEC 275
values in the effluents of senior residences. These calculations took into 276
account that approximately half of the people living in the residences wear 277
diapers. At a glance, this appears to minimize the problem of pharmaceuticals 278
discharged into the wastewaters. However, it is important to note that this is 279
adding up to another problem. If diapers are not properly disposed as biohazard 280
waste in the senior residences, a similar amount of residues is polluting other 281
places. 282
The PECres varied from negligible to mg/L level (Table 2). Given the large 283
number of pharmaceuticals administered, it is obvious that the ones consumed 284
at the highest concentration and showing high excretion rates will have higher 285
chances to reach surface waters. We initially set a threshold value of 10 µg/L for 286
further risk evaluation. Such threshold was chosen because once these 287
pharmaceuticals are discharged to the sewage grid, they are diluted, 288
biodegraded in the WWTP to be finally diluted in receiving surface waters 289
(Figure 1). This process of dilution and elimination of pharmaceuticals in WWTP 290
would presumably lead to a concentration in river waters close to the EMEA 291 value of 0.01 µg/L. 292 1 2 3 4 5 6 7 8 9 10 11 12 13 14 15 16 17 18 19 20 21 22 23 24 25 26 27 28 29 30 31 32 33 34 35 36 37 38 39 40 41 42 43 44 45 46 47 48 49 50 51 52 53 54 55 56 57 58 59 60 61
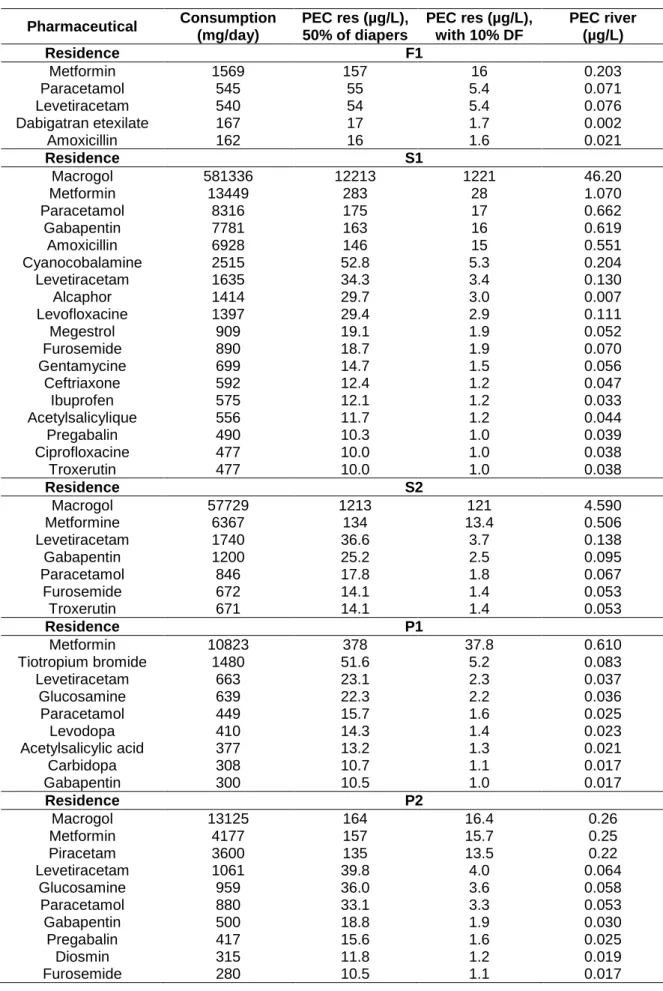
Among the total 397 pharmaceuticals administered in each residence, only 23 293
had PECres > 10 µg/L, being 5 for F1, 18 for S1, 7 for S2, 9 for P1 and 10 for 294
P2. Table 2 indicates the compounds with PECres > 10 µg/L for which PECriv 295
was further studied. 296
The PECriv are also indicated in Table 2 and ranged between 0.002 and 1.15 297
µg/L, with the highest levels found in Spain due to the lower dilution factor. 298
Comparing the PECres and PECriv, the concentrations estimated in river 299
waters represent between 0.12-0.38% of the initially discharged by the effluents 300
of the senior residence. This decrease in concentration is basically due to 301
dilution in the sewage grid and dilution in river. The WWTP degradability for 302
most of the compounds was very low and, thus, a high proportion of 303
pharmaceuticals will be potentially discharged by the WWTP effluents to 304
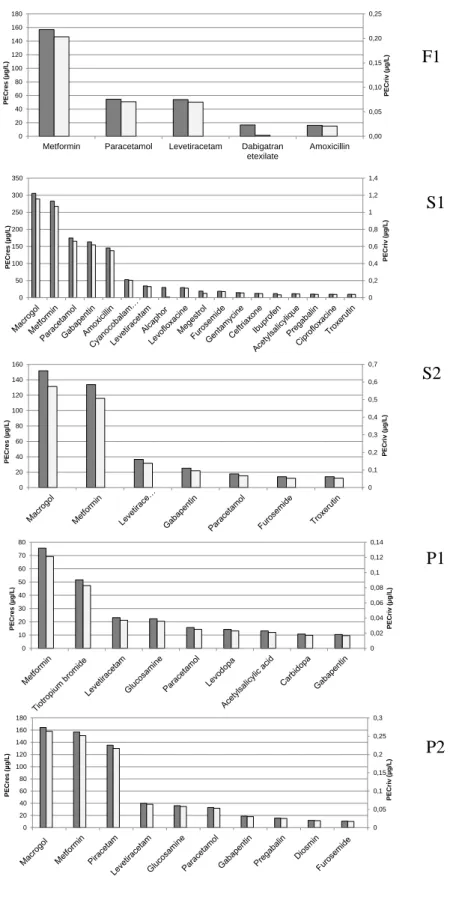
receiving waters. Figure 4 shows, using a double axis, this difference. For the 305
studied compounds, there was very little variability on the percentage of 306
pharmaceuticals detected in river in comparison to the effluents of the 307
residences, indicating a similar behavior of all pharmaceuticals once discharged 308
to the sewage grid. 309
In France, 5 compounds with concentrations higher than 10 µg/L in PECres had 310
PECriv between 0.002 to 0.203 µg/L, which represent 0.13±0.0002% of the 311
concentration initially discharged, except for dabigatran which was highly 312
biodegradable in WWTP and whose PEcriv was of 0.0023 µg/L. Therefore, 4 313
compounds having PECriv > 0.01 µg/L included metformin, paracetamol, 314
levetiracetam and amoxicillin. 315
In both Spanish residences, 17 out of 18 compounds exceeded the EMEA 316
threshold value (0.01 µg/L). PECriv ranged from 0.03 to 1.07 µg/L, except for 317
macrogol which had PECriv from 4.59 to 46.2 µg/L. Macrogol is the international 318
nonproprietary name for polyethylene glycol used primarily as laxative or also 319
as excipient in many pharmaceutical products. It is consumed in high amounts 320
in Spain (57-580 g/d in the 2 Spanish residences or from 0.5 to 5 g/inhab/d) and 321
is rapidly excreted and poorly degraded in WWTP. This compound has never 322
been monitored in surface waters. The relatively high PECriv levels are mainly 323
attributed to the low biodegradability in the WWTP. Three compounds, namely 324
alcaphor (urinary alkalinizer), megestrol (a steroidal progestin) and ibuprofen 325 1 2 3 4 5 6 7 8 9 10 11 12 13 14 15 16 17 18 19 20 21 22 23 24 25 26 27 28 29 30 31 32 33 34 35 36 37 38 39 40 41 42 43 44 45 46 47 48 49 50 51 52 53 54 55 56 57 58 59 60 61
(an anti-inflamatory) were highly degradable. Specifically, PECriv for alcaphor 326
was of 0.0068 µg/L due to 94% elimination in the WWTP, suggesting that there 327
would be no risk. In contrast, WWTP were only partially efficient in eliminating 328
ibuprofen (29%) and megestrol (30%) but given the high PECres, 0.03 and 0.05 329
µg/L, they would be expected to be found in river waters. Overall, in Spanish 330
residences, compounds with the highest PECriv were macrogol, metformin, 331
paracetamol, gabapentin and amoxicillin. The low dilution factor is mainly 332
responsible for the high PECriv of these compounds, which exceeded the value 333
of 0.5 µg/L. 334
Finally, in Portugal 9 compounds in P1 and 10 in P2 had PECres > 10 µg/L 335
(Table 2) and PECriv higher than the EMEA 0.01 µg/L, indicating that despite 336
the high dilution factor compared to Spain (61.23 vs 25.92), the 337
pharmaceuticals consumed in senior residences might contribute to river waters 338
contamination. In Portugal, the compounds with the highest PECriv were 339
macrogol, metformin, and piracetam. 340
When estimating the PECriv for compounds with PECres < 10 µg/L, we 341
observed that dilution in the sewage grid, elimination in the WWTP and dilution 342
in river waters was not enough to eliminate those pharmaceuticals. We have 343
then identified that compounds present in effluents from senior residences at 344
concentrations lower than 10 µg/L would be presumably detected in river waters 345
at levels of 0.01-0.02 µg/L. The following compounds should be considered as 346
suspect compounds as they could be present in river waters at concentrations > 347
0.01 µg/L: sulfamethoxazole, rifaximine, pentosane polysulfate sodique, 348
omeprazole, valproic acid, trimethoprim, ketoconazole, carbidopa, donezepil, 349
valsartan, sitaglipin, tramadol, ranitidine and acetylsalicylic acid. 350
Considering the 3 countries, the most consumed drugs and for which the 351
PECriv is higher than 0.01 µg/L proposed by EMEA are listed in Table 2. 352
Altogether, 23 compounds of the 397 commonly administered in senior 353
residences had PECres > 10 µg/L and PECriv > 0.01 µg/L. Of the 23 prioritized 354
compounds, only 3 compounds were common in all countries: paracetamol, 355
levetiracem and metformin. Compounds used both in Spain and Portugal are 356
acetylsalicylic acid, gabapentin, pregabalin, carbidopa, furosemide and 357
macrogol. The rest of the compounds are specific of a given country or even 358 1 2 3 4 5 6 7 8 9 10 11 12 13 14 15 16 17 18 19 20 21 22 23 24 25 26 27 28 29 30 31 32 33 34 35 36 37 38 39 40 41 42 43 44 45 46 47 48 49 50 51 52 53 54 55 56 57 58 59 60 61
residence, indicating that there is a wide variability on the pharmaceuticals 359
administered to patients, even though most belong to the same family. Many of 360
these compounds have been previously identified as most commonly detected 361
in the environment. For instance, metformin has been previously identified as 362
one of the main pharmaceuticals in wastewaters in The Netherlands 363
(Oosterhuis et al. 2013). Similarly, Van Nuijs et al. detected metformin, 364
valsartan and tramadol in sewage water with good correlation with prescribed 365
values (van Nuijs et al. 2015). 366
367
Prioritization of pharmaceuticals for further treatment and risk
368
assessment
369
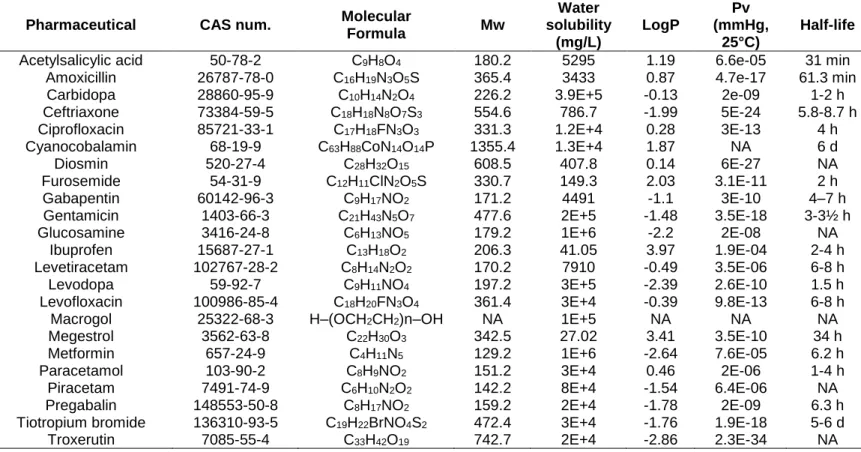
Table 3 gives the physico-chemical characteristics of the prioritized 370
pharmaceuticals according to PECriv. Most of them have high solubility and low 371
logP, indicating that preferentially they will remain in water. Even though 372
pharmaceuticals can be degraded in water (Carlsson et al. 2006), their 373
continuous discharge, even at low concentrations, make these drugs 374
recalcitrant and environmentally hazardous compounds. Because of the lack of 375
a legislation that controls the levels of drug residues in discharges and in 376
surface waters, is important to prioritize actions that minimize the impact of 377
these pollutants on the environment. Thus, the theoretical evaluation of 378
presence and risk can provide a new and simple to use tool to predict their 379
presence in the environment so that remediation technologies can be 380
implemented. These tools can be extrapolated to other areas with similar 381
problems (e.g. kindergartens, hospitals, etc.). 382
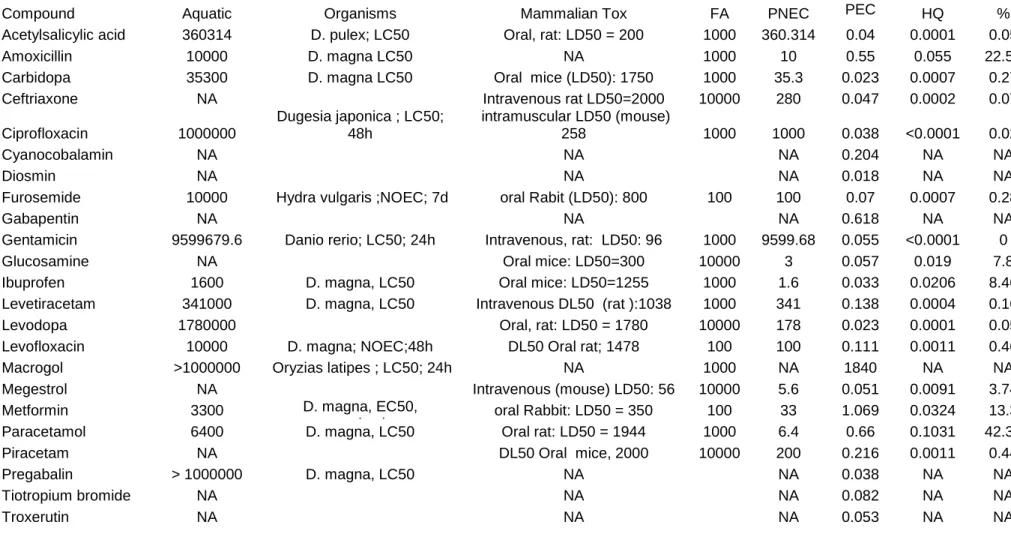
For the 23 prioritized compounds, we determined the aquatic toxicity using 383
different organisms according to available data from the open bibliography 384
(Table 4). Using this data and the maximum PECriv, the risk quotients were 385
calculated. Table 4 includes aquatic and mammalian toxicological information 386
and estimated PNECs and environmental hazards of the pharmaceutical most 387
used in the SUDOE regions. From the 23 selected substances eight did not 388
have toxicological information. From the remaining 16 environmental hazards 389
ranged from 5 x 10⁻⁵ of gentamicin to 0.1 of paracetamol. The combined 390
hazards of these 16 substances was 0.22, which is rather close to 1, the 391 1 2 3 4 5 6 7 8 9 10 11 12 13 14 15 16 17 18 19 20 21 22 23 24 25 26 27 28 29 30 31 32 33 34 35 36 37 38 39 40 41 42 43 44 45 46 47 48 49 50 51 52 53 54 55 56 57 58 59 60 61
benchmark for severe risk. From the 16 studied substances 6 of them amoxilin, 392
glucosamide, ibuprofen, metformin, paracetamol and megestrol accounted for 393
98% of risks. Note, however, that environmental hazards for glucosamide and 394
megestrol were estimated from toxicity data reported on mammalian species, 395
whose dosage was administered quite different (oral or injected) than that of 396
aquatic organisms, thus for these two compounds there is more uncertainty 397
than for the rest. 398
When evaluating the environmental risks of pharmaceuticals consumed in 399
Sweden, it was concluded there the risk for acute toxic effects with the current 400
active pharmaceuticals was unlikely but highlight the lack of chronic ecotoxicity 401
data for a correct evaluation of risk (Carlsson et al. 2006). 402
Main risk compounds were analgesic and antipyretic drugs such as 403
paracetamol, ibuprofen, metamizole and acetylcysteine, antibiotics such as 404
amoxicillin and sulfamethoxazole, gabapentin and valproic acid for the 405
treatment of epilepsy and neuropathic pain, sedative and hypnotic compounds 406
such as clomethiazole and pharmaceuticals for the treatment of diabetes 407
(metformin). However, it has been pointed out that there is a very little known 408
information about long term effects of pharmaceuticals to aquatic organisms, in 409
particular with respect to biological targets (Fent et al. 2006). 410
411
Risk management
412
The new "Urban Water Agenda 2030", addressed at the Leeuwarden 413
Conference (02.2016), incorporates concerns about wastewater treatment by 414
focusing on emerging contaminants to contribute to the achievement of the 415
good chemical status of water bodies. The main objective is to prevent pollution 416
of water by cities and to ensure the quality of water for urban use. 417
In this study we have identified senior residences as a point source pollution of 418
pharmaceuticals to the environment. The number of homes for elderly people is 419
currently high and is expected to increase in the future. This is alarming 420
because these establishments are a considerable source of emerging pollutants 421
and, hitherto, there are no guidelines or information about the risk management 422
of effluents, which are typically classified as domestic. Nonetheless, the World 423 1 2 3 4 5 6 7 8 9 10 11 12 13 14 15 16 17 18 19 20 21 22 23 24 25 26 27 28 29 30 31 32 33 34 35 36 37 38 39 40 41 42 43 44 45 46 47 48 49 50 51 52 53 54 55 56 57 58 59 60 61
Health Organization (Chartier 2014), alerts that although a large part of the 424
wastewater from health-care facilities can be considered domestic (because 425
they pose the same risks as domestic wastewater), depending on the service 426
and tasks of the facility, these wastewaters might pose a higher risk. This is 427
clearly the case for the homes for elderly people, where people consume a high 428
number of pharmaceuticals. Therefore, regulations regarding the direct 429
discharge in surface water and the indirect discharge in a municipal wastewater 430
treatment plant, should consider possible onsite treatment, and water reuse. 431
Onsite treatment could be an effective strategy to manage the risk of 432
pharmaceuticals in the environment at this moment. Prioritization according to 433
PECs would help in the implementation of focused monitoring and remediation 434
technologies that consider only the most toxic compounds, which would ensure 435
the effectiveness in the control and risk assessment of pharmaceuticals. A 436
future avenue for this area would be to conduct cost-benefit analysis and 437
economic and sociological studies to know the viability of this strategy. 438
Risk management is a complex issue because it involves many and different 439
types of stakeholders, such as environmental and health authorities, the 440
pharmaceutical sector, water and waste industries, health practitioners, 441
researchers, and elderly home managers and clients, as well as the general 442
public. It must be ensured that environmental, social and economic objectives 443
for risk management are clear and established early in the process, and that 444
these are achieved. To facilitate this process, risk assessment and risk 445
management should be integrated activities and should share a common 446
requirement that is effective risk communication (Naidu et al. 2016). 447
A challenging issue in communicating the risks associated with pharmaceutical 448
residues in wastewater is the unfamiliar nature of the concept, and that presents 449
particular challenges to the risk communication strategy. The pharmaceutical 450
residues in water can be considered emerging pollutants and, as could be 451
expected, so can be the risks posed by these. These risks can be described as 452
emerging risks, due to the fact that the evidence of the negative effects of the 453
pharmacological pollution of water is relatively recent, sometimes controversial, 454
and in part unknown (García-Santiago et al. 2016, Touraud et al. 2011). It is 455
thus predictable that the familiarity with these risks should be particularly low. 456 1 2 3 4 5 6 7 8 9 10 11 12 13 14 15 16 17 18 19 20 21 22 23 24 25 26 27 28 29 30 31 32 33 34 35 36 37 38 39 40 41 42 43 44 45 46 47 48 49 50 51 52 53 54 55 56 57 58 59 60 61
For these reasons, related knowledge, attitudes and social representations 457
have yet to be established. Social sciences approaches to risk perception of 458
emerging risks suggests that, given such constraints, stakeholder’s responses 459
on these topics are not pre-established, but will be constructed (Pidgeon et al. 460
2011). This elaboration process starts in the inquiries about the topic, when the 461
persons are for the first time confronted with these risks and they have to create 462
an interpretation to deal with them (Lichtenstein &Slovic 2006) and are also 463
influenced by the cultural and social dispositions people (Kahan 2009). For this 464
reason, the key aspects of risk communication that are important to develop 465
and maintain trust and “active transparency” in the case of risk and benefits of 466
pharmaceuticals (namely openness through frequent dialogues, decisions 467
based on the best available science, transparency, timeliness and 468
responsiveness, should be taken into consideration about this topic (Bouder 469
2011). Furthermore, campaigns to increase risk awareness should be initiated 470
before any alarm episode (Barnett &Breakwell 2003) or crisis (Gaspar et al. 471
2015). Otherwise, such episodes will dramatically influence the way society, in 472
general, and stakeholders, in particular, deem about this topic. 473
474
Conclusions
475
We have identified senior residences as a source of pharmaceuticals to surface 476
waters at concentrations higher than 0.01 µg/L, which is the EMEA threshold for 477
risk analysis. Depending on the size of the elderly people’s home, and taking 478
into account the circumstances and medical treatments usually received, 479
wastewaters contain pharmaceuticals in their effluents at concentrations > 10 480
µg/L. Because these effluents are discharged to sewage grids and WWTP are 481
mostly inefficient to eliminate pharmaceuticals, residues are discharged to river 482
waters, thus contributing to water pollution. This effect, amplified by the large 483
number of residences in the south west Europe, indicates the importance of 484
controlling the discharges of pharmaceuticals form senior residences to 485
minimize the impact on aquatic ecosystems. A protocol scheme and risk 486
management actions foreseen should be used to implement focused monitoring 487
and remediation technologies that consider the most toxic compounds to ensure 488
effectiveness in the control and evaluation of the impact of pharmaceuticals. 489 1 2 3 4 5 6 7 8 9 10 11 12 13 14 15 16 17 18 19 20 21 22 23 24 25 26 27 28 29 30 31 32 33 34 35 36 37 38 39 40 41 42 43 44 45 46 47 48 49 50 51 52 53 54 55 56 57 58 59 60 61
490 491
Acknowledgements
492
This study has been financed by the SUDOE program with the project 493
Innovec’Eau (2016-2019) / Project SOE1/P1/F0173 Interreg SUDOE funded by 494
FEDER: 1.177.875,64 €; http://innovec-eau.univ-perp.fr. We would like to 495
acknowledge the associated partners of project: Syndicat National des 496
Établissements et Résidences Privés pour Personnes Âgées (SYNERPA), Sant 497
Joan de Deu (SJD), Llars d’Avis de Catalunya (L’Onada), and Santa Casa da 498
Misericórdia de Lisboa (SCML), in particular Filomena Gerardo and Sónia 499
Pereira da Silva. We would also like to thank the personnel from the elderly 500
homes from the elderly are acknowledged for their assistance and guidance 501
and for providing consumption data of pharmaceuticals. Silvia Sachetti and 502
Emanuella Scudellaro, Erasmus students from the University Federico II in 503
Naples are gratefully thanked for their advice on the toxicity of pharmaceuticals. 504 1 2 3 4 5 6 7 8 9 10 11 12 13 14 15 16 17 18 19 20 21 22 23 24 25 26 27 28 29 30 31 32 33 34 35 36 37 38 39 40 41 42 43 44 45 46 47 48 49 50 51 52 53 54 55 56 57 58 59 60 61
Table 1. Number of pharmaceuticals administered in 2015. 505 Residence Size Mixed facility type Water consumption (m3/year) Pharmaceuticals administered Compounds consumed at doses > 1000 mg/d Beds Day center F1 75 6 Housing and general impairment 4560 133 Metformin S1 100 30 Housing, general impairment psychiatric unit 6679 164 Macrogol Metformin Paracetamol Gabapentin Amoxicillin Cyanocobalamine (vitB12) Levetiracetam Alcaphor Levofloxacine S2 130 0 Housing, general impairment 7100 134 Macrogol Metformine Levetiracetam Gabapentin P1 52 0 Housing, general impairment 5230 116 Metformin Tiotropium bromide P2 61 0 Housing, general impairment 4859 146 Macrogol Metformin Piracetam Levetiracetam 506 1 2 3 4 5 6 7 8 9 10 11 12 13 14 15 16 17 18 19 20 21 22 23 24 25 26 27 28 29 30 31 32 33 34 35 36 37 38 39 40 41 42 43 44 45 46 47 48 49 50 51 52 53 54 55 56 57 58 59 60 61
Table 2. Compounds prioritized in each residence according to consumption 507
data, PECres > 10 µg/L and PECriv > 0.01 µg/L. 508 Pharmaceutical Consumption (mg/day) PEC res (µg/L), 50% of diapers PEC res (µg/L), with 10% DF PEC river (µg/L) Residence F1 Metformin 1569 157 16 0.203 Paracetamol 545 55 5.4 0.071 Levetiracetam 540 54 5.4 0.076 Dabigatran etexilate 167 17 1.7 0.002 Amoxicillin 162 16 1.6 0.021 Residence S1 Macrogol 581336 12213 1221 46.20 Metformin 13449 283 28 1.070 Paracetamol 8316 175 17 0.662 Gabapentin 7781 163 16 0.619 Amoxicillin 6928 146 15 0.551 Cyanocobalamine 2515 52.8 5.3 0.204 Levetiracetam 1635 34.3 3.4 0.130 Alcaphor 1414 29.7 3.0 0.007 Levofloxacine 1397 29.4 2.9 0.111 Megestrol 909 19.1 1.9 0.052 Furosemide 890 18.7 1.9 0.070 Gentamycine 699 14.7 1.5 0.056 Ceftriaxone 592 12.4 1.2 0.047 Ibuprofen 575 12.1 1.2 0.033 Acetylsalicylique 556 11.7 1.2 0.044 Pregabalin 490 10.3 1.0 0.039 Ciprofloxacine 477 10.0 1.0 0.038 Troxerutin 477 10.0 1.0 0.038 Residence S2 Macrogol 57729 1213 121 4.590 Metformine 6367 134 13.4 0.506 Levetiracetam 1740 36.6 3.7 0.138 Gabapentin 1200 25.2 2.5 0.095 Paracetamol 846 17.8 1.8 0.067 Furosemide 672 14.1 1.4 0.053 Troxerutin 671 14.1 1.4 0.053 Residence P1 Metformin 10823 378 37.8 0.610 Tiotropium bromide 1480 51.6 5.2 0.083 Levetiracetam 663 23.1 2.3 0.037 Glucosamine 639 22.3 2.2 0.036 Paracetamol 449 15.7 1.6 0.025 Levodopa 410 14.3 1.4 0.023 Acetylsalicylic acid 377 13.2 1.3 0.021 Carbidopa 308 10.7 1.1 0.017 Gabapentin 300 10.5 1.0 0.017 Residence P2 Macrogol 13125 164 16.4 0.26 Metformin 4177 157 15.7 0.25 Piracetam 3600 135 13.5 0.22 Levetiracetam 1061 39.8 4.0 0.064 Glucosamine 959 36.0 3.6 0.058 Paracetamol 880 33.1 3.3 0.053 Gabapentin 500 18.8 1.9 0.030 Pregabalin 417 15.6 1.6 0.025 Diosmin 315 11.8 1.2 0.019 Furosemide 280 10.5 1.1 0.017 1 2 3 4 5 6 7 8 9 10 11 12 13 14 15 16 17 18 19 20 21 22 23 24 25 26 27 28 29 30 31 32 33 34 35 36 37 38 39 40 41 42 43 44 45 46 47 48 49 50 51 52 53 54 55 56 57 58 59 60 61
Table 3. Physico-chemical properties of prioritized pharmaceuticals according to PEC data. 509
Pharmaceutical CAS num. Molecular
Formula Mw Water solubility (mg/L) LogP Pv (mmHg, 25°C) Half-life
Acetylsalicylic acid 50-78-2 C9H8O4 180.2 5295 1.19 6.6e-05 31 min
Amoxicillin 26787-78-0 C16H19N3O5S 365.4 3433 0.87 4.7e-17 61.3 min
Carbidopa 28860-95-9 C10H14N2O4 226.2 3.9E+5 -0.13 2e-09 1-2 h
Ceftriaxone 73384-59-5 C18H18N8O7S3 554.6 786.7 -1.99 5E-24 5.8-8.7 h
Ciprofloxacin 85721-33-1 C17H18FN3O3 331.3 1.2E+4 0.28 3E-13 4 h
Cyanocobalamin 68-19-9 C63H88CoN14O14P 1355.4 1.3E+4 1.87 NA 6 d
Diosmin 520-27-4 C28H32O15 608.5 407.8 0.14 6E-27 NA
Furosemide 54-31-9 C12H11ClN2O5S 330.7 149.3 2.03 3.1E-11 2 h
Gabapentin 60142-96-3 C9H17NO2 171.2 4491 -1.1 3E-10 4–7 h
Gentamicin 1403-66-3 C21H43N5O7 477.6 2E+5 -1.48 3.5E-18 3-3½ h
Glucosamine 3416-24-8 C6H13NO5 179.2 1E+6 -2.2 2E-08 NA
Ibuprofen 15687-27-1 C13H18O2 206.3 41.05 3.97 1.9E-04 2-4 h
Levetiracetam 102767-28-2 C8H14N2O2 170.2 7910 -0.49 3.5E-06 6-8 h
Levodopa 59-92-7 C9H11NO4 197.2 3E+5 -2.39 2.6E-10 1.5 h
Levofloxacin 100986-85-4 C18H20FN3O4 361.4 3E+4 -0.39 9.8E-13 6-8 h
Macrogol 25322-68-3 H–(OCH2CH2)n–OH NA 1E+5 NA NA NA
Megestrol 3562-63-8 C22H30O3 342.5 27.02 3.41 3.5E-10 34 h
Metformin 657-24-9 C4H11N5 129.2 1E+6 -2.64 7.6E-05 6.2 h
Paracetamol 103-90-2 C8H9NO2 151.2 3E+4 0.46 2E-06 1-4 h
Piracetam 7491-74-9 C6H10N2O2 142.2 8E+4 -1.54 6.4E-06 NA
Pregabalin 148553-50-8 C8H17NO2 159.2 2E+4 -1.78 2E-09 6.3 h
Tiotropium bromide 136310-93-5 C19H22BrNO4S2 472.4 3E+4 -1.76 1.9E-18 5-6 d
Troxerutin 7085-55-4 C33H42O19 742.7 2E+4 -2.86 2.3E-34 NA
510 1 2 3 4 5 6 7 8 9 10 11 12 13 14 15 16 17 18 19 20 21 22 23 24 25 26 27 28 29 30 31 32 33 34 35 36 37 38 39 40 41 42 43 44 45 46 47 48 49 50 51 52 53 54 55 56 57 58 59 60 61
511
Table 4. Reported aquatic (Aquatox µg/L) and mammalian( mg/kg) toxicological information for the 23 selected compunds, 512
estimated Predicted No environmental concentration (PNEC, µg/L), hazard quotiont (HQ), % contribution to the total hazard of each 513
compound (%). FA, application factor. PEC max, maximal predicted environmenta concentration (µg/L). NA, no data. 514
Compound Aquatic Organisms Mammalian Tox FA PNEC PEC
max HQ % Acetylsalicylic acid 360314 D. pulex; LC50 Oral, rat: LD50 = 200 1000 360.314 0.04 0.0001 0.05 Amoxicillin 10000 D. magna LC50 NA 1000 10 0.55 0.055 22.58 Carbidopa 35300 D. magna LC50 Oral mice (LD50): 1750 1000 35.3 0.023 0.0007 0.27 Ceftriaxone NA Intravenous rat LD50=2000 10000 280 0.047 0.0002 0.07 Ciprofloxacin 1000000 Dugesia japonica ; LC50; 48h intramuscular LD50 (mouse) 258 1000 1000 0.038 <0.0001 0.02 Cyanocobalamin NA NA NA 0.204 NA NA Diosmin NA NA NA 0.018 NA NA
Furosemide 10000 Hydra vulgaris ;NOEC; 7d oral Rabit (LD50): 800 100 100 0.07 0.0007 0.28
Gabapentin NA NA NA 0.618 NA NA
Gentamicin 9599679.6 Danio rerio; LC50; 24h Intravenous, rat: LD50: 96 1000 9599.68 0.055 <0.0001 0 Glucosamine NA Oral mice: LD50=300 10000 3 0.057 0.019 7.8 Ibuprofen 1600 D. magna, LC50 Oral mice: LD50=1255 1000 1.6 0.033 0.0206 8.46 Levetiracetam 341000 D. magna, LC50 Intravenous DL50 (rat ):1038 1000 341 0.138 0.0004 0.16 Levodopa 1780000 Oral, rat: LD50 = 1780 10000 178 0.023 0.0001 0.05 Levofloxacin 10000 D. magna; NOEC;48h DL50 Oral rat; 1478 100 100 0.111 0.0011 0.46 Macrogol >1000000 Oryzias latipes ; LC50; 24h NA 1000 NA 1840 NA NA Megestrol NA Intravenous (mouse) LD50: 56 10000 5.6 0.051 0.0091 3.74 Metformin 3300 D. magna, EC50,
reproduction oral Rabbit: LD50 = 350 100 33 1.069 0.0324 13.3 Paracetamol 6400 D. magna, LC50 Oral rat: LD50 = 1944 1000 6.4 0.66 0.1031 42.33 Piracetam NA DL50 Oral mice, 2000 10000 200 0.216 0.0011 0.44 Pregabalin > 1000000 D. magna, LC50 NA NA 0.038 NA NA Tiotropium bromide NA NA NA 0.082 NA NA Troxerutin NA NA NA 0.053 NA NA 1 2 3 4 5 6 7 8 9 10 11 12 13 14 15 16 17 18 19 20 21 22 23 24 25 26 27 28 29 30 31 32 33 34 35 36 37 38 39 40 41 42 43 44 45 46 47 48 49 50 51 52 53 54 55 56 57 58 59 60 61
Figure 1. Cycle of pharmaceuticals from their release in seniors’ residences to 515
the river, with all the process that play a role in their transport and fate. 516 517 518 519 1 2 3 4 5 6 7 8 9 10 11 12 13 14 15 16 17 18 19 20 21 22 23 24 25 26 27 28 29 30 31 32 33 34 35 36 37 38 39 40 41 42 43 44 45 46 47 48 49 50 51 52 53 54 55 56 57 58 59 60 61
Figure 2. Workflow designed to prioritize pharmaceutical of environmental 520
concern for which risk assessment and remediation actions. 521 522 523 524 1 2 3 4 5 6 7 8 9 10 11 12 13 14 15 16 17 18 19 20 21 22 23 24 25 26 27 28 29 30 31 32 33 34 35 36 37 38 39 40 41 42 43 44 45 46 47 48 49 50 51 52 53 54 55 56 57 58 59 60 61
Figure 3. Total daily consumption of pharmaceuticals in each residence, 525
indicating the number of residents (N) and the families consumed in each 526
establishemnt (pie diagrams). 527 528 529 530 1 2 3 4 5 6 7 8 9 10 11 12 13 14 15 16 17 18 19 20 21 22 23 24 25 26 27 28 29 30 31 32 33 34 35 36 37 38 39 40 41 42 43 44 45 46 47 48 49 50 51 52 53 54 55 56 57 58 59 60 61
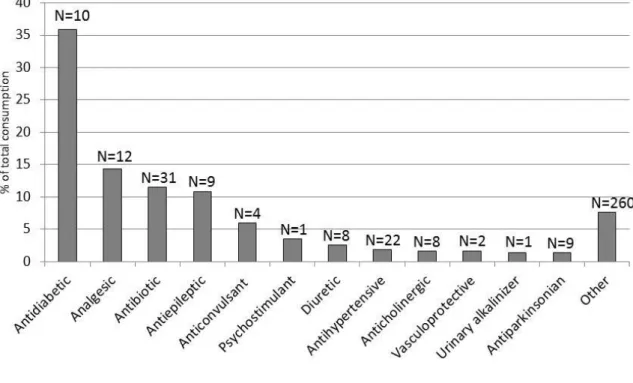
Figure 4. Families of pharmaceuticals (in percentage) most widely consumed in 531
residences from southwest Europe (France, Spain and Portugal). N indicates 532
the number of pharmaceuticals dispensed for each family. Macrogol (laxative) is 533
not represented as its consumption ranges from 13 to 580 g/d which would 534
represent 86% of the total pharmaceuticals consumed. 535 536 537 538 539 1 2 3 4 5 6 7 8 9 10 11 12 13 14 15 16 17 18 19 20 21 22 23 24 25 26 27 28 29 30 31 32 33 34 35 36 37 38 39 40 41 42 43 44 45 46 47 48 49 50 51 52 53 54 55 56 57 58 59 60 61
Figure 5. PECres (grey, left axis) and PECriv (light grey, right axis) in each 540
country (F1=France, S1 and S2, Spain and P1 and P2, Portugal). This 541
represents a decrease in % of more than 99%. 542 543 544 545 0,00 0,05 0,10 0,15 0,20 0,25 0 20 40 60 80 100 120 140 160 180
Metformin Paracetamol Levetiracetam Dabigatran etexilate Amoxicillin PEC ri v (µ g /L ) PEC res (µ g /L ) 0 0,2 0,4 0,6 0,8 1 1,2 1,4 0 50 100 150 200 250 300 350 PEC ri v (µ g /L ) PEC res (µ g /L ) 0 0,1 0,2 0,3 0,4 0,5 0,6 0,7 0 20 40 60 80 100 120 140 160 PEC ri v (µ g /L ) PEC res (µ g /L ) 0 0,02 0,04 0,06 0,08 0,1 0,12 0,14 0 10 20 30 40 50 60 70 80 PEC ri v (µ g /L ) PEC res (µ g /L ) 0 0,05 0,1 0,15 0,2 0,25 0,3 0 20 40 60 80 100 120 140 160 180 PEC ri v (µ g /L ) PEC res (µ g /L ) F1 S1 S2 P1 P2 1 2 3 4 5 6 7 8 9 10 11 12 13 14 15 16 17 18 19 20 21 22 23 24 25 26 27 28 29 30 31 32 33 34 35 36 37 38 39 40 41 42 43 44 45 46 47 48 49 50 51 52 53 54 55 56 57 58 59 60 61
References
546 547
Al-Khazrajy OSA, Boxall ABA (2016) Risk-based prioritization of pharmaceuticals in 548
the natural environment in Iraq. Environ. Sci. Pollut. Res. 23: 15712-15726 549
Banjac Z, Ginebreda A, Kuzmanovic M, Marcé R, Nadal M, Riera JM, Barceló D 550
(2015) Emission factor estimation of ca. 160 emerging organic 551
microcontaminants by inverse modeling in a Mediterranean river basin 552
(Llobregat, NE Spain). Sci. Total Environ. 520: 241-252 553
Barnett J, Breakwell GM (2003) The social amplification of risk and the hazard 554
sequence: The October 1995 oral contraceptive pill scare. Health, risk & society 555
5: 301-313 556
Besse JP, Kausch-Barreto C, Garric J (2008) Exposure assessment of pharmaceuticals 557
and their metabolites in the aquatic environment: Application to the French 558
situation and preliminary prioritization. Human and Ecological Risk Assessment 559
14: 665-695 560
Booker V, Halsall C, Llewellyn N, Johnson A, Williams R (2014) Prioritising 561
anticancer drugs for environmental monitoring and risk assessment purposes. 562
Sci. Total Environ. 473-474: 159-170 563
Bouder F (2011) Benefit/Risk Communication by the European Medicines Agency: a 564
Study of influential Stakeholders' Expectations and Attitudes. 565
Carlsson C, Johansson AK, Alvan G, Bergman K, Kühler T (2006) Are pharmaceuticals 566
potent environmental pollutants?. Part I: Environmental risk assessments of 567
selected active pharmaceutical ingredients. Sci. Total Environ. 364: 67-87 568
Chartier Y (2014): Safe management of wastes from health-care activities. World 569
Health Organization 570
Donnachie RL, Johnson AC, Sumpter JP (2016) A rational approach to selecting and 571
ranking some pharmaceuticals of concern for the aquatic environment and their 572
relative importance compared with other chemicals. Environ. Toxicol. Chem. 573
35: 1021-1027 574
EPA US (2013) Exposure Assessment Tools and Models. EPI Suite v4.1. 2013: 575
https://www.epa.gov/tsca-screening-tools/epi-suitetm-estimation-program-576
interface
577
European Medicines Agency (EMEA) (2006) EMEA/CHMP/SWP/4447/00 578
http://www.ema.europa.eu/docs/en_GB/document_library/Scientific_guideline/2
579
009/10/WC500003978.pdf
580
Fent K, Weston AA, Caminada D (2006) Ecotoxicology of human pharmaceuticals. 581
Aquat. Toxicol. 76: 122-159 582
Fick J, Lindberg RH, Tysklind M, Larsson DGJ (2010) Predicted critical environmental 583
concentrations for 500 pharmaceuticals. Regul. Toxicol. Pharmacol. 58: 516-523 584
Franquet-Griell H, Gómez-Canela C, Ventura F, Lacorte S (2015) Predicting 585
concentrations of cytostatic drugs in sewage effluents and surface waters of 586
Catalonia (NE Spain). Environ. Res. 138: 161-172 587
García-Santiago X, Franco-Uría A, Omil F, Lema JM (2016) Risk assessment of 588
persistent pharmaceuticals in biosolids: dealing with uncertainty. J. Hazard. 589
Mater. 302: 72-81 590
Gaspar R, Barnett J, Seibt B (2015) Crisis as seen by the individual: the Norm 591
Deviation Approach/La crisis vista por el individuo: el Enfoque de la Desviación 592 de la Norma. Psyecology 6: 103-135 593 1 2 3 4 5 6 7 8 9 10 11 12 13 14 15 16 17 18 19 20 21 22 23 24 25 26 27 28 29 30 31 32 33 34 35 36 37 38 39 40 41 42 43 44 45 46 47 48 49 50 51 52 53 54 55 56 57 58 59 60 61
Gómez-Canela C, Cortés-Francisco N, Oliva X, Pujol C, Ventura F, Lacorte S, Caixach 594
J (2012) Occurrence of cyclophosphamide and epirubicin in wastewaters by 595
direct injection analysis-liquid chromatography-high-resolution mass 596
spectrometry. Environ. Sci. Pollut. Res. 19: 3210-3218 597
Gómez-Canela C, Ventura F, Caixach J, Lacorte S (2014) Occurrence of cytostatic 598
compounds in hospital effluents and wastewaters, determined by liquid 599
chromatography coupled to high-resolution mass spectrometry. Anal. Bioanal. 600
Chem. 406: 3801-3814 601
Kahan DM (2009) Nanotechnology and society: The evolution of risk perceptions. 602
Nature Nanotechnology 4: 705-706 603
Keller VDJ, Williams RJ, Lofthouse C, Johnson AC (2014) Worldwide estimation of 604
river concentrations of any chemical originating from sewage-treatment plants 605
using dilution factors. Environ. Toxicol. Chem. 33: 447-452 606
Kümmerer K, Al-Ahmad A (2010) Estimation of the cancer risk to humans resulting 607
from the presence of cyclophosphamide and ifosfamide in surface water. 608
Environ. Sci. Pollut. Res. 17: 486-496 609
Langford KH, Thomas KV (2009) Determination of pharmaceutical compounds in 610
hospital effluents and their contribution to wastewater treatment works. Environ. 611
Int. 35: 766-770 612
Lichtenstein S, Slovic P (2006): The construction of preference. Cambridge University 613
Press 614
Naidu R, Espana VAA, Liu Y, Jit J (2016) Emerging contaminants in the environment: 615
Risk-based analysis for better management. Chemosphere 154: 350-357 616
Oldenkamp R, Huijbregts MAJ, Hollander A, Versporten A, Goossens H, Ragas AMJ 617
(2013) Spatially explicit prioritization of human antibiotics and antineoplastics 618
in Europe. Environ. Int. 51: 13-26 619
Oosterhuis M, Sacher F, ter Laak TL (2013) Prediction of concentration levels of 620
metformin and other high consumption pharmaceuticals in wastewater and 621
regional surface water based on sales data. Sci. Total Environ. 442: 380-388 622
Ortiz de García S, Pinto Pinto G, García Encina P, Irusta Mata R (2013) Consumption 623
and occurrence of pharmaceutical and personal care products in the aquatic 624
environment in Spain. Sci. Total Environ. 444: 451-465 625
Pidgeon N, Harthorn B, Satterfield T (2011) Nanotechnology risk perceptions and 626
communication: emerging technologies, emerging challenges. Risk Analysis 31: 627
1694-1700 628
Rabiet M, Togola A, Brissaud F, Seidel JL, Budzinski H, Elbaz-Poulichet F (2006) 629
Consequences of treated water recycling as regards pharmaceuticals and drugs in 630
surface and ground waters of a medium-sized mediterranean catchment. 631
Environ. Sci. Technol. 40: 5282-5288 632
Riva F, Zuccato E, Castiglioni S (2015) Prioritization and analysis of pharmaceuticals 633
for human use contaminating the aquatic ecosystem in Italy. J. Pharm. Biomed. 634
Anal. 106: 71-78 635
Santos LHMLM, Gros M, Rodriguez-Mozaz S, Delerue-Matos C, Pena A, Barceló D, 636
Montenegro MCBSM (2013) Contribution of hospital effluents to the load of 637
pharmaceuticals in urban wastewaters: Identification of ecologically relevant 638
pharmaceuticals. Sci. Total Environ. 461-462: 302-316 639
Touraud E, Roig B, Sumpter JP, Coetsier C (2011) Drug residues and endocrine 640
disruptors in drinking water: risk for humans? International journal of hygiene 641
and environmental health 214: 437-441 642 1 2 3 4 5 6 7 8 9 10 11 12 13 14 15 16 17 18 19 20 21 22 23 24 25 26 27 28 29 30 31 32 33 34 35 36 37 38 39 40 41 42 43 44 45 46 47 48 49 50 51 52 53 54 55 56 57 58 59 60 61
van Leeuwen CJ, Vermeire TG (2007): Risk assessment of chemicals: an introduction. 643
Springer Science & Business Media 644
van Nuijs ALN, Covaci A, Beyers H, Bervoets L, Blust R, Verpooten G, Neels H, 645
Jorens PG (2015) Do concentrations of pharmaceuticals in sewage reflect 646
prescription figures? Environ. Sci. Pollut. Res. 22: 9110-9118 647
Verlicchi P, Galletti A, Petrovic M, Barceló D (2010) Hospital effluents as a source of 648
emerging pollutants: An overview of micropollutants and sustainable treatment 649
options. J. Hydrol. 389: 416-428 650
Verlicchi P, Al Aukidy M, Zambello E (2012) Occurrence of pharmaceutical 651
compounds in urban wastewater: Removal, mass load and environmental risk 652
after a secondary treatment-A review. Sci. Total Environ. 429: 123-155 653
WHO WHO- (2017) ATC/DDD Index 2017. https://www.whocc.no/atc_ddd_index/
654
Zhang J, Chang VWC, Giannis A, Wang JY (2013) Removal of cytostatic drugs from 655
aquatic environment: A review. Sci. Total Environ. 445-446: 281-298 656 657 658 659 660 1 2 3 4 5 6 7 8 9 10 11 12 13 14 15 16 17 18 19 20 21 22 23 24 25 26 27 28 29 30 31 32 33 34 35 36 37 38 39 40 41 42 43 44 45 46 47 48 49 50 51 52 53 54 55 56 57 58 59 60 61
Supplementary Material