Effects of water stress on Alnus glutinosa populations
across the species distribution range
S.M Lovely Akther
Dissertation to obtain a Master’s Degree in
Mediterranean Forestry and Natural Resources Management
(MEDfOR)
Supervisors: Dr. Patricia María Rodríguez-González (ISA)
Dr. Teresa Soares David (INIAV)
Jury:
President: Doutor José Guilherme Martins Dias Calvão Borges, Professor Associado com Agregação do Instituto Superior de Agronomia da Universidade de Lisboa. Members: Doutor Filipe Miguel de Carvalho Costa e Silva, Professor Auxiliar do Instituto
Superior de Agronomia da Universidade de Lisboa;
PhD Patricia María Rodríguez-González, Investigadora Auxiliar do Instituto Superior de Agronomia da Universidade de Lisboa.
2
Acknowledgements
At first, I express my profound gratitude to the Almighty God (Allah) for his unconditional blessings and strength bestowed upon me. The journey of MEDfOR (master program) wouldn't have been successful without the benevolence of the European Commission's scholarship through the MEDfOR secretariat which elated me to complete this study. I am grateful to the Portuguese Foundation for Science and Technology for funding of experiments though project ALNUS PTDC/ASP-SIL/28593/2017: Screening Alnus glutinosa resistance to an emerging disease under climatic stressors: predicting alder forests resilience across river networks.
I am particularly beholden to the kind supervision from Prof. Dr. Patricia Rodríguez-González at Instituto Superior de Agronomia (ISA), the University of Lisbon, Portugal. Her constructive criticism and encouragement contributed widely to the quality of research I conducted, and I am exclusively indebted to her continued support in all stages of this study. I would also like to express my sincere gratitude and deep respect to my thesis co-supervisor Dr. Teresa Soares David (INIAV) who has been sharing her valuable ideas since the formulation of thesis plan up to writing.
I am grateful to Dr. Ana Rodrigues, ISA, University of Lisbon who supported, provided guidance and helped to collect some data and processing of some specific data.
I am also grateful to Dr. Felipe Costa E Silva for sharing valuable ideas about establishment of the experiment and Dr. Carla Faria the responsible for the Nursery, who has made available space and conditions, and provided resources and orientation based on large experience, during the experiments. Most exceptional thanks to Inês Marques for providing guidance on data collection, help to collect some data and for the clarification of some ideas and concepts.
A very special thanks to Cristina Vieites Blanco for supporting me to collect some data and sharing ideas for data analysis.
Also, a very special thanks to Rui Matias and Joaquim Mendes (“Quim”) helped for the transplantation and to prepared the tubes for the initial experiment with substrates.
Furthermore, I express my deepest sense of gratefulness to my family members for their love and continuous mental support.
3
Abstract
Alnus glutinosa (Black alder) is paramount species in the riparian ecosystem for supporting ecosystem
functioning and the services it provides. This species is declining in an alarming rate which is a prominent threat to devastate native priority forests across Europe, so understanding population responses to environmental change is key for its proper management. In this study, we characterized vegetative phenology and investigated morphological, structural and physiological responses to imposed drought across five populations from countries ranging the species distribution limits (Sweden, Italy, Spain, Portugal, and Morocco). First, we registered 5 stages of budburst of the 120 seedlings of alder (24 by population) in open space. Then, we established a greenhouse experiment where we imposed progressive (Field capacity-FC, 75%FC, 50%FC and 25%FC) water stress (17.06.2019 to 01.08.2019) on 40 seedlings (S), keeping 40 at field capacity, as control until the end of experiment (CE). During 45 days, we performed physiological and morphological measurement at different percentages of FC to compare treatments and populations. Destructive harvest was performed on 40 seedlings (from the total 120) at the onset of the experiment (CO), and then, at the end of the experiment control (CE) and stress (S) seedlings were also destroyed to analyze the structural and functional responses of alder among CE, S and CO and also to compare the variations among populations. We found significant differences among populations on the number of days to reach each phenological stage where northern populations displayed delayed budburst than the southern. As a result of imposed drought, growth and development of A. glutinosa was generally reduced under water restrictions compared to control plants, yet none of the parameters reflected severe plant stress. Conversely, we observed that several of the studied parameters were significantly different among the studied populations likely reflecting intraspecific diversity and environmental conditions.
Key words: Alnus glutinosa, field capacity, imposed drought, latitudinal gradient, physiological and
structural parameters.
Resumo
O amieiro (Alnus glutinosa) é uma espécie chave nos ecossistemas ribeirinhos a nível do seu funcionamento e dos serviços ecológicos. Esta espécie está a diminuir a um ritmo alarmante, o que constitui uma ameaça importante para as florestas nativas de toda a Europa, pelo que é fundamental compreender as respostas das suas populações às alterações ambientais para uma gestão adequada. Neste estudo, caracterizou-se a fenologia vegetativa e estudaram-se as respostas morfológicas, estruturais e fisiológicas à seca imposta em cinco populações de amieiro originárias de países qu e abrangem os limites de distribuição da espécie (Suécia, Itália, Espanha, Portugal e Marrocos). Registaram-se os estágios de abrolhamento das 120 plântulas de amieiro (24 por população) disponíveis para um ensaio em estufa. Plântulas com cerca de 1 ano de idade foram sujeitas a stress hídrico progressivo (capacidade de campo - FC, 75%FC, 50%FC e 25%FC) num total de 80, 40 plântulas (S)
4 40 (CE) mantidas até ao fim do ensaio à capacidade de campo. Durante 45 dias foram realizadas medições fisiológicas e morfológicas em diferentes percentagens de FC para comparar tratamentos e populações. Uma amostragem destrutiva foi realizada em 40 plântulas (do total de 120) no início do experimento (CO) e, no fim do experimento, nas plântulas controlo (CE) e stress (S) para análise das respostas estruturais e funcionais do amieiro entre tratamentos (CO, CE, S) e também entre populações. Encontraram-se diferenças significativas entre populações no número de dias para atingir cada estágio fenológico, onde as populações setentrionais apresentaram atraso no abrolhamento relativamente às meridionais. Como resultado das restrições hídricas impostas, o crescimento e desenvolvimento da A.
glutinosa foi geralmente reduzido nas plantas (S) relativamente às plantas controlo, embora nenhum
dos parâmetros estudados tivesse refletido níveis stress severo. Observaram-se diferenças significativas entre as populações estudadas provavelmente refletindo, quer a diversidade intraespecífica da espécie, quer as condições ambientais dos locais de origem.
Palavras-chave: Alnus glutinosa, capacidade de campo, espécies ribeirinhas, gradiente latitudinal,
parâmetros fisiológicos e estruturais.
Resumo Alargado
As alterações climáticas e ambientais projetadas são consideradas uma das principais ameaças às florestas ribeirinhas. O amieiro (Alnus glutinosa) é uma das espécies ribeirinhas mais importantes do ponto de vista ecológico, estando naturalmente disseminada por toda a Europa, desde o centro da Escandinávia até à região Mediterrânica e também ao norte de Marrocos. O declínio da A. glutinosa é uma ameaça emergente que tem vindo a devastar as florestas nativas prioritárias em toda a Europa, com repercussões alarmantes. Esta espécie é conhecida por desenvolver importantes funções ecológicas nos ecossistemas ribeirinhos e nas zonas húmidas. Nomeadamente, o amieiro têm a capacidade de fixação de azoto atmosférico, atuando a sua folhada como importante suporte das cadeias tróficas nos sistemas fluviais, promove a estabilização do solo, contribui para melhorar a qualidade da água e proporciona um importante corredor de dispersão e habitat para a flora e a fauna, contribuindo para a biodiversidade. No entanto, apesar da sua relevância, subsistem ainda importantes lacunas de conhecimento sobre esta espécie em relação às suas respostas face às alterações ambientais, sobre tudo climáticas e hidrológicas. Considerando o elevado valor ecológico e de conservação, o aumento da fragilidade da A. glutinosa e o estado das florestas que ocupa esta espécie, é urgente um conhecimento adicional sobre a resposta estrutural e fisiológica do amieiro ao stress hídrico ao longo da área de distribuição da espécie. Neste estudo, investigou-se a variabilidade da resposta do amieiro à seca imposta em cinco populações de amieiro originais de países abrangendo os limites de distribuição da espécie (Suécia, Itália, Espanha, Portugal e Marrocos). Caracterizou-se também a fenologia vegetativa e a variação das respostas morfológicas, estruturais e fisiológicas das cinco populações de A. glutinosa. Além disso,
analisaram-5 se as diferenças de crescimento de A. glutinosa entre populações com diferentes origens geográficas e a resposta a restrições hídricas progressivamente impostas.
Primeiramente, registaram-se os estágios de abrolhamento das 120 plântulas de amieiro (24 plântulas por população). Depois, estabeleceu-se um ensaio em estufa onde se impôs stress hídrico progressivo (capacidade de campo - FC, 75% FC, 50% FC e 25% FC) em 40 plântulas (S), mantendo 40 em capacidade de campo, como controlo até o fim do experimento (CE).
Para caracterizar a fenologia vegetativa das plântulas de amieiro de um ano de idade, procedeu-se à observação periódica do abrolhamento, durante quatro meses (06.02.2019 a 06.05.2019) enquanto as plântulas estavam em bandejas de crescimento em espaço aberto. Iniciaram-se as observações quando todos os gomos estavam ainda fechados, e foi registado o número de dias necessário para atingir cinco classes fenológicas, nas 120 plântulas das cinco populações estudadas; Suécia, Pisa (Itália), Furelos (Espanha), Torgal (Portugal) e Marrocos. Após a expansão de todas as folhas, as plântulas foram transplantadas (27.05.19) da bandeja de crescimento para os vasos maiores que tinham um volume três vezes maior do que esta bandeja e depois colocadas (12.06.2019) na estufa do Viveiro Florestal do Instituto Superior de Agronomia para impor um stress hídrico progressivo.
O ensaio de stress hídrico progressivo foi iniciado em 17.06.19. Das 120 plântulas do ensaio, 40 plântulas (8 por população), foram submetidas a seca progressiva (S) enquanto as 40 plântulas restantes foram mantidas bem regadas, como controlo, até o fim do ensaio (CE). Quarenta plântulas adicionais (do total de 120) foram mantidas bem regadas e destruídas no início do ensaio (CO) para caracterizar as populações em relação aos parâmetros estruturais. Estes parâmetros estruturais incluíram a avaliação da massa seca total e sua partição em biomassa aérea (folhas, raminhos, caule) e subterrânea (raízes), área foliar específica (SLA), comprimento e área de raizes, teor relativo em água das folhas (RWC) e área total da folha. Após os 45 dias do ensaio de seca imposta, os parâmetros estruturais também foram avaliados nas restantes 80 plântulas, ou seja as 40 controlo (CE) e as 40 submetidas a tratamento de stress hídrico (S). A seca progressiva foi imposta pela redução das quantidades de irrigação relativamente à Capacidade de Campo (FC) para chegar a atingir 25% da capacidade de campo (100% = FC, 75% FC, 50% FC e 25% FC) ao longo dos 45 dias em que decorreu o ensaio. No primeiro dia do ensaio (17.06.2019), as 80 plântulas (CE, e S) estavam à capacidade de campo. Nesse momento foram medidos os seguintes parâmetros morfológicos e fisiológicos: altura inicial da planta (cm), diâmetro inicial do caule (mm), comprimento inicial da folha (mm), largura inicial da folha (mm), fluorescência da clorofila e fluorescência da clorofila utilizando o medidor portátil, SPAD (Soil and Plant Analysis
Development). Por meio da aplicação de técnicas de Termografia, também foi avaliada a temperatura
da copa (Tc, ºC), e o Crop Water Stress Index (CWSI). Estes parâmetros também foram medidos para as outras 40 plântulas que foram reservadas para a colheita destrutiva no início do ensaio (CO) no mesmo dia. Alguns parâmetros fisiológicos e morfológicos (comprimento e largura da folha (mm), fluorescência da clorofila, SPAD, CWSI, Tc (ºC), foram medidos em todos os estágios da FC (FC a 25%). A taxa de transpiração (mmol m-2 s-1) das plântulas também foi registrada em todo o período de
6 tratamento, a partir da pesagem dos vasos utilizando como referência o peso do vaso à capacidade de campo, e mantendo uma certa periodicidade de medição para as plantas de controlo e stress.
Em termos de fenologia vegetativa, neste estudo observaram-se diferenças significativas entre as populações no número de dias para atingir cada estágio do abrolhamento. Estas observações de abrolhamento vegetativo sugerem que a população de amieiros das de maior latitude (Suécia, Itália) abrolham mais tarde em relação as populações originárias de regiões de menor latitude, nomeadamente Marrocos.
Relativamente à caraterização das populações estudadas, evidenciou-se um padrão geográfico nas diferenças nas características morfológicas e estruturais entre as populações de amieiros. Por um lado, a uma escala espacial mais alargada, as condições climáticas da área geográfica (precipitação, altitude) parecem influenciar as diferenças registadas nas características estruturais. Por outro lado, as caraterísticas ambientais à escala local (tipo de ecossistema, ripário ou paul, assim como a duração do hidroperiodo) parecem estar associadas ao facto das plantas da população italiana ter apresentado os valores de altura inicial mais elevados de todas as populações estudadas.
Como resultado da seca imposta, o crescimento e desenvolvimento da A. glutinosa foi geralmente reduzido sob restrições de água em comparação com as plantas controlo, embora nenhum dos parâmetros estudado tivesse refletido stress severo nas plantas. A ausência de stress moderado ou severo após o tratamento da seca progressivamente imposta pode ter resultado de (a) uma limitada duração do tratamento da seca, uma vez que, no final da experiência, com seca imposta correspondente a 25% da capacidade do campo, os valores de fluorescência da clorofila, SPAD, CWSI, Tc sugeriram que o stress moderado estava a começar; (b) das condições dentro da estufa, nomeadamente a elevada humidade relativa durante a noite que nunca diminuiu abaixo de 75%. Isto pode ter permitido que as plântulas absorvessem humidade do ar, reduzindo o efeito do stress imposto pelas restrições na dotação de água ao solo, pois a A. glutinosa é conhecida por ter a capacidade de absorver água da atmosfera através das folhas.
Por outro lado, observou-se que vários dos parâmetros analisados foram significativamente diferentes entre as populações estudadas, provavelmente refletindo, quer a diversidade intraespecífica da espécie, quer as condições ambientais dos locais de origem.
7 Table of Contents Abstract ... 3 Resumo ... 3 Resumo Alargado ... 4 1. Introduction... 11 2. Research Objectives ... 13 2.1 Specific Objectives ... 13
3. Materials and Methods ... 13
3.1 Research Framework ... 13
3.2 Geographic distribution of the sampled populations ... 14
3.3 Seed germination and plant establishment ... 15
3.4 Phenological observations: budburst timing ... 16
3.5 Drought Imposed experiment ... 17
3.6 Destructive harvest ... 20
3.7 Data processing and analysis ... 21
4. Results ... 21
4.1 Phenological responses ... 21
4.2 Morphological and structural traits of A. glutinosa among populations ... 22
4.3 Physiological and structural responses during and at the end of the drought-Imposed treatment of A glutinosa ... 26
4.4 Destructive analysis to investigate the functional and structural responses of A. glutinosa among 3 treatments and five studied populations ... 38
5. Discussion ... 47
8 List of Figures
Figure- 1: Thesis workflow
Figure- 2: Spatial distribution of the five Alnus glutinosa populations analyzed in this study. Figure- 3: Vegetative bud bursting stage scales observed in this study.
Figure- 4: Alnus glutinosa seedlings subjected to imposed drought
Figure 5: Time (number of days), needed to reach phenological stages (class 2, 3, 4 and 5) in the 5 studied populations
Figure 6: Initial Height (cm) of A. glutinosa seedlings from the five studied populations. Figure 7: Initial Diameter (mm) of A. glutinosa seedlings from the five studied populations Figure 8 Initial Leaf Length (mm) of A. glutinosa seedlings from the five studied populations Figure 9: Initial Leaf Width (mm) of A. glutinosa seedlings from the five studied populations
Figure 10: Ratio between Initial Leaf length and Initial leaf width of A. glutinosa seedlings from the five studied populations
Figure 11: Specific Leaf Area (SLA) at CO (control, at the onset of the experiment) in A. glutinosa seedlings from the five studied populations.
Figure 12: Differences in Height Increment (cm) between control (CE) and stress (S) treatments of the 5 studied populations
Figure 13: - Differences in Diameter Increment (mm) between control (CE) and stress (S) treatments of the 5 studied populations
Figure 14: Differences in Leaf length (LL, mm) Increment between control (CE) and stress (S) treatments of the 5 studied populations.
Figure 15: Differences in Leaf Width (LW, mm) Increment between control (CE) and stress (S) treatments of the 5 studied populations.
Figure 16: Mean values of Fluorescence in control (CE) and stress (S) treatments at different percentages of Field capacity in the 5 studied populations
Figure 17: SPAD values observed in control (CE) and stress (S) treatments at different percentages of Field capacity in the 5 studied populations
Figure 18: Crop Water Stress Index observed in control (CE) and stress (S) plants at different percentages of Field Capacity in the 5 studied populations
Figure 19: Canopy Temperature (Tc,ºC) observed in control (CE) and stress (S) plants at 25% of Field Capacity (i.e., at the end of the experiment) in the five studied populations
Figure 20: Crop Water Stress Index (CWSI) observed in control (CE) and stress (S) plants at 25% of Field Capacity in the 5 studied populations
Figure 21: Variation in Mean diurnal transpiration rate (mmol m-2 s-1) in control (CE) and stress (S) plants, along the experiment, from the 5 studied populations, and average daytime temperature (ºC) and Relative Humidity (RH%) along with the days of the experiment.
9 Figure 22: Relative Water Content (RWC %) values observed at the onset of the experiment in control plants (CO), at the end of the experiment in control (CE) and stress plants in the five studied populations Figure 23: Specific Leaf Area values (SLA, mm²mg-1) observed at the onset of the experiment in control plants (CO), at the end of the experiment in control (CE) and stress (S) plants in the 5 studied populations Figure 24: Total Plant dry mass ( g) observed in control plants at the onset of the experiment (CO), at the end of the experiment in control (CE) and stress (S) plants in the 5 studied populations
Figure 25: Ratio between Belowground and Aboveground dry biomass observed at the onset of the experiment in control plants (CO), at the end of the experiment in control (CE) and stress plants (S) in the 5 studied populations
Figure 26: Total Leaf Area (mm2) observed at the onset of the experiment in control plants (CO), at the
end of the experiment in control (CE) and stress (S) plants in the 5 studied populations
Figure 27: Root Area (cm2) observed at the onset of the experiment in control plants (CO), at the end of
the experiment in control (CE) and stress (S) plants in the 5 studied populations
Figure 29: Root Length (cm) observed at the onset of the experiment in control plants (CO), at the end of the experiment in control (CE) and stress (S) plants in the 5 studied populations
Figure 29: Predawn leaf water potential (Plwp, MPa) of stress plants from the 5 studied populations
List of Tables
Table 1: Geographical and environmental data of the populations used in this study
Table 2: Date when phenological observations were done and Number of days (referred to 1st of January 2019) to reach a specific stage
Table 3: Measurement day (0-15) along with the exact measurement date and transpiration period at different Field capacity (FC-25%).
Table 4: Initial Height (cm), Initial diameter (mm), Initial Leaf Length (mm), Initial Leaf Width (mm), SLA (mm2 mg-1) and the ratio of Leaf Length and Leaf With at the onset of the experiment (CO) of A.
glutinosa seedlings from five different populations
Table 5: Values of Initial Height (cm), Initial Diameter (mm), Leaf Width Increment (mm), Leaf Length Increment (mm), Diameter Increment and Height Increment (mm), Transpiration rate (mmol m-2 s-1),
Fluorescence and SPAD values, Tc (°C) and CWSI for control (CE) and water-stress treatment (S), among the 5 studied populations.
Table 6: Variation in Height Increment (cm), Leaf Length (mm), Leaf Width (mm), Fluorescence and SPAD of seedlings in the control (CE) and water stress (S) treatments, among 5 different populations Table 7: RWC (%), Belowground dry biomass (g), Aboveground dry biomass (g), Total Plant dry mass (g), ratio of below and aboveground biomass, Specific Leaf Area (mm²/mg), total leaf area (mm²), root area (cm²) and root length (cm) at the onset of the treatment (day 0), and at the end in control and stress plants from 5 Alnus glutinosa populations
10 List of Abbreviations
CWSI: Crop Water Stress Index RWC: Relative Water Content SLA: Specific Leaf Area
11
1. Introduction
Climate and current environmental changes are the most prominent threats to the world (Elferts, 2014). Projected climate and rapid environmental changes in the Mediterranean basin and European forests show both a rainfall decrease and an increased atmospheric evaporative demand, particularly during winter and summer seasons (Ruíz-Sinoga et al., 2011). These projected changes might exacerbate the negative impacts of water scarcity reducing forest growth and endangering the supply of ecosystem services (Neary et al., 2009; Otero et al., 2011). These effects are already happening because of the increasing severity of climate change. Therefore, understanding the adaptive responses of tree species is quite important to reduce the negative impacts on plant production and forest sustainability (Zhang
et al., 2019).
Mediterranean riparian forests are natural refuges for tree species from boreal and temperate origins (Sanz et al., 2011). These forests are expected to be very sensitive to water scarcity because most of the dominant species are located in the driest border of their bioclimatic distribution, and trees might experience fast and strong changes in water availability regimes during their lifetime. Due to the dependency of the species on permanent access to water, riparian forests dominated by black alder are expected to be very sensitive to water scarcity, notably populations located in the driest border of their distribution.
Alnus glutinosa (L.) Gaertn. (black alder) is an important keystone species naturally widespread across
all of Europe, from mid-Scandinavia to the Mediterranean region and also northern Morocco (Claessens
et al., 2010). It plays a key role on riverine ecosystems, due to the ecological functioning and the
ecosystem services provided. This species contributes to biodiversity of riverscapes by providing important dispersal corridors and habitat for the flora and fauna, both the tree itself and the flooded root system. It helps to stabilize the soil and to protect the riverbanks (Rodríguez-González et al., 2014), contributing to the filtration of chemicals and other pollutants, and thus to water purification (Claessens
et al., 2010). This species can also fix atmospheric nitrogen (N2) in the roots through symbiosis with
the actinomycete Frankia (Huss-Danell, 1997). This characteristic plays an important role in ecosystems as alder leaf litter constitute a major component of the trophic chain in riparian systems (Lecerf and Chauvet, 2008). Alnus glutinosa is also the dominant species in the priority habitat 91E0*, classified under European Habitat Directive 92/43/CEE. The species plays also an important role as a forestry species (for example, for jetties and underwater supports, bridge piles and small boats, to produce high quality charcoal and materials suitable for biomass production) (Claessens et al., 2010: Klaassen and Creemers, 2012). In spite of their importance, Alnus glutinosa populations are now declining due to harsh climatic conditions, hydrological changes in water level, regulation of water courses and due to an unprecedented number of fungal and fungal like diseases (Bjelke et al., 2016). The decline of alder already caused huge ecological damages to the riparian ecosystem (EEA, 2012: Pielech and Malicki, 2018).
12 Water stress is one of the primary abiotic threats to plant growth around the world, especially for the riparian species. Alnus glutinosa, as a riparian species, is considered to be relatively intolerant to drought, which limits its establishment and suitability under low soil moisture availability. Permanent or temporary drought events can hamper the growth and development of this species (Hennessey, 1985; Herbst et al., 1999), strongly related to the degree of water stress (soil moisture availability and climatic conditions) and on the morphological and structural responses to water stress (Seiler, 1984).
Although some studies have already been published on the effect of water stress on Alnus glutinosa, especially compared with other species (Eschenbach and Kappen, 1999; Poole et al., 2000; Fricke et
al., 2014; Graca and Poquet, 2014), substantial knowledge gaps still remain on A glutinosa intraspecific
variability in the response to different levels of water stress. Notably, considering the high ecological and conservation value, the increased fragility of A. glutinosa species and the conservation status of the forests they occupy, additional knowledge is urgently required on the structural and physiological response of black alder to water stress along the species distributional range. Alnus glutinosa populations occur along a wide latitudinal range which provides a great opportunity for studying potential differences in its functional responses (De Frenne et al., 2013). For instance, the study with the structural and physiological responses to drought or limited water, among populations that came from different geographical areas may allow selecting proper populations for better management decision making. Indeed, understanding forest populations and their genetic diversity have important conservation implications as they influence the whole ecosystem (Whitham et al., 2006).
In this study we have focused on the physiological and structural responses of the riparian species Alnus
glutinosa based on reliable and quantitative parameters as indicators of the species structure and
function to investigate the effects of water stress. For this purpose, we imposed drought to potted seedlings by progressively reducing the percentage of water corresponding to field capacity. The studied populations range the species distributional range-span, from Mediterranean basin to the north of Europe.
13
2. Research objectives
The objective of this study is to investigate the variability in alder response to imposed drought across five populations ranging the species distribution limits.
Specific objectives:
This study is specifically thought to:
1. Characterize the vegetative phenology and the variation in morphological, structural, and physiological responses of wide-ranging Alnus glutinosa populations.
2. Advance knowledge on how different geographical populations influence Alnus glutinosa growth and response to progressively imposed water restrictions.
3. Materials and Methods 3.1 Research Framework
The study was carried out in a stepwise approach, beginning from data collection through to discussion of results, as shown in Fig. 1 below, with pragmatic effort to achieve the intended study/research objectives.
Fig. 1- Thesis workflow
Discussion Results Literature Review
Thesis workflow
Phenological data
Count bud burst time
Different time periods to reach each class
among different populations
On Treatment Physiological data
Progressive water stress and control treatment
2 ways ANOVA with SPSS and boxplot to identify specific responses
Different responsses in different treatments and populations Structural and functionaldata Destructive harvest Different responsses in different treatments and populations
M
e
th
od
s
14
3.2 Geographic distribution of the studied populations
Figure 2 shows the countries of origin and the spatial distribution of Alnus glutinosa populations considered in this study: Sweden (SD), Italy (PI), Spain (FU), Portugal (TO) and Morocco (MA).
Fig. 2- Spatial distribution of the five Alnus glutinosa populations analyzed in this study.
Table: 1
Geographical and environmental data of the populations analyzed in this study. Site Elevation (masl) is the mean from all sampled trees and the coordinates (WGS84) are from the mid-point in the samples transect.
Mean annual climatic data rainfall (P) (mm), mean(Tmean) maximum (Tmax) and minimum (Tmin) temperatures (ºC)) were obtained from the nearest 0.5°×0.5° grid point in the Climate Research Unit’s global gridded database (CRU TS3.10) for the 1986-2016 period (CRU, Harris et al., 2014).
15 Populati on Countr y Latitude (º N) Longitud e (º) Eleva tion (masl ) Hydro graphi c basin Type of ecosyst em Tmea n (ºC) Tma x (ºC) Tmi n (ºC) P (mm) FU
(Furelos) Spain 42.8685 -8.0082 349.7 Ulla
riparian
11.5 16.9 6.8 1222.1
TO
(Torgal) Portugal 37.6368 -8.6201 22.6 Mira riparian 17.3 20.3 11.7 664.6
PI (Pisa) Italy 43.7366 10.3104 6.9 Ano wetland 15.8 19.9 11.8 964.8
SD Sweden 59.8216 17.6685 10.2 Fyris riparian 6.6 10.5 2.7 534.5
MA Morocc o 35.1798 -5.3744 1000. 0 Oued Lekbir riparian 15.7 20.6 10.8 597.4
3.3 Seed germination and plant establishment
Seedlings of Alnus glutinosa used in this study were germinated 1 year before the beginning of this study under an ongoing PhD project. Seeds from five populations shown in Figure 2, ranging the extremes of A. glutinosa latitudinal distribution, were germinated.
Seedlings were germinated in growing trays (pull-out type) with 25 cells of 300 mL each, at an area located in a greenhouse with a cooling system (to maintain temperature below 26ºC) and an automatic watering system by fog (30 seconds of nebulization every hour). A substrate composed of 1/3 sand and 2/3 peat was used. Each cell received 3 to 4 seeds to increase the probability that in each container at least one seedling would grow. The germination was organized in randomized blocks of 40 individuals. Randomization was done by using Excel software where each block contained single replicate of the mother trees and populations. If more than one seed germinated in the cell, later a selection was done to leave only 1 seedling per cell. Seed sowing was done between the 5th and the 12th of April 2018 by Inês Marques and Carla Faria, at the greenhouse of the Instituto Superior de Agronomia (ISA) nursery. Within each block containing 40 seedlings, containers were randomized and a printed diagram was used as a guide to check periodically the random relative position of the plants. After 4 months since germination, the seedlings were grown in an open space of the ISA nursery where watering was provided every morning. Then, one-year old seedlings were transplanted to larger pots (22 cm high and 9 cm x 9 cm wide on top, three times the volume of the containers where the seedlings were produced) to increase the space available for root growth as well as the aerial space between seedlings (to prevent excessive shading of the lower shoots). The potting mix consisted of peat and sand (2:1). Transplantation was performed on 27-05-2019 and seedlings were kept in the open space of ISA nursery. On 12-06-2019 the seedlings were transferred to the ISA greenhouse where they stayed for acclimatization during six days before the drought imposed experiment started (see section 3.5)
16
3.4. Phenological observations: budburst timing
Prior to the beginning of the drought-imposed experiment phenological observations were carried out when the seedlings were still growing in trays and all buds were closed (6th of February 2019). We
aimed to assess the timing of vegetative budburst of the 5 studied populations in 120 seedlings (24 per population) and the differences among populations. Phenological records were taken for each seedling according to a common method described in Santini (2004). The observations were done twice a week until complete emergence of the leaves by following a five stage scale (1 = dormant buds; 2 = buds swollen, but scales closed; 3 = bud scales open and extremities of the first leaf visible at the apex of the buds; 4 = extremities of all leaves visible; 5 = two or more leaves completely spread out) (Santini, 2004). Observations started when most of the seedlings reached the 2nd stage of the scale (buds swollen, but
scales closed) and finished when all of the seedlings reached stage scale five (06-05-2019).
Fig. 3- Vegetative bud bursting stage scales 2 ( buds swollen, but scales closed), 3 (bud scales open and extremities of the first leaf visible at the apex of the buds), 4 (extremities of all leaves visible) and 5 (two or more leaves completely spread out) observed in this study
To calculate the number of days to reach budburst in each class we fixed a reference date - 1st of January 2019 (Day of Year 1). This means that if one seedling reached the stage 2 (i.e,. buds swollen, but scales closed) at the 6th of February, it took 37 days to reach stage 2.
17 Table: 2
Date when phenological observations were done and Number of days (referred to 1st of January 2019)
to reach a specific stage.
Observation date (day.month.year) Number of days from 01.01.2019 06.02.2019 37 11.02.2019 42 26.02.2019 57 01.03.2019 59 06.03.2019 65 11.03.2019 70 19.03.2019 78 22.03.2019 81 27.03.2019 86 01.04.2019 91 08.04.2019 98 12.04.2019 102 17.04.2019 107 21.04.2019 111 02.05.2019 122 06.05.2019 126
3.5 Drought Imposed experiment
A drought imposed experiment was done at the greenhouse of ISA nursery from 17.06.2019 to 01.08.2019, during 45 days: i) to determine the level and periodicity of irrigation required by Alnus glutinosa seedlings; and ii) to evaluate structural and physiological responses of five Alnus glutinosa populations ranging the species distribution limits. A total of 120 one-year-old alder seedlings (24 seedlings per population) from Furelos (Fu, Spain), Torgal (TO, Portugal), Pisa (PI, Italy), Sweden (SD) and Morocco (MA), were analyzed.
18 Fig. 4- Alnus glutinosa seedlings subjected to imposed drought: CO (control, well-watered plants at onset of the experiment), CE (control treatment, well-watered plants till the end of the experiment), and S (water stress treatment).
The water stress treatment was applied to 40 seedlings (8 per population) while the remaining 40 seedlings were maintained well-watered at field capacity until the end of the experiment (control, CE). Forty additional seedlings (from the total 120) were maintained well-watered and destroyed at the onset of the experiment (control, CO) to characterize the populations in relation to structural parameters: Total dry mass (leaves, branches, main stems and roots) and its partition into aboveground and belowground parts, specific leaf area (SLA = one-sided area of a fresh leaf /oven-dry mass), root length and root area, relative water content (RWC) and total leaf area were evaluated. At the end of the drought experiment, structural parameters were also evaluated on 80 seedlings from the control (CE) and water stress treatments (S). Progressive drought was imposed by reducing irrigation amounts from Field Capacity (FC) to 25% of Field Capacity (100%=FC, 75% FC, 50% FC and 25% FC) along 45 days. Each pot was wrapped in aluminum paper (see Figure- 4) tied to the stem to prevent soil evaporation (Silva, 2004).
Before starting the experiment, the substrate of 5 pots was completely dried (48 hours at 60°C) and pot weight was recorded. The substrate was then fully saturated and pot weight at field capacity was recorded to obtain the difference between pot weight at field capacity and dry pot weight. This allowed knowing the amount of water needed to reach field capacity. After knowing this value, the amount of water corresponding to 75%, 50% and 25% of field capacity was calculated.
In the first day of the experiment (day 0- 17.06.2019), the 80 seedlings were at field capacity. At this stage morphological and physiological parameter were measured: plant initial height (cm), stem initial diameter (mm), initial leaf length (mm), initial leaf width (mm), chlorophyll fluorescence and Soil and
CE
S
19 Plant Analysis Development (SPAD). By applying thermal imaging technique, canopy temperature (Tc) and Crop Water Stress Index (CWSI) were also determined. Chlorophyll fluorescence and SPAD value have been measured by using FluorPen FP100; Photon Systems Instruments and SPAD-502; Minolta Corp respectively. CWSI was obtained (CWSI= (Tdry- Tc)/ (Tdry- Twet), where Tdry is dry reference temperature (°C), Tc is canopy temperature (°C) and Twet is wet reference temperature (°C )) according to Gómez-Bellot (2015). These parameters were also measured in other 40 plants that were kept for destructive harvest at onset of the experiment (CO) in the same day. The same measurement (height, diameter, leaf length and width, fluorescence, SPAD, CWSI and Tc had also been taken at 04.07.2019, 15.07.2019 and 22.07.2019 at different FC to investigate the increment of Diameter (mm), Height increment , Leaf length increment , Leaf width increment and also to investigate how was the value of SPAD, Tc and CWSI and Fluorescence at different level of FC .
From the next day onwards pot weight of the control seedlings was measured prior to watering and maintained at field capacity. Pots subject to water stress treatment were weighted to register the water loss and to check if they had reached the weight corresponding to 75% field capacity. After reaching this level, the seedlings were kept five days at this value and the same physiological measurements were done to know the differences in seedling response between two periods. Afterwards the seedlings were kept until 50% of field capacity was reached. This same procedure was repeated up to 25% of field capacity. Transpiration rate (mmol m-2 s-1) of each seedling, under control and stress conditions was calculated as the difference between pot weight (g) between successive days under the same moisture conditions, divided by the number of daylight hours per plant (Silva, 2004). Transpiration rate was then converted into mmol m-2 s-1 (gram converted to mmol, and hour converted to seconds and this is considered as per m2 of leaf area instead of per plant. Daily air temperature (ºC) and air relative humidity
(%) were also recorded by using EasyLog USB device from 24.06.2019 to 22.07.2019. (Table 3). Measurement day (0) is the day from when the experiment has started that is (17.06.19) and day 1 and the other following days until 15 represents the time period between 2 measurements. Due to logistic reasons, the control plants (CE) were in the treatment until day 11(22.07.2019), after that destructive harvest was done. The stress plants were until day 15 (01.08.2019) because in day 13 (26.07.2019) they have reached 25% FC and after reaching 25% FC the seedlings kept five more days in this condition in the green house afterwards they also have been harvested (01.08.2019) to study the structural responses. Along the whole period, the daylight hours were considered (excluding night period) to calculate the transpiration rate. For temperature and relative humidity values the same period has been taken into account.
20 Table: 3
Measurement day (0-15) along with the exact measurement date and transpiration period at different Field capacity (FC-25%). Measurement day FC (%) Transpiration period (Day.month.year) Measurement date 0 FC 17.06.2019 17.06.2019 1 17.06.2019-21.06.2019 21.06.2019 2 21.06.2019-24.06.2019 24.06.2019 3 24.06.2019-26.06.2019 26.06.2019 4 26.06.2019-28.06.2019 28.06.2019 5 28.06.2019-01.07.2019 01.07.2019 6 75 01.07.2019-04.07.2019 04.07.2019 7 04.07.2019-08.07.2019 08.07.2019 8 08.07.2019-12.07.2019 12.07.2019 9 50 12.07.2019-15.07.2019 15.07.2019 10 15.07.2019-18.07.2019 18.07.2019 11 18.07.2019-22.07.2019 22.07.2019 12 22.07.2019-24.07.2019 24.07.2019 13 25 24.07.2019-26.07.2019 26.07.2019 14 26.07.2019-29.07.2019 29.07.2019 15 29.07.2019-01.08.2019 01.08.2019 3.6 Destructive harvesting
Destructive harvest of seedlings was done at the onset (40 seedlings) and at end (80 seedlings) of the imposed drought experiment to evaluate structural and functional traits. In total, 120 seedlings were analyzed, 40 under control at the onset of the experiment (CO), 40 under control at end of the experiment (CE) and 40 seedlings subjected to water-stress (S). The following parameters were measured: Specific Leaf Area (SLA, mm2mg-1) calculated as the ratio between leaf area and leaf dry mass; Total plant dry mass (g) determined after oven-drying the plant for 72 h at 65°C; Root length (cm), projected root area (cm2) and total leaf area (mm2). Roots and leaves were scanned and the area and length of the roots were
calculated with WinRHIZO 2003b and the leaf area was calculated with WinSEEDLE Pro 2008a. Relative Water Content (RWC, %) of leaves was calculated as RWC (%) = 100*(FM - DM)/(SM - DM) where FM is leaf fresh mass at the time of collection, SM is leaf mass at saturated condition, and DM is leaf dry mass (Tumer, 1981); belowground/aboveground dry biomass ratio (sum of seedling dry weight of leaves, shoots and secondary branches divided by dry weight of roots).
21
3.7 Data processing and Analysis
The primary data collected in the nursery was compiled in a Microsoft Excel workbook and cleaned to poise and assure the quality of the data was uncompromised
Data were subjected to two-way analysis of variance (ANOVA) to test if there is an interaction of treatments and population with studied structural and physiological parameters, box plots also have been prepared to compare the results, using SPSS statistical application 25.
4. Results
In this study we found the vegetative bud bursting timing of the studied populations, Morphological and structural traits, Physiological and structural parameters during and at the end of the drought-imposed treatment and the structural parameters after destructive analysis, morphological, structural and physiological parameters among seedlings of five Alnus glutinosa populations spanning the species distribution range.
To understand the interaction of treatments and population on studied the structural and physiological parameters, the mean values and standard deviation (SD) of all parameters represents in the format of tables by 2-way ANOVA test. To indicate the variation among populations and between treatments of all parameter’s graphs have been prepared as boxplot format. The boxplot upper whiskers represent the maximum values, the line that divides the box represents the median values of the data and the lower part of whiskers represents the minimum values. For the comparison of boxplots, median values have been considered.
4.1 Phenological responses
Phenological observations were done for 3 months (06-02-2019 to 06-05-2019) from the time all buds were closed to when at least 2 or more leaves were completely spread out.
22
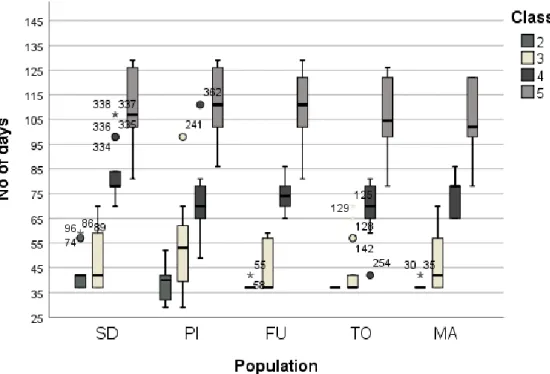
Fig. 5- Time (number of days), needed to reach phenological stages (class 2, 3, 4 and 5) in the 5 studied populations: Sweden (SD), Italy (PI), Spain (Furelos), Portugal (TO) and Morocco (MA).
Furelos, Torgal and Morocco populations reached class 2 by day 37 (when the observation had started). Italy and Sweden populations were delayed at the beginning in relation to southern populations, reaching class 2 by day 39 and day 43, respectively. To reach class 3, Italy population took 53 days that is the highest number of days when compared to other populations. Sweden and Morocco populations took 57 days. To reach class 4, Sweden population took the highest number of days (76), but to reach class 5, Italy population took 110 days, Sweden 107 days and Morocco population took the lowest number of days (101). Seedlings, ordered from southern to northern populations, took in average 27 (Morocco), 30 (Torgal, Portugal), 28 (Furelos, Spain), 20 (PI, Italy) and 34 (Sweden) days, respectively, to reach from stage 3 to stage 4. From the reference date (1st of January) to reach class 5 ,
populations from Sweden and Italy took an average of 112 days and those from Furelos and Torgal took 109 and 107 days respectively.
4.2 Morphological and structural traits of A. glutinosa among populations
In order to characterize the variability among populations, we report the values of Initial Height (cm), Initial diameter (mm), Initial Leaf Length (mm), Initial Leaf Width (mm) and SLA (mm2 mg-1) at the
onset of the experiment (CO) of A. glutinosa seedlings from five different populations (Table 4, Figures 6-11).
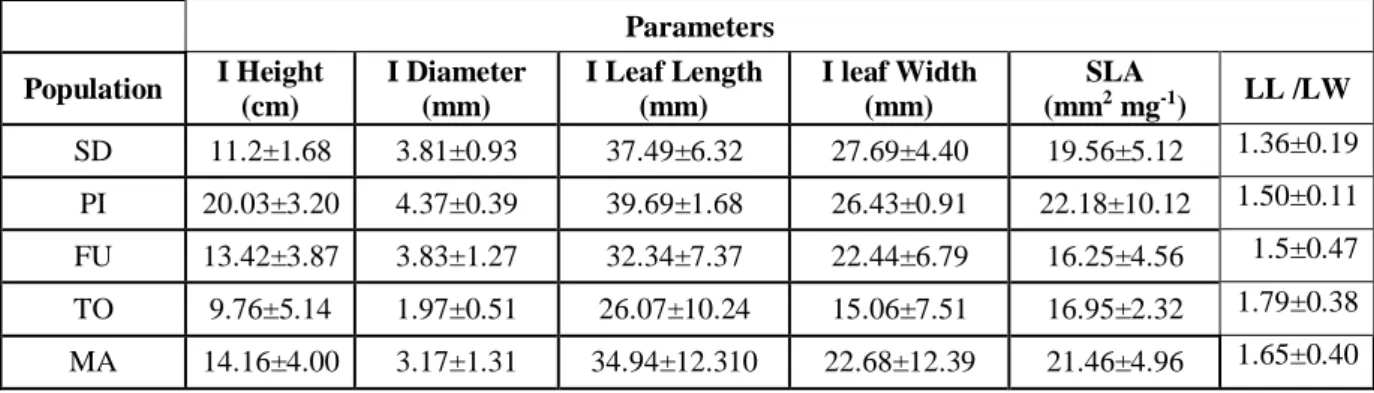
23 Table 4:
Initial Height (cm), Initial diameter (mm), Initial Leaf Length (mm), Initial Leaf Width (mm), SLA (mm2 mg-1) and the ratio of Leaf Length and Leaf With at the onset of the experiment (CO) of A. glutinosa seedlings from five different populations: Sweden (SD), Italy (PI), Spain (Furelos), Portugal
(TO) and Morocco (MA). Data are means ± SD
.
Parameters Population I Height (cm) I Diameter (mm) I Leaf Length (mm) I leaf Width (mm) SLA (mm2 mg-1) LL /LW SD 11.2±1.68 3.81±0.93 37.49±6.32 27.69±4.40 19.56±5.12 1.36±0.19 PI 20.03±3.20 4.37±0.39 39.69±1.68 26.43±0.91 22.18±10.12 1.50±0.11 FU 13.42±3.87 3.83±1.27 32.34±7.37 22.44±6.79 16.25±4.56 1.5±0.47 TO 9.76±5.14 1.97±0.51 26.07±10.24 15.06±7.51 16.95±2.32 1.79±0.38 MA 14.16±4.00 3.17±1.31 34.94±12.310 22.68±12.39 21.46±4.96 1.65±0.40Fig- 6: Initial Height (cm) of A. glutinosa seedlings from the five studied populations: Sweden (SD), Italy (PI), Spain (Furelos), Portugal (TO) and Morocco (MA).
In Fig 6, Italy population had the highest initial height (24 cm) and the Sweden population had the lowest height (12 cm) and the height of both populations had significant different to other populations.
24 Fig. 7 - Initial Diameter (mm) of A. glutinosa seedlings from the five studied populations: Sweden (SD), Italy (PI), Spain (Furelos), Portugal (TO) and Morocco (MA).
In Fig: 7, Italy population had the highest diameter (4.5 mm) and Torgal and Morocco population had the lowest diameter (2.5 mm) and the diameter of Italy population was differed significantly among other populations.
Fig. 8 - Initial Leaf Length (mm) of A. glutinosa seedlings from the five studied populations: Sweden (SD), Italy (PI), Spain (Furelos), Portugal (TO) and Morocco (MA).
In Fig: 8, Italy population had the highest initial leaf length (37 mm) and the leaf length was not differed significantly among populations.
25 Fig. 9 - Initial Leaf Width (mm) of A. glutinosa seedlings from the five studied populations: Sweden (SD), Italy (PI), Spain (Furelos), Portugal (TO) and Morocco (MA).
In Fig: 9 Initial leaf width was not differed significantly among populations.
Fig- 10: Ratio between Initial Leaf length and Initial leaf width of A. glutinosa seedlings from the five studied populations: Sweden (SD), Italy (PI), Spain (Furelos), Portugal (TO) and Morocco (MA).
In Fig: 10, ratio between initial leaf length and initial leaf width was higher in Torgal population (1.50) and the value was not differed significantly among populations.
26 Fig. 11 - Specific Leaf Area (SLA) at CO (control, at the onset of the experiment) in A. glutinosa seedlings from the five studied populations: Sweden (SD), Italy (PI), Spain (Furelos), Portugal (TO) and Morocco (MA).
In Fig; 11, SLA (mm2mg-1) was higher in Morocco population and SLA was not significantly differed
among populations.
4.3 Physiological and structural responses during and at the end of the drought-imposed treatment of A glutinosa
To investigate the difference between water stress treatment (S) and control treatment (CE), and the difference among populations; growth parameters (Height Increment (mm), Diameter Increment (mm), Leaf Width Increment (mm) and Leaf Length Increment (mm)) and physiological parameters (Transpiration rate (mmol m-2 s-1), Fluorescence and SPAD values, CWSI and Tc (°C)) were evaluated from 17.06.2019 to 22.06.2019 in CE seedlings and from 17.06.2019 to 01.08.2019 in S seedlings.
Table 5:
Values of Initial Height (cm), Initial Diameter (mm), Leaf Width Increment (mm), Leaf Length Increment (mm), Diameter Increment and Height Increment (mm), Transpiration rate (mmol m-2 s-1), Fluorescence and SPAD values, Tc (°C) and CWSI for control (CE) and water-stress treatment (S) , among the 5 studied populations . Increment is referred from day 0 (17.06.2019) to day 11 (22.07.2019). Data are means ± SD. Symbols: *, **, *** represent statistical significance at P = 0.05, 0.01 and 0.001, respectively; and ns = nonsignificant at P > 0.05.
27
Significance of 2-way ANOVA Parameters
Control (CE)
Stress
(S) Population Treatment Treatment*population
Initial Height (cm) 15.67±5.61 15.45±4.03 *** ns ns
Initial Diameter (mm) 3.92±1.12 3.93±0.71 *** ns ns
Leaf Width Increment (mm)
8.29±3.23 6.63±2.92 ns ns ns
Leaf Length increment (cm)
8.16±0.72 7.71±.67 ns ns ns
Diameter Increment (mm) 0.25±0.12 0.22±0.11 ns ns ns
Height Increment (cm) 1.37±0.51 0.99±0.34 ** *** ns
Transpiration rate (mmol
m-2 s-1) 5.09±3.32 4.46±2.23 *** ** *** Fluorescence 0.79±0.03 0.78±0.04 *** *** ns SPAD 37.57±4.97 35.01±4.76 ns *** ns Leaf Length (mm) 37.34±9.32 36.70±8.98 *** ns *** Leaf Width (mm) 27.28±7.19 27.86±6.43 ** ns *** Tc (°C) 23.44±1.23 22.61±1.20 *** *** ns CWSI .57±.11 .68±.19 *** *** ns
Initial Height (cm), Initial Diameter (mm), Leaf Length (mm), and Leaf Width (cm), showed significant differences among populations but no significant differences between control and water stress treatments. Mean values of Height Increment and Fluorescence are higher in control (1.37 and 0.79) than in stress (0.99 and 0.78) plants. Height Increment, Fluorescence values, Tc (°C), Transpiration rate (mmol m-2 s-1) and CWSI have significant differences between treatments and also among populations. SPAD values showed significant differences between treatments but not among populations. Transpiration rate, Leaf Length and leaf Width were significantly different in Treatment*population
28 Table: 6
Variation in Height Increment (cm), Leaf Length increment (mm), Leaf Width increment (mm), (from 17.06.2019 to 22.07.2019), Fluorescence and SPAD of seedlings in the control (CE) and water stress (S) treatments, among 5 different populations. Data are means ± SD.
Parameters Treatment
s Populations
Significanc e level
Sweden Italy Furelos Torgal Morocco Population
Height Increment (cm) CE 0.96±.20 1.26±.38 1.47±.37 1.57±.77 1.58±.49 ** S 0.7±.24 1.15±.31 0.96±.32 0.97±.24 1.17±.43 Leaf Length increment (mm) CE 8.83±3.06 6.91±4.66 10.37±3.3 0 8.29±2.01 6.43±2.63 ns S 8.85±1.52 5.81±2.60 8.84±2.84 6.04±1.78 8.99±.71 Leaf Width Increment (mm) CE 7.61±.69 9.71±5.54 10.03±3.7 8 6.42±1.42 7.70±2.55 ns S 9.02±3.66 5.06±1.64 7.54±3.13 5.57±3.20 5.99±2.06 Fluorescenc e CE 0.76±0.06 0.79±0.03 0.81±0.01 0.81±0.01 0.80±0.01 *** S 0.72±0.04 0.78±0.03 0.79±0.02 0.8±0.011 0.79±0.03 SPAD CE 35.84±6.8 7 36.55±5.6 6 39.61±3.7 4 38.40±3.8 5 37.20±3.8 5 ns S 34.18±4.6 2 33.07±5.6 8 34.11±5.1 9 37.64±4.6 6 36.06±1.7 6
Average Height Increment values were generally higher in southern populations. Mean Fluorescence and SPAD values were higher in control than in stress treatment for all populations. Furelos and Torgal populations show the highest Fluorescence values in control plants, and the Swedish population showed the lowest Fluorescence value under stress conditions. The highest SPAD values were observed in the control treatment in the Furelos population and the lowest values were observed in the stress treatment of the Italy population.
29 Fig. 12 - Differences in Height Increment (cm) between control (CE) and stress (S) treatments of the 5 studied populations: Sweden (SD), Italy (PI), Spain (Furelos), Portugal (TO) and Morocco (MA).
Mean Height Increment (cm) was higher for control than stress plants for all populations. Morocco population showed the highest Height Increment in control plants (1.7 cm) that is 88% more than the Sweden population where Sweden population had the lowest Height Increment in control plants (0. 9 cm). Stress plants of Sweden populations also showed the lowest Height Increment values. Sweden, Furelos, Torgal and Morocco populations showed significant differences (p<0.01) in Height Increment in control (CE) and stress (S) plants. The population from Italy did not show any significance difference.
30 Fig. 13 - Differences in Diameter Increment (mm) between control (CE) and stress (S) treatments of the 5 studied populations: Sweden (SD), Italy (PI), Spain (Furelos), Portugal (TO) and Morocco (MA).
Diameter Increment (mm) was similar in control (CE) and stress (S) plants, except in the Furelos population where the difference between control and stress plants was 0.03 mm. Torgal population showed the highest Diameter Increment, both in control and stress plants.
31 Fig. 14 - Differences in Leaf length (LL, mm) Increment between control (CE) and stress (S) treatments of the 5 studied populations: Sweden (SD, Italy (PI), Spain (Furelos), Portugal (TO) and Morocco (MA). Leaf Length Increment (mm) was higher in control than in stress plants for most of the populations except for the Morocco and Sweden one. Torgal and Morocco populations had significantly different values of LL Increment between control and stress plants but in opposite ways. For Morocco population the increment of LL was 21% in stress plants than the control plants. For Torgal population, LL Increment increased 30% in control plants. The highest Leaf Length Increment was observed in the control treatment of the Furelos population (12.5mm) but it was not significantly different between control and stress plants.
32 Fig.15 - Differences in Leaf Width (LW, mm) Increment between control (CE) and stress (S) treatments of the 5 studied populations: Sweden (SD, Italy (PI), Spain (Furelos), Portugal (TO) and Morocco (MA).
LW Increment (mm) was higher in control than in stress plants for all the populations except the Sweden one. For Italy and Furelos populations, LW Increment showed a significant (p<0.001; p<0.05 respectively) difference between treatments and the differences were, 5.5 to 12 mm (100%), and 7 to 10.5 mm (50%) from stress to control plants, respectively. For the Sweden population the differences were 7.5 to 9 mm from control to stress plants (20% increase). We observed that the Italy population had the highest LW Increment for control plants compared to other populations. In Torgal population the value also increased in control relative to stress plants, but it was not significantly different.
33 Fig-16: Mean values of Fluorescence in control (CE) and stress (S) treatments at different percentages of Field capacity (FC=100%, 75%, 50% and 25%) in the 5 studied populations: Sweden (SD), Italy (PI), Spain (Furelos), Portugal (TO) and Morocco (MA). Error bars (95% confidence Interval).
Mean Fluorescence values decreased in stress plants, in response to the reduction of irrigation, and increased in the control plants. In Sweden, Italy, Torgal and Morocco populations, stress plants had similar or higher fluorescence values, but not significantly different than control plants at FC. At 75% FC the values overlap (control plants values started to rise, and stress plants values stared to fall) in Sweden, Furelos, Torgal and Morocco populations. At 50% FC control plants had higher fluorescence values than stress plants, in all populations, but values difference were not significantly different at this stage. At the end of the experiment Control (CE) and stress plants (S) showed significant differences
34 (p<0.001 in fluorescence values. The values decreased from 0.78 to 0.69 in stress plants and increased from 0.76 to 0.79 in control (CE) plants, respectively, in the Sweden population during the 45 days treatment period. The Sweden population showed the lowest mean Fluorescence value at 25% FC (close to 0.69 units) in the stress treatment and the highest decrease rate. Mean Fluorescence values were similar for Furelos, Torgal and Morocco populations, both in control (CE) and stress (S) plants.
Fig. 17 - SPAD values observed in control (CE) and stress (S) treatments at different percentages of Field capacity (FC=100%, 75%, 50% and 25%) in the 5 studied populations: Sweden (SD), Italy (PI), Spain (Furelos), Portugal (TO) and Morocco (MA). Error bars (95% Confidence Interval).
35 Figure 17 shows that plants in the control (CE) treatment present higher SPAD values at the end of experiment, i.e., at 25% FC, than those in the stress treatment whatever the population. SD, TO and MA population had lower SPAD values at FC in control (CE) plants than in stress plants. At 75% FC, control plants values increased, and stress plants values decreased but they showed no significant differences, and at 50% and 25% FC all populations had higher SPAD values in control plants relative to stress, yet only at 25% values were significantly (p<0.001) different between treatments. At the end of the experiment, Furelos and Torgal showed the highest SPAD values in control plants (41). On the contrary, the Sweden and Italy populations showed the lowest mean SPAD values in the stress plants (approximately 30).
Fig. 18 - Crop Water Stress Index observed in control (CE) and stress (S) plants at different percentages of Field Capacity (FC=100%, 75%, 50% and 25%)) in the 5 studied populations.
Fig 18 shows, at all stages (100%, 75% and 25% FC), CWSI was higher in control (CE) than in stress (S) plants but differences were only significant (p<0.05) at 75% and 25% (p<0.01) FC. At both 75% and 25% FC, CWSI values were 0.69 for stress plants.
36 Fig. 19- Canopy Temperature (Tc,ºC) observed in control (CE) and stress (S) plants at 25% of Field Capacity (i.e., at the end of the experiment) in the five studied populations: Sweden (SD), Italy (PI), Spain (Furelos), Portugal (TO) and Morocco (MA).
Fig 19 shows that at 25% FC, stress plants had higher canopy temperature in all populations and this difference was significant. In Torgal and Morocco populations the difference between treatments was highly significant (p<0.001). The highest Tc values for stress plants were 23.5 and 23.4 for Sweden and Morocco populations, respectively.
37 Fig. 20 - Crop Water Stress Index (CWSI) observed in control (CE) and stress (S) plants at 25% of Field Capacity in the 5 studied populations: Sweden (SD), Italy (PI), Spain (Furelos), Portugal (TO) and Morocco (MA).
At 25% FC, CWSI was higher for stress than for control plants in all populations and differences were significant between treatments in all populations, but highly significant (p<0.001) in Italy, Furelos, Torgal and Morocco populations. Among all populations, SwedenD population had highest CWSI values for control (0.6) and stress (0.78) plants. Italy population also had higher values for stress plants. Morocco population had lowest values for both control (.34) and stress (.50) plants.
38 Fig.21 - Variation in Mean diurnal transpiration rate (mmol m-2 s-1) in control (CE) and stress (S)
plants, along the experiment, from the 5 studied populations: Sweden (SD), Italy (PI), Spain (Furelos), Portugal (TO) and Morocco (MA), and average daytime temperature (ºC) and Relative Humidity (RH-%) along with the days of the experiment (day 1 to 15-see table 3).
In Fig; 21, the rate of transpiration was higher in 1st day of measurement for both control (CO: (5.2 mmol m-2 s-1)) and stress (S (5.9 mmol m-2 s-1 ) ) plants but it was higher in stress plants than the control plants. In day 2 the rate was lower than day 1 and stress plants also had the lower transpiration rate than the control plants. In day 3 transpiration rate was very low for both control and stress plants and in that day the average temperature was also very low (23.06 ºC) and Relative humidity was highest (69.8%). Transpiration rate of control plants was always higher than the stress plants except day 1 and day 5. This figure also showing that the rate of transpiration started to decrease from day 10 for stress plants and afterwards it was decreasing continuously in stress plants until at the end of experiment (day 15). Transpiration rate had significant difference (p<0.01) between CE and S plants
4.4 Destructive analysis to investigate the functional and structural responses of A. glutinosa among 3 treatments and five studied populations
To identify the variation of seedlings among water stress treatment (S), control treatment (CE) and control at the onset of the experiment (CO) and also to investigate the difference among five populations, some structural and functional parameters (i.e. RWC (%), Belowground dry biomass (g), Aboveground dry biomass (g), Total Plant dry mass (g), ratio of below to
aboveground biomass,
Specific Leaf Area (mm²mg-1), total leaf area (mm²), root area (cm²) and root length (cm)) were analysed. 0 10 20 30 40 50 60 70 80 0.0 1.0 2.0 3.0 4.0 5.0 6.0 7.0 1 2 3 4 5 6 7 8 9 10 11 12 13 14 15 Tem per at ur e (( °C ) an d R .H (%) Tr an spi rat io n R at e (m m o l m -2 s -1) Day
39 Table 7:
RWC (%), Belowground dry biomass (g), Aboveground dry biomass (g), Total Plant dry mass (g), ratio of below and aboveground biomass, Specific Leaf Area (mm²/mg), total leaf area (mm²), root area (cm²) and root length (cm) at the onset of the treatment (day 0), and at the end in control (22.07.2019) and stress plants (01.08.2019) from 5 Alnus glutinosa populations. Data are means ± SD. Symbols: *, **,
*** represent statistical significance at P = 0.05, 0.01 and 0.001 respectively; and ns = nonsignificant
at P >0.05.
Treatments
Significance of 2-way ANOVA
Parameters CO CE S Treatm ent Populat ion Population*trea tment RWC (%) 53.24± 6.24 58.99±7.72 51.51±5.02 *** ** ** Belowground dry mass (g) 0.75±0.483 0.88±0.416 0.77±0.349 ns *** ns
Above ground dry
mass (g) 0.58±0.417 0.72±0.470 0.66±0.294 ns *** ns
Total plant dry mass
(g) 1.33±0.872 1.62±0.807 1.4±0.574 ns *** ns
Belowground/Abov
eground dry mass 1.41±0.444 1.53±0.774 1.13±0.308 *** ns ns
SLA (mm²mg-1) 18.66±4.50 20.66±5.25 20.26±4.91 ns ** ns
Total leaf area (mm²) 3073.46±16 84.93 3545.3±138 6.78 2814.81±15 64.01 ns *** ns Root area (cm²) 74.47±31.59 80.97±27.12 70.48±22.06 ns *** ns Root length (cm) 1423.49±61 8.94 1788.7±510. 26 1576.13±49 4.23 ** *** ns
Mean Relative Water Content (RWC) and Root length (RL) were higher in control plants at the end of experiment (CE) (58.99% and 1788.7 cm) than in stress (51.51% and 1576.13 cm) plants at the end of the experiment, and higher than control plants at the onset of the experiment (CO). These values were significantly different among treatments (p<0.01), and among populations (p<0.05), but were not significantly different for treatment*population. Belowground dry mass (g), aboveground dry mass (g), Total plant dry mass (g), SLA (mm2g-1), Total leaf area (mm2) and Root area (cm2) did not differ between control (CE) and stress treatments at the end of the experiment or between control at the onset (CO) and end of experiment (CE), but differ among populations. The ratio between below and aboveground dry biomass was significantly different (p<0.01) between treatments, with the highest values for control plants at the end of the experiment (CE) but was not significantly different among populations.
40 Fig. 22- Relative Water Content (RWC %) values observed at the onset of the experiment in control plants (CO), at the end of the experiment in control (CE) and stress plants in the five studied populations: Sweden (SD), Italy (PI), Spain (Furelos), Portugal (TO) and Morocco (MA).
In Fig- 22, RWC (%) was higher in (CE) than in stress (S) plants in all populations but in Furelos population CO plants had higher RWC% than the control and stress plants. In Morocco population RWC% was differed significantly between CE and S plants; CE and CO plants but there had no difference between CO and S plants. RWC% also differed significantly CE and S plants for Sweden and Italy and Torgal population. There had no significant difference of RWC% among CE, S, and CO plants in Furelos population. RWC was significantly (p<0.001 and p<0.01) different among treatments and populations.
41 Fig.23- Specific Leaf Area values (SLA, mm²mg-1) observed at the onset of the experiment in control plants (CO) , at the end of the experiment in control (CE) and stress (S) plants in the 5 studied populations: Sweden (SD), Italy (PI), Spain (Furelos), Portugal (TO) and Morocco (MA).
SLA (mm²mg-1) is higher for control plants in Furelos, Italy and Torgal populations but SLA was only differed significant (p<0.05) among (CO), (CE) and (S) plants in Furelos, Italy and Sween populations. Italy population had highest SLA values for control (23 mm2/mg) than Furelos (19.5mm²/mg) and the
other populations. Among all populations Furelos population had lower SLA in (S) plants than other populations, that was 21% lower than (CE) plants and 9.3% lower than (CO) plants in the same population. Morocco and Sweden populations had higher SLA in (S) plants than (CO) and (CE) plants.