DEPARTAMENTO DE BIOLOGIA ANIMAL
.
Effectiveness of resilience assessment
tools in different case studies.
No´emie Wouters
DOUTORAMENTO EM BIOLOGIA
Especialidade de Biologia Marinha e Aquacultura
DEPARTAMENTO DE BIOLOGIA ANIMAL
.
Effectiveness of resilience assessment
tools in different case studies.
Tese orientada pelo Professor Doutor Henrique Cabral
e pelo Doutor Pierre Jean Valayer,
especialmente elaborada para a obtenc¸˜ao
do grau de Doutor em Biologia
‘The greatest glory in living lies not in never falling, but in rising every time we fall.’
Nelson Mandela
Acknowledgements . . . I List of Papers . . . II Summary . . . III Resumo . . . IV Resumo Alargado . . . V 1 Introduction.
Prior art and objectives . . . 2
2 The impoverished ecological state of a Portuguese coastal lagoon after its artificial opening.
2.1 Introduction . . . 14 2.2 Material and Methods . . . 16
2.2.1 Site and sample design 16
2.2.2 Data analysis 17
2.2.3 Multivariate analysis 18
2.3 Results . . . 19
2.3.1 Spatiotemporal variability of benthic community 19
2.3.2 Spatiotemporal variability of environmental variables 20
2.3.3 Multivariate analysis 22
2.4 Discussion . . . 23 2.4.1 Structure of macrobenthic community and ecological status 23
2.4.2 Artificial opening as management practice? 25
3 Measuring trends and signals of sustainability in oyster population and production data.
3.2.3 EWS reflecting (in)stability 37
3.2.4 North Atlantic Oscillation 38
3.3 Results . . . 39
3.3.1 Cyclic trends in case study 1 39
3.3.2 Decline trend in case study 2 41
3.3.3 North Atlantic Oscillation 42
3.3.4 EWS reflecting (in)stability 43
3.4 Discussion . . . 44
3.4.1 Data collection 44
3.4.2 Cyclic trends in case study 1 44
3.4.3 Decline trend in case study 2 45
3.4.4 EWS reflecting (in)stability ? 46
3.5 Conclusions . . . 48
4 Evidencing a regime shift in the North Sea using early warning signals as indicators of critical transitions.
4.1 Introduction . . . 54 4.2 Material and methods . . . 56
4.2.1 Case study: regime shift in the North Sea 56
4.2.2 Data processing 57
4.2.3 Early Warning Signals (EWS) 57
4.2.4 Standard Error - Robustness - Significance EWS 59
4.3 Results . . . 59 4.4 Discussion . . . 64
5 Early warning signals as indicators of cyclostationarity in three-species hierarchies.
5.1 Introduction . . . 72 5.2 Materials and Methods . . . 75
5.2.1 The automaton model 75
5.3.1 Stability of the two scenarios 80
5.3.2 Early warning signals 82
5.4 Discussion . . . 83
5.4.1 Cyclostationarity of RPS hierarchies 83 5.4.2 Early warning signals and cyclostationarity 86 5.5 Supplementary Material . . . 91
6 Final considerations. 6.1 General perspective on resilience assessment . . . 95
6.2 Limitating EWS challenges . . . 96
6.3 Key factors influencing EWS reading . . . 97
6.4 Insights on future resilience assessment in marine research . . . 99
7 Supplementary material. Automaton Software of Chapter 5 . . . 104
In the first instance, I acknowledge the two supervisors of this work: Prof. Dr. H.N. Cabral and Dr. P.J. Valayer. Without their continuous support this PhD would definitely not have been possible. Beyond sound science and statistics, you have taught me plenty boosting my professional career and also my personal development. Therefore I am forever grateful.
I acknowledge the University of Lisbon, Department of Science for hosting me as their PhD student and providing access to all its facilities. The fellowship of this PhD was granted by the Portuguese National Science and Technology Foundation (reference: SFRH/BD/48402/2008).
I would also like to express my gratitude to the highly professional and extremely productive team of Prof. Dr. H.N. Cabral with whom I had the pleasure to collaborate throughout the years. I definitely learned a lot from working with all of you.
I also thank all my friends, they know who they are. Also my colleagues from Greenloop introduc-ing me to truly innovative concepts such as resilience in management and biomimicry projects. Last but not least: a warm thank you to my family for their continuous support throughout this big challenge. My parents - ying and yang: altijd paraat - papa strategisch advies - mama pectus pectoris ik vergeet 1st kan Bio nooit. My brother and sister: Mick watersport king Maxine -Gucci girl with a golden heart. Ook mijn meter Marlene voor de vele ondersteunde mailtjes. Last but not least my little nephews Sebastien en Edouardo growing up so fast - thanks for being you and inspiring me.
No´emie Wouters
This thesis consists of four papers, each corresponding to a chapter from 2 to 5. Wouters N. was the lead author for all publications in cooperation with the co-authors and she was responsible for the data analysis. The field survey of Chapter 2 was also carried out by the first author with support of the colleagues mentioned in the acknowledgments.
Chapter 2
Wouters, N., Serafim, M.P., Baringo, F. C., Valayer, P.J., Cabral, H.N. The impoverished ecological state of a Portuguese coastal lagoon after its artificial opening. Submitted to Brazilian Journal of Biology.
Chapter 3
Wouters, N., Valayer, P.J., Pickerel, T., Vanstaen, K.R., Palmer, D.W., Mills, G., Cabral, H.N. Measuring trends and signals of sustainability in oyster population and production data.
Estuarine, Coastal and Shelf Science 2013 130, 231 - 238.
Chapter 4
Wouters, N., Dakos, V., Edwards, M., Serafim, M.P., Valayer, P.J., Cabral, H.N. Evidencing a regime shift in the North Sea using early warning signals as indicators of critical transitions. Estuarine, Coastal and Shelf Science 2015 152, 65-72
Chapter 5
Wouters, N., Serafim, M.P., Valayer, P.J., Kirkup, B.C., Wang, Y.J., Cabral, H.N. Early warning signals as indicators of cyclostationarity in three-species hierarchies. Submitted to Ecological Indicators.
Summary
Systems at times undergo abrupt, often undesirable changes termed regime shifts. Anticipating critical transitions requires the understanding of ecosystem resilience; however establishing op-erational resilience assessment tools remains a major hurdle assessed by the current study using different case studies. The first analysis, aiming at analysing the recovery time of macrobenthos in a coastal lagoon, evidenced the system previously underwent a regime shift. Only one taxon showed a significant recovery in response to the management action with the objective of improving the status of the lagoon. A lag in response time, hysteresis, constituted a major challenge for sound restoration management. The following studies assessed recently proposed statistical signals capa-ble of anticipating shifts, early warning signals (EWS) as resilience assessment tools. First EWS were calculated on oyster landings with an oscillating trend and also catch rates characterized by an irreversible decline. In both cases the tools accurately reflected the stability of the respective trends of the case studies. Three bottlenecks related to the use of EWS were identified: the quality of the time series, EWS behaviour in cyclic dynamics and the influence of the turnover rate of the measures upon which EWS are calculated. Next EWS were applied to phytoplankton data of a regime shift in the North Sea, as an example of a biotic signal with fast turnover rate. In one case, the resilience loss was detected 12 years prior to the shift. The high-resolution data enabled ad-vanced methodological testing confirming the robustness of the indicators and their trends. Finally a model was used to assess whether EWS might indicate a loss of cyclostationarity. It simulated three species in a competitive cycle: the first scenario oscillated stably while the second scenario was programmed with a gradually decaying resilience. Indeed EWS can be used to detect insta-bilities in cyclic phenomena, however the choice of the indicator remains essential. While hurdles do exist, we conclude that overall EWS are promising resilience assessment tools, and particularly recommendable considering the ease of their calculation.
Keywords
Resumo
Ecosisstemas s˜ao por vezes sujeitos a reconfigurac¸˜oes estruturais e funcionais s´ubitas indesej´aveis. Anticipar essas mudanc¸as de regime requer o conhecimento da resiliˆencia dos ecosisstemas; no entanto a quantific¸˜ao da mesma consiste dum des´afio. Esta dissertac¸˜ao foca-se na avaliac¸˜ao da efic´acia de ferramentas da resiliˆencia fazendo uso de diferentes casos de estudo. O primeiro es-tudo, como objetivo de avaliar o tempo de recuperac¸˜ao da comunidade macrobent´onica duma lagoa costeira, revelou uma mudanc¸a de regime anterior `a amostragem. Apenas um taxon mostrou uma recuperac¸˜ao significativa em resposta a medidas de gest˜ao destinadas a melhorar a qualidade do estado ecol´ogico da lagoa. O atraso no tempo de reposta da comunidade de macroinvertebrados bent´onicos, hysteresis, dificultou uma gest˜ao efetiva. Os estudos seguintes tiveram como objec-tivo avaliar a efic´acia de indicadores estat´ısticos, os sinais de alerta precoce caracterizados pela sua capacidade de detectar uma perda de resiliˆencia. Estes foram aplicados em s´eries-temporais de produc¸˜ao de ostras com uma tendˆencia oscilante e taxas de captura caracterizadas por um decl´ınio irrevers´ıvel. Nos dois casos, as ferramentas refletiram a estabilidade e a instabilidade das tendˆencias, respetivamente. Em relac¸˜ao `a sua leitura, trˆes desafios foram identificados: a in-fluˆencia da qualidade da s´erie temporal; o comportamento dos indicatores nos sistemas c´ıclicos; e a influˆencia da taxa de invers˜ao das medic¸˜oes sobre as quais os sinais s˜ao calculados. O terceiro estudo fez uso de parˆametros fitoplanct´onicos sendo um sinal bi´otico caracterizado por uma taxa de mudanc¸a elevada. Num dos indicadores a tendˆencia indicou que a alterac¸˜ao de regime pˆode ser detectada com 12 anos de antecedˆencia. Al´em do mais a elevada resoluc¸˜ao da s´erie-temporal permitiu metodologias de experimentac¸˜ao avanc¸adas confirmando a robustez dos indicadores e das tendˆencias. No ´ultimo estudo foi utilizado um modelo de trˆes esp´ecies interagindo num ciclo com-petitivo que avaliou a capacidade dos sinais de identificar uma perda de resiliˆencia nos fen´omenos c´ıclicos. Nos dois cen´arios, o primeiro est´avel e o segundo modelado a perder gradualmente a sua resiliˆencia, os sinais de alerta precoce identificaram efetivamente a estabilidade do sistema e a degradac¸˜ao da sua ciclicidade.
Palavras chave
Resumo Alargado
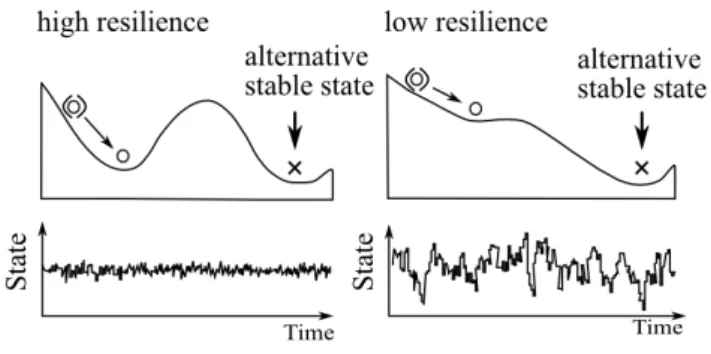
As press˜oes antropog´enicas `as quais os ecossistemas est˜ao sujeitos, tˆem vindo a aumentar nas ´ultimas d´ecadas. A resposta dinˆamica dos ecossistemas ao aumento de press˜oes tal como a eutrofiza-c¸˜ao e a poluieutrofiza-c¸˜ao s˜ao lineares at´e se atingir um n´ıvel critico ou ‘threshold’ ap´os o qual o compor-tamento tornam-se descont´ınuas. Conceptualmente, a estabilidade dos ecossistemas ´e frequente-mente representada como uma paisagem ondulada, representando o dom´ınio de atrac¸˜ao, dentro do qual a posic¸˜ao duma bola reflete o (des)equilibro da mesma (figure 1.1). Sujeita a pequenas perturbac¸˜oes, a bola volta rapidamente ao seu estado original, no entanto, grandes perturbac¸˜oes podem forc¸ar o ecossistema para um estado de equil´ıbrio dinˆamico alternativo. A transposic¸˜ao de tais pontos cr´ıticos implica reconfigurac¸˜oes s´ubitas ao n´ıvel estrutural e funcional, denominadas mudanc¸as de regime. Estas s˜ao frequentemente associadas a perdas de servic¸os e bens e nalguns casos o retorno ao estado ecologico original ´e pouco prov´avel. Neste ˆambito, a identificac¸˜ao e antecipac¸˜ao de mudanc¸as de regime s˜ao extremamente valiosas para uma gest˜ao efetiva que as-segure a sustentabilidade dos ecossistema. Neste sentido, a quantificac¸˜ao da resiliˆencia, definida como a capacidade dum determinado ecossistema de restabelecer o seu pr´oprio equil´ıbrio ap´os um dist´urbio, ´e essencial. De facto, o conceito de resiliˆencia tornou-se fundamental na gest˜ao de ecossistemas. No entanto, apesar do seu enquadramento te´orico estar bem estabelecido, as ferra-mentas espec´ıficas de quantificac¸˜ao s˜ao limitadas. Esta dissertac¸˜ao foca-se na an´alise da efic´acia de ferramentas de avaliac¸˜ao da resiliˆencia fazendo uso de diferentes casos de estudo. O primeiro estudo tinha com objetivo a avaliac¸˜ao do tempo de recuperac¸˜ao duma comunidade macrobent´onica numa lagoa costeira. No entanto, esta revelou um estado de degradac¸˜ao avanc¸ado, evidenciando a ocorrˆencia duma mudanc¸a de regime antes da amostragem ser efectuada. Apenas um taxon teve uma recuperac¸˜ao significativa em resposta a medidas de gest˜ao destinadas a melhorar a qualidade do estado ecol´ogico da lagoa. Uma das conclus˜oes chave foi que um atraso no tempo de reposta,
hysteresis, constitui um obst´aculo maior na recuperac¸˜ao efetiva do ecossistema. No caso dum
de-terminado limite ser ultrapassado pode tornar-se necess´aria a implementac¸˜ao de medidas de gest˜ao mais dr´asticas e com elevados custos. Por outro lado, o estudo mostrou que a efic´acia da avaliac¸˜ao da resiliˆencia ´e influenciada pelo planeamento do programa do monitorizac¸˜ao: uma amostragem
cont´ınua e com alta resoluc¸˜ao espacial ´e deste modo essencial.
Uma nova abordagem proposta recentemente pela comunidade cient´ıfica sugere o uso de indi-cadores estat´ısticos com a capacidade de detectar instabilidades nos ecossistemas para tentar an-tecipar mudanc¸as de regime. Estes indicadores denominam-se sinais de alerta precoce. Estas ferramentas, explor´aveis atrav´es do estudo de s´eries-temporais, tˆem sido validadas em diferentes ´areas do conhecimento, incluindo medicina, economia e biologia. Os estudos que comp˜oem esta dissertac¸˜ao focam-se na analise dos sinais de alerta precoce em m´ultiplos casos de estudo. Em primeiro lugar foram aplicados a dois tipos de dados de ostras provenientes de diferentes zonas geogr´aficas: dados de produc¸˜ao e taxas de captura. Uma an´alise de tendˆencia revelou oscilac¸˜oes e um decl´ınio irrevers´ıvel das taxas de produc¸˜ao e captura, respectivamente. Em ambos os casos os sinais de alerta precoce refletiram precisamente a estabilidade e a instabilidade das tendˆencias. No entanto, trˆes desafios surgiram relativamente `a sua utilizac¸˜ao: primeiro, a qualidade das s´eries-temporais; segundo, o seu comportamento em mudanc¸as de regime em sistemas caracterizadas por uma dinˆamica c´ıclica; e por ´ultimo, a influˆencia da leitura dos sinais em relac¸˜ao `a taxa de invers˜ao das medic¸˜oes sobre as quais s˜ao calculados. O terceiro estudo fez uso de parˆametros fito-planct´onicos como sinais bi´oticos com uma taxa de mudanc¸a di´aria, no ˆambito dum dos maiores programas mundiais de monitorizac¸˜ao, cobrindo uma mudanc¸a de regime no Mar do Norte nos anos oitenta. No caso de um dos indicadores, a alterac¸˜ao de regime foi detectada com 12 anos de antecedˆencia. Confirmou-se tamb´em que a resoluc¸˜ao da s´erie-temporal contribui para a efic´acia dos sinais de alerta precoce. Neste estudo a resoluc¸˜ao dos dados, compostos por amostragens mensais, permitiu o avanc¸o das metodologias de experimentac¸˜ao atrav´es da avaliac¸˜ao da robustez e da significˆancia dos indicadores a das suas tendˆencias. Um constrangimento da metodologica no c´alculo dos sinais de alerta precoce ´e a dependˆencia estat´ıstica da janela temporal sobre o qual ´e baseado o seu c´alculo. No entanto, esta investigac¸˜ao revelou que uma estrat´egia efetiva para ul-trapassar esta dificuldade ´e a divis˜ao da s´erie-temporal em blocos independentes. Tendo em conta os obst´aculos, a utilizac¸˜ao dos sinais de alerta precoce ´e altamente recomendada visto que o seu c´alculo ´e relativamente simples fazendo uso de ferramentas dispon´ıveis online.
pre-no entanto, poucos estudos fizeram uso dos sinais de alerta precoce na sua perda de resiliˆencia. Utilizou-se um modelo de trˆes esp´ecies interagindo num ciclo competitivo em dois cen´arios: o primeiro consistiu duma oscilac¸˜ao est´avel, enquanto que no segundo cen´ario a interac¸˜ao das trˆes esp´ecies foi gradualmente degradada. A principal conclus˜ao foi que os sinais de alerta precoce tˆem efetivamente a capacidade de detetar instabilidades nos fen´omenos c´ıclicos, no entanto, a escolha do tipo de indicador ´e crucial.
Em s´umula, a chave da avaliac¸˜ao da resiliˆencia est´a na capacidade de antecipar quando um ecossis-tema est´a `a beira da mudanc¸a de um estado de equil´ıbrio para um outro. ´E igualmente importante avaliar se e quando um sistema em mudanc¸a pode eventualmente voltar o seu estado original e compreender quais s˜ao os parˆametros que conduzem a tal ciclo de hysteresis. Al´em disso, os sis-temas biol´ogicos est˜ao frequentemente sujeitos a ciclos naturais, globalmente est´aveis, mas nos quais as press˜oes dinˆamicas externas ou internas podem resultar numa perda de estabilidade. As publicac¸˜oes resultantes desta dissertac¸˜ao sublinham a relevˆancia do desfasamento em termos de tempo de resposta, hysteresis, como tamb´em a importanc¸a dos indicadores estat´ısticos com a capacidade de antecipar mudanc¸as de regime, fazendo uso de an´alises de s´eries-temporais e modelac¸˜ao. Nos diferentes casos de estudos, dificuldades como a robustez e a qualidade das s´eries-temporais s˜ao discutidos a par da avaliac¸˜ao cr´ıtica da efic´acia dos sinais de alerta precoce. No ´ultimo cap´ıtulo s˜ao ainda sugeridas poss´ıveis linhas de investigac¸˜ao futura, tendo em conta as quest˜oes levantadas pelo presente estudo. Nomeadamente, foi sublinhado a necessidade de aumen-tar os casos de estudos nos estu´arios, e em particular, recomenda-se uma an´alise mais detalhados dos diferentes habitats (intertidal, lagoas costeiras, estu´arios, barragens de corais, etc). O desen-volvimento de estudos marinhos e estuarinos contribuir´a para o estabelecimento duma base de da-dos refletindo as tendˆencias da-dos sinais de alerta precoce nos diferentes habitats. Por ´ultimo, poderia tamb´em ser efectuada uma classificac¸˜ao dos mesmos habitats consoante o seu n´ıvel de resiliˆencia, o que poder´a resultar na elaborac¸˜ao duma escala universal de resiliˆencia. Finalmente, em relac¸˜ao `a aplicac¸˜ao dos sinais de alerta precoce na gest˜ao de ecossistemas e recursos, a primeira etapa con-siste na familiarizac¸˜ao dos decisores e gestores do uso dos sinais de alerta precoce, sublinhando as suas vantagens, nomeadamente a de que o seu c´alculo ser relativemente simples. Incorporar os sinais de alerta precoce nos planos de monitorizac¸˜ao pode ser vantajoso fazendo uso de
amostra-gens de longa durac¸˜ao e com alta resoluc¸˜ao espacial e de dados em tempo real usando por exemplo sat´elites e boias.
Chapter 1
Prior art and objectives
One of the first biologists to mention the importance of nonlinear dynamics in ecology was Craw-ford Stanley Holling recognising that minor changes in ecosystems forced away from their local equilibrium, can induce large overall structural changes (Holling 1973). By defining dynamically stable conditions in his publication on the resilience and stability of ecological systems, he signif-icantly influenced integrative theories within ecology by introducing new concepts such as local equilibrium and basin of attraction. Illustrated with case studies e.g. the fish stock depletion in the Great Lakes (USA), Holling made theoretical suggestions on the behaviour of systems distin-guishing stable, unstable equilibria and cycles. Holling also emphasised other ecosystem properties essential for analysing ecological processes: lags in response time, thresholds and the evolution of spatial elements over time. Holling was one of the first authors to formally introduce the concept of resilience as a measure of the persistence of ecosystems and of their ability to absorb disturbances while maintaining similar structural relationships between populations or state variables. After this formal definition, resilience became a central concept in the management of natural ecosystems. Resilience encompasses two fundamentally different but rarely distinguished processes: resistance and recovery (Cˆot´e and Darling 2010). For a given structural or functional parameter, resistance is defined as the amount of a given pressure that can be applied without deterioration in status, ex-pressed by a specific measure. When the pressure is removed, the status may not improve promptly introducing a lag: ‘type I hysteresis’ (Elliott et al., 2007). Given time, though, recovery might oc-cur, although it does not necessarily imply a return to original levels. The degree of recovery, compared to the original status is defined as ‘type II hysteresis’ where complete resilience results in a return to the original level, and partial resilience is a return to a different (lower or higher) level (Elliott et al., 2007). While its conceptual approach and theoretical terms are well established, the actual measurement is fraught with difficulties and resilience remains poorly quantified especially in the marine environment (Cˆot´e and Darling 2010).
To assess recovery time requires an understanding of the current and previous state of the ecosys-tem supported by empirical evidence (Elliott et al., 2007). Ecosysecosys-tems may respond gradually
2011). One way of assessing the state of an ecosystem and its potential recovery is by analysing the evolution of univariate metrics, such as diversity and abundance, and their relationship to envi-ronmental variables (Schaffner 2010). Macrobenthos characterized by only limited migration can provide useful insights into the community response following disturbances (Buss and Jackson 1979; Burrow et al., 1998). Generally frequent environmental fluctuations result in resilient mac-robenthic communities: for example the resistance of the composing macmac-robenthic communities of coastal lagoons is considered high, closely linked to the high variability in for example salinity and oxygen content (Munari et al., 2005). However especially in intermittently open/closed lagoons, excessive nutrient loading might result in an irreversible regime shift to a macro-algae dominated ecosystem (Pereira Coutinho et al., 2012; Viaroli et al., 2008). To prevent eutrophication, a com-mon management practice in Portugal consists of the artificial opening of the lagoons (Cancela da Fonseca et al., 1999; Costa et al., 2003; Carvalho et al., 2011). Once connected to the sea, flushing will prevent eutrophication and drain the alluvial plains for agriculture (Freitas et al., 2008). Regime shifts like eutrophied coastal lagoon shifting to being entirely dominated by algae, are defined as abrupt changes on several trophic levels leading to ecosystem reconfiguration between alternative states (Andersen et al., 2009). They might have important socioeconomic influences as good and services are likely to be different under the new regime, as demonstrated in marine studies on shifts between alternative states in coral reefs and kelp forests (Boettiger et al., 2013, Hughes
et al., 1994; Konar and Estes 20003). The development of management strategies and operational
tools to mitigate or to avert critical transitions is therefore crucial to ensure the sustainability of ecosystems and their biotic resources (Dakos and Hastings 2013). Regime shifts are considered abrupt in the sense that the timespan of their occurrence is relatively short (1–2 years) in compari-son to the duration of the different states, often decadal to multi-decadal (Mollman and Diekmann 2011). Numerous examples have been detected in terrestrial, freshwater and marine ecosystems and in Europe a comparative analysis of shifts induced by climate change and overfishing in dif-ferent marine regions including the Bay of Biscay, and the North, Baltic, Black and Mediterranean Sea, the Bay of Biscay, is available (Mollman et al., 2011). Conceptual models describe differ-ent types of critical transitions by represdiffer-enting the equilibrium state visualised by the ecosystem’s response e.g. a structural or functional parameter as a function of an altering external condition
e.g. nutrient loading (Elliott et al., 2007). In some cases a linear response occurs, others show the equilibrium state suddenly crossing a non-catastrophic threshold and finally the equilibrium curve might also show a so called backward-folding where, for a specific environmental condition, two alternative stable states exist (Scheffer et al., 2009). The latter implies the existence of two alternative stable states with a bifurcation point, where a minor alteration drives the system across a boundary causing a large transition (Mollman and Diekmann 2011). Small perturbations might also induce large transitions in the absence of true bifurcations, provided that the system is highly sensitive in a certain range of conditions (Scheffer et al., 2009). Finally one other class of impor-tant bifurcations are those that mark the transition from a stable equilibrium to a cyclic or chaotic attractor (Scheffer et al., 2009).
Different numerical methods exist to detect shifts including multivariate techniques such as ordina-tion (Mollman and Diekmann 2011). Recent research has focused on statistical tools that have the capacity to anticipate critical transitions: early warning signals (EWS). The dynamics of a variety of systems, ranging from financial markets to neurological disorders such as epilepsy, are charac-terized by generic properties near transitions known in the dynamical systems theory as ‘Critical Slowing Down’ (CSD). It refers to a universal law related to the characteristic return time of sys-tems near thresholds (Wissel 1984). Near a critical point, the recovery rate after disturbance takes longer (Vervaart et al., 2011). Even without insights in the mathematical background of the theory, the concept of CSD can be easily understood by a visual representation of the basin of attraction as a stability landscape like a ball in a basin: resilient ecosystems have a deep basin and when stressed, their recovery is fast. On the other hand if the basin is shallow (brittle ecosystem) and external forcing occurs, the ball does not only return slower to its original state but is also more readily flipped out of the basin: the risk of transition is high (Scheffer 2010) (figure 1.1).
In summary, after a temporary disturbance, the more swiftly the system returns and the less it fluctuates, the more stable it is (Holling 1973). This concept is applied in the management of terrestrial ecosystems namely rangelands: when the grazing pressure becomes too intense, the risk of being overrun by weeds is high and managers attempt to obtain a warning of an impending transition by monitoring how the time to extinction of small outbreaks of the weed changes as the
Figure 1.1:Conceptual image of high vs low resilience landscape
take up several years, and even decades (Buestel et al., 2009). Systematically testing for recovery rates as in the example above is therefore often difficult especially for complex systems (Scheffer 2010). Another approach to identify CSD relies on statistical parameters that will fluctuate and change in a predictable way. A variety of leading indicators, EWS, exist and can be extracted by time series analysis (Scheffer et al., 2009; Ives and Dakos 2012; Drake and Griffen 2010). A first tool frequently used is autocorrelation, the increase of which is characteristic of a CSD (Lenton et
al., 2012a,b). Subsequent states in a time series will become more alike, so the short-term memory
(=autocorrelation at low lags) increases (Scheffer et al., 2009; Scheffer 2010). Slow recovery is often associated with further accumulated perturbations resulting in an increasing variance of the fluctuations prior to a transition (Dai et al., 2012). Increasing variance is a second parameter often used as EWS. Thirdly particular spatial patterns arising before a critical transition might also serve as EWS (Scheffer et al., 2009). Spatial assessments consider systems as numerous coupled units influencing each other states: for example the persistence of species in a fragmented landscape is determined by the presence of the same species in neighbouring patches allowing recolonisation (Bascompte and Sol´e 1996). When these self-organised regular patterns are subjected to habitat fragmentation, the structural properties of the resulting landscape changes in a non-linear way with a general tendency towards increased spatial coherence among units prior to extinction (Bascompte and Sol´e 1996). Although classes of spatial EWS have been observed across systems, there is no ‘one-size-fits-all’ when interpreting spatial patterns announcing critical transitions (Scheffer et
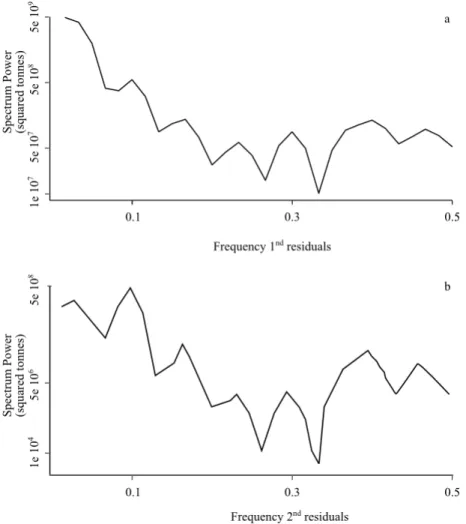
al., 2009). A fourth method used as EWS is a power spectrum analysis reflecting changes in the
analysis might be a promising tool especially for cyclic phenomena omnipresent in nature and expected to also display leading indicators when forced to their border of attraction (Scheffer et
al., 2009). In this case the power of spectral densities would shift to lower frequencies.
In biology, the existence and validity of EWS as leading indicators of regime shifts are discussed in recent publications in high impact journals (Scheffer et al., 2009; Scheffer, 2010; Dai et al., 2012; Drake and Griffen, 2010; Lenton, 2011; Wang et al., 2012). Numerous examples are at hand in paleoclimate analysis, lake eutrophication and arid ecosystems desertification (Rietkerk et al., 2004; Dakos et al., 2008; Dakos et al, 2011; Lade and Gross, 2012; Wang et al., 2012; Biggs et
al., 2009; Brock and Carpenter, 2012). Both experimentally and in models, EWS have been
ob-served; for example, in a generalised fishery model EWS indicated the shift from a high-piscivore, low-planktivore to a low-piscivore, high-planktivore regime (Lade and Gross, 2012). Laboratory populations of the zooplankton Daphnia magna subjected to declining food provision have also ex-hibited CSD (Drake and Griffen 2010). Finally EWS were also observed in the laboratory in yeast populations subjected to the Allee effect by increasingly dissolving the population to eventually collapse (Dai et al., 2012). However application of EWS to marine ecosystems and datasets are still rare. Lindegren et al.(2012) estimated EWS in a large-scale reorganisation of the Baltic Sea ecosystem using two indicator copepod species but found no clear patterns. Litzow et al.(2008) used a measure of community composition on trawl survey data and observed increased spatial variability accompanying the reorganisation of two continental shelf ecosystems in the North Pa-cific (Gulf of Alaska) and the North Atlantic (Scotian Shelf), while Litzow et al.(2013) compared collapsing and non-collapsing models of Crustacean fisheries. Despite this work, we still lack understanding of the applicability of EWS as tools for anticipating regime shifts in marine ecosys-tems. In short EWS have been applied to a variety of signals ranging from abiotic measures such as paleo-temperature records, to biotic parameters the latter including different trophic levels ranging from macro to microorganisms and also models. Their widespread use resulted in the availability of extensive methodological guidelines including flowcharts and online toolboxes (Dakos et al., 2012, http://www.early-warning-signals.org/). Care is needed in the data processing prior to EWS calculation and also in the interpretation of the results as CSD does not always associate with rapid
methodological hurdles include the robustness of the indicator themselves and the statistical sig-nificance of their trend, that instead of the absolute EWS values, is ultimately used as indication of CSD (Lenton et al., 2012). The length of the time series might also play an important role: EWS readings in shorter time series are more challenging (Mollman and Diekmann 2011).
The applicability and utility of EWS to real ecosystem management is assessed by different criteria (Lindeberg et al., 2012). A crucial issue is a timely warning: how far from the transition are EWS observed: if the trend increases only briefly before, it is unlikely that the shift can be anticipated or avoided like in the case of a transition from oligotrophic to eutrophic lakes, which could have been avoided by employing simple remedial measures (Donangelo et al., 2010; Chisholm and Filotas, 2009). Also using a fisheries model of a regime shift, the increase in the EWS indicators only oc-curred once the regime shift had already initiated, too late for management to avert a shift (Biggs
et al., 2008). This PhD dissertation assesses the applicability of resilience assessment tools in
dif-ferent case studies. The first paper uses recovery time after a management intervention to evaluate the state of a small lagoon along the South-West coast of Portugal by assessing the spatiotemporal evolution of its macrobenthic community. The following studies apply EWS to biotic variables including macrobenthos and phytoplankton data and a model under different dynamics including irreversible declines and cyclic trends. The utility and application of EWS in a management set-ting is assessed, with special attention to the robustness and significance of the findings. Finally a model approach is deployed to assess how stability and EWS evolve in a system where three biotic components are interacting circularly.
References
Andersen, T., Carstensen, J., Hernandez-Garcia, E., Duarte, C.M. 2009. Ecological thresholds and regime shifts: approaches to identification. Trends in Ecology and Evolution 24, 49-57.
Bascompte, J., Sol´e, R.V. 1995. Rethinking complexity: modelling spatiotemporal dynamics in ecology. Trends in Ecology and Evolution 10, 361-366.
Biggs, R., Simons, H., Bakkenes, M., Scholes, R.J., Eickhout, B., van Vuuren, D., Alkemade, R. 2008. Scenarios of biodiversity loss in southern Africa in the 21st century. Global Environmental Change 18, 296-309.
regime shift in time to avert it. Proceedings of the National Academy of Sciences of the United States of America 106, 826-831.
Boettiger, C., Ross, N., Hastings, A. 2013. Early warning signals: the charter and uncharted territories. Theoretical Ecology 6, 255-264.
Brock, W.A., Carpenter, S.R. 2012. Early warnings of regime shift when the ecosystem structure is un-known. PLoS One 7, e45586.
Buestel, D., Ropert, M., Prou, J., Goulletquer, P. 2009. History, Status and Future of Oyster Culture in France. Journal of Shellfish Research 28, 813-820.
Burrows, M.T., Hawkins, S.J. 1998. Modelling patch dynamics on rocky shores using deterministic cellular automata. Marine Ecology Progress Series 167, 1-13.
Buss, L.W., Jackson, J.B.C. 1979. Competitive Networks: Nontransitive Competitive Relationships in Cryptic Coral Reef Environments. The American Naturalist 113, 223-234.
Cancela da Fonseca, L., Costa, A.M., Magalhae, F., Cristo, M. 1999. The benthic marcoinvertebrate comunity of lagoa Da Sancha: a coastal lagoon in SW Portugal. Limnetica 16, 39-48.
Carvalho, S., Pereira, P., Pereira, F., de Pablo, H., Vale, C., Gaspar, M.B. 2011. Factors structuring tempo-ral and spatial dynamics of macrobenthic communities in a eutrophic coastal lagoon (Obidos lagoon, Portugal). Marine Environmental Research 71, 97-110.
Chisholm, R.A., Filotas, E. 2009. Critical slowing down as an indicator of transitions in two-species models. Journal of Theoretical Biology 257, 142-149.
Costa, A.M., Cristo, M., Cancela da Fonseca, L. 2003. Annual cycle of the benthic community of a coastal lagoon: Lagoa de Melides (Grˆandola, SW Portugal). Revista de biologia 21, 71-89.
Cˆot´e, I.M., Darling, E.S. 2010. Rethinking Ecosystem Resilience in the Face of Climate Change. PLoS Biology 8, e1000438.
Dai, L., Vorselen, D., Korolev, K.S., Gore, J. 2012. Generic Indicators for Loss of Resilience Before a Tipping Point Leading to Population Collapse. Science 336, 1175-1177.
Dakos, V., Scheffer, M., van Nes, E.H., Brovkin, V., Petoukhov, V., Held, H. 2008. Slowing down as an early warning signal for abrupt climate change. Proceedings of the National Academy of Sciences of the United States of America 105, 14308-1431
Dakos, V., Hastings, A. 2013. Editorial: special issue on regime shifts and tipping points in ecology. Theoretical Ecology 6, 253-254.
Dakos, V., K´efi, S., Rietkerk, M., van Nes, E.H., Scheffer, M. 2011. Slowing down in spatially patterned ecosystems at the brink of collapse. The American Naturalist. 177, 153-166.
Dakos, V., Carpenter, S.R., Brock, W.A., Ellison, A.M., Guttal, V., Ives, A.R., K´efi8, S., Livina, V., Seekell1, D.V.A., Egbert, O., van Nes, H., Scheffer, M. 2012. Methods for Detecting Early Warnings
Donangelo, R., Fort, H., Dakos, V., Scheffer, M., Van Nes, E.H. 2010. Early Warnings for Catastrophic Shifts in Ecosystems: Comparison between Spatial and Temporal Indicators. International Journal of Bifurcation and Chaos 20, 315-321
Drake, J.M., Griffen, B.D. 2010. Early warning signals of extinction in deteriorating environments. Nature 467, 456-459.
Elliott, M., Burdon, D., Hemingway, K.L., Apitz, S.E. 2007. Estuarine, coastal and marine ecosystem restoration: Confusing management and science - A revision of concepts. Estuarine Coastal and Shelf Science 74, 349-366.
Freitas, C.M., Silva, C., Andrade, C.F., Silva, J.M., Carvalho, M.R., Almeida, P.R., Costa, J.L., Brotas, V., Cruces, A., Costa, M.J., Cabral, H.N., Cardoso, I., Gameiro, C., Wouters, N., Santos, P.R., Pais, M. 2008. Projecto de recuperac¸ao da lagoa de Melides, Relatorio Final. 179pp.
Holling, C.S. 1973. Resilience and stability of ecological systems. Annual Review of Ecological Systems 4, 1-24.
Hughes, T.P., Bellwood, D.R., Folke, C., Steneck, R.S., Wilson, J. 2005. New paradigms for supporting the resilience of marine ecosystems. Trends in Ecology and Evolution 20, 380-386.
Ives, A.R., Dakos, V. 2012. Detecting dynamical changes in nonlinear time series using locally linear state-space models. Ecosphere 3, art58.
Konar, B., Estes, J.A. 2003. The stability of boundary regions between kelp beds and deforested areas. Ecology 84, 174-185.
Lade, S.J., Gross, T. 2012. Early Warning Signals for Critical Transitions: A Generalized Modeling Ap-proach. PLoS Computational Biology 8, e1002360.
Lenton, T.M. 2011. Early warning of climate tipping points. Nature Climate Change 1, 201-209.
Lenton, T.M., Livina, V.N., Dakos, V., van Nes , E.H., Scheffer, M. 2012a. Early warning of climate tipping points from critical slowing down: comparing methods to improve robustness. Philosophical Transactions of the Royal Society A 370, 1185-1204
Lenton, T.M., Livina, V.N., Dakos, V., Scheffer, M. 2012b. Climate bifurcation during the last deglacia-tion? Climate of the Past 8, 1127-1139.
Lindegren, M., Dakos, V., Groeger, J.P., Gardmark, A., Kornilovs, G., Otto, S.A., Moellmann, C. 2012. Early Detection of Ecosystem Regime Shifts: A Multiple Method Evaluation for Management Ap-plication. PLoS ONE 7, e38410
Litzow, M.A., Urban, J.D., Laurel, B.J. 2008. Increased Spatial Variance Accompanies Reorganizationof two Contnental Shelf Ecosystems. Ecological Applications 18, 1331-1337.
Litzow, M.A., Mueter, F.J., Urban, J.D. 2013. Rising catch variability preceded historical fisheries col-lapses in Alaska. Ecological Applications 23, 1475-1487.
Mollmann, C., Diekmann, R. 2011. Marine ecosystem regime shifts induced by climate and overfishing: a review for the Northern hemisphere. Advances in Ecological Research 47, 303-347.
Mollmann, C., Conversi, A., Edwards, M. 2011. Comparative analysis of European wide marine ecosystem shifts: a large-scale approach for developing the basis for ecosystem-based management. Biology Letters 7, 484-486.
Munari, C., Rossi, R., Mistri, M. 2005. Temporal trends in macrobenthos community structure and redun-dancy in a shallow coastal lagoon (Valli di Comacchio, Northern Adriatic Sea). Hydrobiologia 550, 95-104.
Pereira Coutinho, M.T., Brito, A.C., Pereira, P., Gonc¸alves, A.S., Moita, M.T. 2012. A phytoplankton tool for water quality assessment in semi-enclosed coastal lagoons: Open vs closed regimes. Estuarine, Coastal and Shelf Science 110, 134-146.
Rietkerk, M., Dekker, S.C., de Ruiter, P.C., van de Koppel, J. 2004. Self-organized patchiness and catas-trophic shifts in ecosystems. Science 305, 1926-1929.
Schaffner, L.C. 2010. Sediment disturbances: effect of disturbance severity and potential importance of non-local processes. Estuaries and Coasts 33, 1300-1313.
Scheffer, M. 2010. Foreseeing tipping points. Nature 467, 411-412.
Scheffer, M., Bascompte, J., Brock, W.A., Brovkin, V., Carpenter, S.R., Dakos, V., Held, H., van Nes, E.H., Rietkerk, M., Sugihara, G. 2009. Early-warning signals for critical transitions. Nature 461, 53-59. Veraart, A.J., Faassen, E.J., Dakos, V., van Nes, E.H., Lurling, M., Scheffer, M. 2011. Recovery rates
reflect distance to a tipping point in a living system. Nature 481, 357-359.
Viaroli, P., Bartoli, M., Giordani, G., Naldi, M., Orfanidis, S., Zaldivar, J.M. 2008. Community shifts, alternative stable states, biogeochemical controls and feedbacks in eutrophic coastal lagoons: a brief overview. Aquatic Conservation: Marine and Freshwater Ecosystems 18, S105-S117.
Wang, R., Dearing, J.A., Langdon, P.G., Zhang, E., Yang, X., Dakos, V., Scheffer, M. 2012. Flickering gives early warning signals of a critical transition to a eutrophic lake state. Nature 492, 419-422. Wissel, C. 1984. A universal law of the characteristic return time near thresholds. Oecologia (Berlin) 65,
Chapter 2
The impoverished ecological state of a
Portuguese coastal lagoon after its
Abstract
Coastal lagoons are ecological islands subjected to frequent environmental fluctuations. Their con-servation is vital to safeguard their socioeconomic value but also their unique biotic diversity. This paper evaluates the spatiotemporal evolution (2-way analyses of variance) of the macrobenthos in a Portuguese lagoon in six stations monitored frequently over a 9 month period covering two short artificial openings to the sea. The assessment revealed the poor ecological state of the lagoon with a drastic impoverishment since the 80’ties.The management practice of connecting the lagoon to the sea, proven effective in other cases, did not result in restoration. Instead it represented an addi-tional physical disturbance to the macrobenthic community and only the chironomidae (Diptera) were able to re-establish their population. The relationship of the benthic community to envi-ronmental variables (temperature, salinity, dissolved oxygen, pH, Eh and Secchi depth) was also examined using multivariate analysis and revealed temperature and salinity as the most important parameters structuring the community. The poor ecological status of the lagoon stresses the urgent need of implementing a revised management plan. A more frequent and a more prolonged open-ing with a widenopen-ing of the inlet channel while takopen-ing into account the species life cycles, could be considered to allow effective flushing and the colonisation of marine taxa.
Keywords
Resumo
As lagoas costeiras s˜ao consideradas ilhas ecol´ogicas sujeitas a flutuac¸˜oes ambientais frequentes. A sua conservac¸˜ao ´e vital para salvaguardar o seu valor socioecon´omico tal como a sua biodiver-sidade ´unica. Nesta publicac¸˜ao a evoluc¸˜ao espacio-temporal (analise de variˆancia a 2 factores) da comunidade macrobent´onica duma lagoa costeira da costa Portuguesa ´e avaliada: 6 estac¸˜oes foram frequentemente amostradas durante um periodo de 9 meses cobrindo duas aberturas artifi-cias da lagoa para o mar. Os resultados revelaram um estado ecol´ogico degradado incluindo uma reduc¸˜ao dr´astica da biodiversidade desde os anos oitenta. A gest˜ao que consistia em abrir artifi-cialmente a lagoa com objectivo de estabelecer uma conex˜ao para o mar, provada efectiva noutros casos, n˜ao resultou numa renovac¸˜ao desta lagoa. Pelo contrario, a medida de gest˜ao representou uma perturbac¸˜ao f´ısica suplementar para comunidade macrobent´onica sendo que os Chironomi-dae (Diptera) foram o ´unico taxon que conseguiu re-estabelecer as suas populac¸˜oes. A relac¸˜ao da comunidade macrobent´onica com os parameteros ambientais (temperatura, salinidade, oxig´enio dissolvido, Ph, condutividade, profundidade Secchi) foi investigada fazendo uso de uma analise multivariada que revelou que a temperatura e salindade foram os dois parˆametros mais importantes para estruturar a comunidade. O estado ecol´ogico degradado p˜oe ˆenfase na necessidade urgente duma revis˜ao estrat´egica do plano de gest˜ao da lagoa. Uma abertura mais frequente e mais pro-longada incluindo um alargamento do canal de aberta tendo em conta o ciclo da vida das esp´ecies residentes deve ser considerada, facilitando uma descarga mais eficiente da lagoa e permitindo po-tencialmente a colonizac¸˜ao de taxa marinhas.
Palavras-chave
2.1
Introduction
Coastal lagoons form a transient barrier between land and sea separated by a wide ridge and com-munication is established during extreme high tides, stormy weather or by waves, when seawater washes over into the lagoon (Suzuki et al., 2002). The frequent environmental variability they are subjected to results in naturally stressed ecosystems (P´erez-Ruzafa et al., 2013). Generally environmental fluctuations generate resilient communities and the resistance of the composing macrobenthic communities of lagoons is considered high (Munari et al.2005). Some coastal la-goons are found to be highly productive, supporting a diverse benthic community serving as food resource for fish (Gamito et al., 2003). On the other hand, others submitted to excessive anthro-pogenic stress might undergo regime shifts resulting in an extremely low diversity and a dominance by detritivores (Gamito 2006). Anthropogenic pressures include fishing and other urban, industrial and agricultural activities (Gamito 2008). Eutrophication also continues to be a major threat; at times thresholds are exceeded with excessive nutrient loading resulting in an irreversible shift to a macroalgae dominated ecosystem (Pereira Coutinho et al., 2012; Viaroli et al., 2008). In this case the seasonal and inter annual variation combined with spatial variability of coastal laggons make the implementation of an effective management framework particularly challenging (Pusceddu et
al.2007). For example the restoration of the recruitment potential in degraded lagoons is difficult
(Beer and Joyce 2013).
Resistance and recovery time are concepts essential for effective management, and require an as-sessment of the current and previous state of the ecosystems supported by empirical evidence (El-liott et al., 2007). In the North Atlantic surveys of coastal lagoons have been published in the grey literature, but data deficiency continues to challenge the successful management of these environ-ments and the preservation of the valuable ecosystem and socio-economic services they represent (Beer and Joyce 2013). On the other hand, in Great Britain, an overview of a wide variety of la-goons allowed the establishment of general guidelines to maintain diversity (Bamber et al., 1992). In Brazil the data of long-term monitoring of physical, chemical and biological variables was used to test for the degree of temporal coherence among 18 tropical coastal lagoons in search of com-mon patterns and mechanisms (Caliman et al., 2010). The Portuguese coast is characterized by
opening during the dry season to promote water exchange and assure its water quality (Cancela da Fonseca et al., 1999; Costa et al., 2003; Carvalho et al., 2011). A single narrow entrance is created, and natural closure occurs after a variable number of days. Most coastal lagoons receive water and organic matter from their basin during the winter (Bamber et al., 1992). When opened, water re-newal prevents eutrophication and drains the nearby alluvial plains for agriculture (Freitas et al., 2008). However when the connection with the sea is established, radical alterations in physico-chemical conditions take place with the reduction of the water volume and the salt water influx (Suzuki et al., 2002). Little attention has been payed to the effect this might have on the spatiotem-poral evolution of the macrobenthic community (Costa et al., 2003; Carvalho et al., 2011). Also the dynamic sedimentary conditions during the opening are relevant as in deposition of dredged material, where they might affect resident biota (Angonesi et al.., 2006).
The timing and duration of the opening for example are essential as the structure of the mac-robenthic communities might be affected, as extended periods of closure have been associated with anoxia and biotic stress (Quintino 1988). One way of assessing the state of an ecosystem and its potential recovery is by analysing the evolution of univariate metrics, such as diversity and abundance, and their relationship to environmental variables (Schaffner 2010). Furthermore identification of key factors controlling the rates of recovery from different kinds of anthropogenic disturbances is important for ecosystem restoration efforts (Elliott et al.2007). This paper con-tributes to the progress of research on North Atlantic lagoon systems by assessing the state of a small lagoon along the coast of Portugal. Secondly the spatiotemporal evolution of the mac-robenthic community is assessed specifically in response to the current management practice of its artificial opening.
2.2
Material and Methods
2.2.1
Site and sample design
Figure 2.1:Location of the lagoon of Melides along the coast of Portugal with detail of the sample sites (1-6) and an indication of the major vegetation types
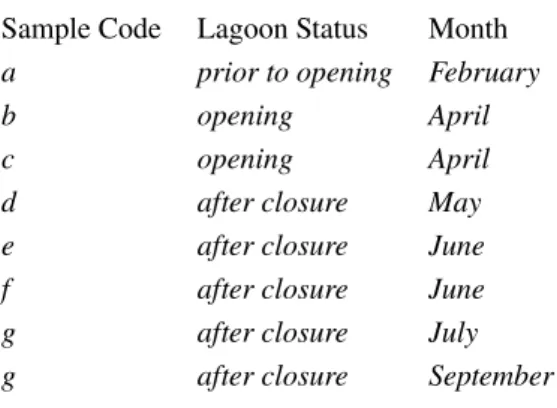
The sampling was carried out in Melides, a small coastal lagoon situated 20 km North of Sines on the South-West coast of Portugal (figure 2.1). It occupies an elongated-flooded surface of 0.4 km2 and has an average depth of 2 m. The freshwater input is located 14 km upstream and the lagoon receives water from a basin area of 63 km2. Most of the time the lagoon is separated from the sea by a sand bar. In 2008, under the request of local rice-farmers, Melides was artificially opened twice, with a two-week interval. After each opening, the lagoon was subjected to the tidal regime of the sea for an average of five days, whereafter natural closure occurred (Freitas et al., 2008). To capture both temporal and spatial variability of the macrobenthic community, six stations (1-6) were sampled from February until September (figure 2.1 - table 2.1). The stations were located at an increasing distance from the sea: 40, 250, 400, 800, 1000, 1300 meters for 1, 2, 3, 4, 5 and 6
Table 2.1:Lagoon status and sampling time
Sample Code Lagoon Status Month
a prior to opening February
b opening April
c opening April
d after closure May
e after closure June
f after closure June
g after closure July
g after closure September
were taken with a Van Veen grab (surface: 0.05 m2). They were handled standardly being sieved through a 500 µm square mesh. The retained material was fixed in 4 % buffered formalin stained with Rose Bengal. Species were determined up to the lowest taxonomic level possible. For each station a multi-parametric sonde was deployed to obtain salinity (measured in PSU), temperature (oC), dissolved oxygen (D.O., mg/l), pH and Eh (reduction potential, mV) at the bottom. The water transparency was empirically assessed by the Secchi dish method (SD, m) (Chambers and Kaiff,1985). In the first sampling campaign, additional grab samples were collected for sediment grain size assessment. Grain-size analysis was undertaken by standard sieving on sediment coarser than 63 µm and the undersized fraction was studied by using a Malvern laser particle analyser. The classification was done according Larsonneur (1977). For station 5 no environmental data was available.
2.2.2
Data analysis
Data analyses were carried out using the R-software version (R. development core team 2014). A log transform (+1) was applied on the densities and used for all further statistics, to obtain a log-normal distribution (Le Pape et al., 2004). The means of the log transforms and their respective standard errors were represented graphically on a log-scale (Le Pape et al.2004). To test for signifi-cant spatiotemporal differences in the evolution of the macrobenthic community two-way analyses of variance (2-way anova) with the factors ‘Time’ (sample periods a-h) and ‘Station’ (sample sta-tions 1-6) were used (Venables and Ripley 2002). The test was run for each taxon individually.
Likewise 2-anovas were performed on the abiotic variables. In case of significant spatiotemporal differences on both parameters combined a trend surface approximated by a polynomial expansion of the control points, was fitted covering the entire lagoon over time. The contour plots depict the variation of the time of the lagoon system. The polynomial function was generated by the method of least squares ensuring minimum deviations (Venables and Ripley 2002):
f (x, y) = X r+s<p
arsxrys (2.1)
with:
p = order of the polynomial, here p = 3
ars = polynomial coefficients calculated by .R function: surf.ls xr = sample periods
ys = distance from the sea (equivalent sample stations) To test for significant differences in faunal density associated to granulometry, a one-way anova was performed on each taxon with categorised granulometric data. The following three classes were considered: sand percentage >90%, between 70 and 90%, and < 30%.
2.2.3
Multivariate analysis
A principal component analysis (pca) was carried out on the covariance matrix of environmental variables and log-biotic density, and represented in a biplot (Gabriel 1971). Prior to running the pca, redundancy was assessed by Pearson correlation coefficients: for pairs with a significantly high correlation one of the variables was discarded (Tabachnick and Fidell 2007). In addition a multivariate analysis of variance (manova) was used to test for significant influence of the envi-ronmental variables on the macrobenthic community as a whole (Tabachnick and Fidell 2007).
2.3
Results
2.3.1
Spatiotemporal variability of benthic community
Figure 2.2:Significant results of 2-way anova’s (factor ‘sample and station’) on faunal densities(#/m2mean ±SE) presented on a logarithmic sale: spatiotemporal evolution of bivalvia n.i. (stations 1:5), chironomidae over sample periods and H. ulvae, H. diversicolor and ostracoda in stations (p-values, MS and F see table 2.2)
The seven taxa encountered were: chironomidae n.i., H. ulvae (Pennant 1777), H. diversicolor (Muller 1776), L. rugicauda (Leach 1814), Bivalvia n.i., oligochaeta and ostracoda. Oligochaeta only occurred once in low abundance two weeks after the second opening (6#/m2in d). The 2-way
anova’s revealed that chironomidae varied significantly only over time (p=***, MS and F and see table 2.2). Before any opening their density was 198±74#/m2, dropping to 1±1#/m2 after the opening, whereafter a recovery occurred to 79±40 #/m22.5 months later (h) (figure 2.2). Bivalvia n.i. varied significantly with the interaction of time and space (p=***, MS and F and see table 2.2). Before the opening (a), the maximum density was 3#/m2 in station 1 and afterwards in all stations the highest abundance was obtained 1.5 months after the second opening (12#/m2 in station 3; figure figure 2.2). The density of N. diversicolor, H. ulvae and ostracoda showed significant differences only between the stations (p=***, p=* , p=*** resp.; MS and F see table 2; figure figure 2.2). N. diversicolor had the highest abundance in station 1 closest to the sea (8±3#/m2) whereas in the other stations its abundance stayed low (< 2#/m2). Ostracoda had the highest abundance (33±20#/m2) in station 5. H. ulvae was most abundant in station 1 and 5 (2±1#/m2 and 3±2 #/m2 resp.).
2.3.2
Spatiotemporal variability of environmental variables
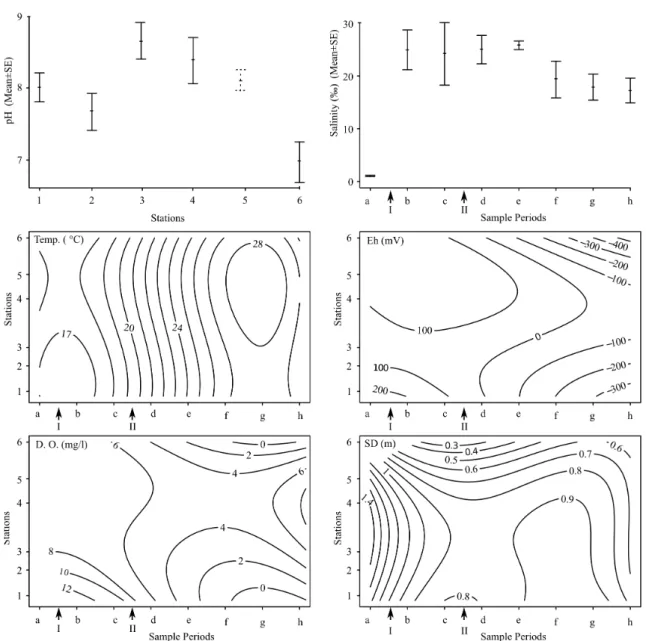
Associated to the artificial opening of the lagoon, salinity varied significantly over time (p=***, MS and F and see table 2.2; figure 2.3). Before the opening of the lagoon it was low, on aver-age 1.10±0.1 (figure 2.3). After the inflow of seawater, salinity in the lagoon increased directly to 24.95±7.38, gradually decreasing afterwards to 17.24±4.59 after five months (h). The acidity differed significantly between the stations (p=***, MS and F and see table 2.2). On average station 6 is acid with pH=6.97±0.28, whereas the other stations have basic pHs ranging from 8.38±0.25 in station 3 and 7.67±0.26 in station 2. Temperature, D.O., Eh and SD varied significantly spa-tiotemporally (respective p-values, MS and F and see table 2.2). Before the opening of the lagoon the average D.O. was maximum 8.3mg/l in station 1, after the opening oxygen levels increased all over the lagoon (see figure 2.3). Over time the stations in the extreme ends of the lagoon became oxygen depleted, whereas after five months in the middle section (station 4 and 5) the oxygen level reached values similar to the onset of the sampling program.
Figure 2.3:Significant results of 2-way anova’s (factors ‘sample period’ and ‘station’) on environmental parameters: pH in stations (mean ±SE), salinity (ppt) over sample period (mean ±SE), and spatiotemporal contour plots of Eh (mV), temperature (0C), D.O. (mg/l) nd Secchi Depth (SD, m) (p-values, MS and F see table 2.2)
Before opening, average temperature varied around 170C, with a gradient of 10C from the front (seaside) to the back of the lagoon, then, the temperature increased during spring and summer to peak to 290C in the end of the sampling period. In general Eh decreased over the sample period. In the first 3 campaigns, the gradient of Eh over all the stations remained fairly constant with a maximum in station 5 (200.00mV) and a minimum in station 1 (78.50mV). From sample May on-wards, Eh manifested higher values in the mid section of the lagoon (39mV and -46mV in station
3-4 resp.) than at both extreme ends of the lagoon (-355mV and -423mV in station 1-5 resp.). Sec-chi depth was homogeneous throughout the lagoon before its opening. After the opening, the mid section stations maintained a relatively high SD fluctuating around 0.8 m in stations 3-5 whereas in station 1 and station 5 SDs dropped with 0.2m and 0.3m respectively.
Table 2.2:Lagoon status and sampling time
Factor Factor 1-way
Time Station Granul.
MS F P MS F p MS F p Temp 98 99.0 *** 3.65 3.89 ** - - -Sal 330 6.32 *** - - - -pH - - - 33.37 9.35 *** - - -D.O. 40.76 7.72 *** 19.21 3.69 - - -Eh 100159 8.10 *** 60212 4.87 ** - - -SD 0.25 7.55 *** 0.33 9.88 *** - - -Biv. n.i. 2.90 4.61 *** 3.41 5.44 *** - - -H. div - - - 3.99 2.81 * - - -H. ulvae 1.05 2.39 *** - - - 2.19 5.47 ** Chiron. 6.03 1.50 *** - - - -L. rugic. - - - -Ostracoda - - - 10.03 6.47 *** - -
-2.3.3
Multivariate analysis
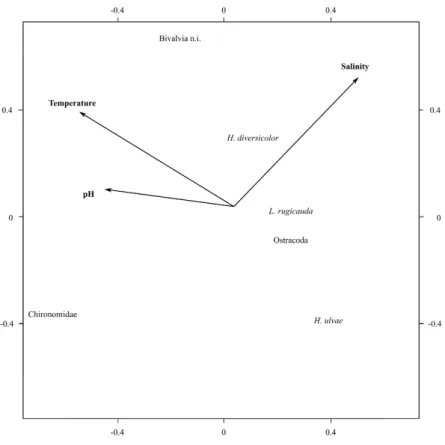
D.O. correlated significantly to Eh and Temp. (r=0.80 and r=-0.60 resp. with p=***) and SD to pH (r=0.43 with p=*). The pca biplot thus only includes salinity, pH and temperature.The first two axes of the pca analysis accounted for 89% of variability (figure 2.4). Salinity and temperature are the two variables structuring most the macrobenthic community. The biplot shows a clear affinity of chironomids with less saline waters, confirmed by a significant relation of their abundance with salinity in the manova (p=***, MS= 76.24, F= 21.36). H. ulvae has the highest abundances with relatively lower temperatures equally confirmed by the manova (p=*, MS=2.74, F=7.88 and p =**). It is also the only taxon that varied significantly with the sediment classes characterized by higher abundances in sandy stations (see table 2.2).
Figure 2.4:Biplot of principal component analysis with arrows representing environmental variables.
2.4
Discussion
2.4.1
Structure of macrobenthic community and ecological status
Features of stressed benthic infaunal communities include presence of r-strategists, high abun-dances of a few species and low diversity (Elliott and Quintino 2007). H. ulvae and chironomids are reported to behave as typical r-strategists, the first in strongly eutrophied areas (Lillebo et al., 1999; Cartier et al , 2011). Even before its opening, it can thus be concluded that the ecological status of the Melides lagoon is poor; confirmed by its extreme low diversity and the dominance by one taxa (chironomids) (Felix et al., 2013).
In other coastal lagoons, salinity was the main environmental factor influencing the benthic com-munity (Blanchet et al., 2005; Pech et al., 2007). For Melides the same was found especially throughout chironomid’s affinity for decreasing salinity. H. ulvae’s growth rate has been linked
to temperature with lower growth rates during winter (Lillebo et al., 1999), this might relate to the negative correlation of H. ulvae with temperature in the present study. For that species food supply measured by algal biomass, has been the most important factor structuring its population (Lillebo et al., 1999; Drake and Arias 1997). Here this might be reflected in the higher H. ulvae abundance in a station for which an elevated macro algae cover as previously reported in Antunes
et al., (2012).
Impoverished macrobenthic communities comparable to Melides have been observed in lagoons suffering from severe environmental stress by organic over-enrichment of sediments: in Italy for example only 7 of 22 taxa accounted for 94% of total abundance in a eutrophied lagoon (Como and Magni 2009). Low diversity has also been observed in other lagoons in Portugal (Cancela da Fonseca et al., 1999; Carvalho et al., 2005; Drake and Arias 1997). However in the 80’ties a survey in Melides reported 94 taxa (Costa et al., 2003). Although a mitigation of the anthropogenic pres-sure on Melides was attempted since then (e.g. the construction of a sewage treatment plant and a reduction of urban occupation), its species richness decreased dramatically resulting in a poor ecological status (Felix et al., 2013). Related to this 20 year knowledge gap, it is challenging to assess possible causes of this drastic reduction or pin point when the regime shift occurred. How-ever punctual anthropogenic contaminations have been observed in the hydrogeological system of the Sines basin and were linked to run-off and pesticides from agricultural activities resulting in at times peak concentrations of sulphate and nitrate (Fernandes et al., 2005). Punctual impacts can indeed result in massive mortalities; and combined with continuous physicochemical stress, may maintain the diversity at a low level (Gamito 2006). Water bodies with high residence time, such as Melides, are also characterized by extreme environmental variations over short time frames (Gamito 2008). Degraded water quality combined with enhanced nutrient input may lead to eu-trophication in certain parts of the lagoon and ultimately to anoxic events (Afli et al., 2009). The stratification enhanced by temperature, can contribute to the severe bottom-anoxia amplifying the temperature/DO coupling. (Quintino, 1988), Low oxygen values and excessive amounts of decay-ing algae are recognised symptoms of eutrophication, both of which were observed in Melides (Antunes et al., 2012). The eutrophied status of Melides is also confirmed by the high biomass
linked to their resistance to oxygen depletion (Callisto et al., 2002; Viaroli et al., 2008).
2.4.2
Artificial opening as management practice?
The double opening did not result in the colonisation of marine species and only one resident taxon recovered 5 months later. The absence of suitable conditions for recruitment could be an important factor maintaining diversity low in Melides (Felix et al., 2013). Normally an increased marine water influence enhances the number of incoming species and facilitates the establishment of well structured communities in lagoons (Gamito 2006; Tlig-zouari et al., 2009). The number of marine spawning species able to colonize lagoons depends upon the frequency, duration and the timing of the opening is established (Griffiths 1999). Despite the potential for recruitment depending also on stochastic elements (Beer and Joyce 2013), temperature might already provide a straightforward indication. For example H. diversicolor first gametes release is induced by a temperature rise (50C) in early spring and may be limited to a short period (Bartels-Hardege and Zeeck 1990). Melides opening coincided with this spring rise in temperature. It is possible that if Melides had been opened earlier in the year, their spawning, reproduction and thus recovery could have been more successful. The same accounts for H. ulvae characterized by at least one reproductive peak in spring (Lillebo et al., 1999). The timing of opening is even more crucial for
L. rugicauda, as this species reproduces only once a year, in discrete periods initiated by triggers
such as lunar cycles (Barnes et al., 1993).
It should also be considered to artificially maintain the lagoon open for longer periods instead of opting for its natural closure. This would allow ample time for both water renewal, resulting in the drainage of the water of the lagoon into the sea, a loss of total organic nitrogen and an increase of total phosphorus (Branco et al., 2007). The ´Obidos lagoon is an example of a Portuguese lagoon where practitioners applied this management practice and reported an improvement in water quality (Pereira Coutinho et al., 2012). Furthermore a comparative analysis of the macrobenthic commu-nity of ´Obidos and Albufeira, revealed that frequent closure of the latter caused water stratification with anoxy forcing a regime shift to an impoverished community similar to Melides (Quintino 1988).
ex-tent: for example to increase flushing changing the lagoon’s boundaries is effective (Elliott et al., 2007). Increased runout and more effective flushing might also be obtained by dredging additional inlets instead of only one main channel while planing the artificial opening to coincide with max-imum difference of water levels of the lagoon and the sea (Newton and Mudge 2005). Continuous monitoring of Melides generating a more extensive dataset is essential for the determination and implementation of an effective management plan including other aspects of the lagoon biota, such as their avian fauna and fish community (Griffiths 1999).
Acknowledgements
We are grateful to Fundac¸˜ao para a Ciˆencia e a Tecnologia who funded the Phd candidate (fellow-ship reference: SFRH/BD/48402/2008). The first author also thanks her colleagues for support in the numerous field trips: P.R. Santos, Pais, M., Henriques, S. Prof. Freitas, M. C and Dr. Cruces, A. of the Geology Department of the Faculdade de Ciˆencias da Universidade de Lisboa are also thanked for kindly providing certain abiotic data and logistic support on the sample campaigns.
References
Afli, A., Chakroun, R., Ayari, R., Aissa, P., 2009. Seasonal and spatial variability of the community and trophic structure of the benthic macrofauna within Tunisian lagoonal and marine coastal areas (Southwestern Mediterranean). Journal of Coastal Research 25, 1198-1209.
Angonesi, L. G., Bemvenuti, C. E. and Gandra, M. S.; 2006. Effects of dredged sediment disposal on the coastal marine macrobenthic assemblage in Southern Brazil. Brazilian Journal of Biology 66: 413-420.
Antunes, C., Correia, O., Marques da Silva, J., Cruces, A., Freitas, M., Branquinho, C., 2012. Factors involved in spatiotemporal dynamics of submerged macrophytes in a Portuguese coastal lagoon under Mediterranean climate. Estuarine, Coastal and Shelf Science 110, 93-100.
Bamber, R.N., Batten, S.D., Sheader, M., Bridgewater, N.D., 1992. On the ecology of brackish water lagoons in Great Britain. Aquatic conservation marine and freshwater ecosystems 2, 65-98.
Barnes, R.S.K., Calow, P., Olive, P.J.W., 1993. The invertebrates: a new synthesis. Oxford: Blackwell Science Ltd. 488p.
Beer, N.A., Joyce, C.B., 2013. North Atlantic coastal lagoons: conservation, management and research challenges in the twenty-first century. Hydrobiologia 701, 1-11.
Blanchet, H., de Montaudouin, X., Chardy, P., Bachelet, G., 2005. Structuring factors and recent changes in subtidal macrozoobenthic communities of a coastal lagoon, Arcachon Bay (France). Estuarine Coastal and Shelf Science 64, 561-576.
Branco, CWC., Kozlowsky-Suzuki, B. and Esteves, FA.; 2007. Environmental changes and zooplankton temporal and spatial variation in a disturbed brazilian coastal lagoon. Brazilian Journal of Biology 67(2): 251-262.
Caliman, A., Carneiro, L.S., Santangelo, J.M., Guariento, R.D., Pires, A.P.F., Suhett, A.L., Quesado, L.B., Scofield, V., Fonte, E.S., Lopes, P.M., Sanches, L.F., Azevedo, F.D., Marinho, C.C., Bozelli, R.L., Esteves, F.A. and Farjalla, VF.; 2010. Temporal coherence among tropical coastal lagoons: a search for patterns and mechanisms. Brazilian Journal of Biology 70: 803-814.
Callisto, M., Moreno, P., Gonc¸alves, J.F.J., Leal, J.J., Esteves, F.A., 2002. Diversity and biomass of chi-ronomidae (Diptera) larvae in an impacted coastal lagoon in Rio de Janeiro, Brazil. Brazilian Journal of Biology 62, 77-84.
Cancela da Fonseca, L., Costa, A.M., Magalhae, F., Cristo, M., 1999. The benthic marcoinvertebrate comunity of lagoa Da Sancha: a coastal lagoon in SW Portugal. Limnetica 16, 39-48.
Cartier, V., Claret, C., Garnier, R., Franquet, E., 2011. How salinity affects life cycle of a brakish water species, Chironomus salinarios KIEFFER (Diptera: Chironomidae). Journal of Experimental Marine Biology and Ecology. 405, 93-98.
Carvalho, S., Moura, A., Gaspar, M.B., Pereira, P., da Fonseca, L.C., Falcao, M., Drago, T., Leitao, F., Regala, J., 2005. Spatial and inter-annual variability of the macrobenthic communities within a coastal lagoon (Obidos lagoon) and its relationship with environmental parameters. Acta Oecologica-International Journal of Ecology 27, 143-159.
Carvalho, S., Pereira, P., Pereira, F., de Pablo, H., Vale, C., Gaspar, M.B., 2011. Factors structuring temporal and spatial dynamics of macrobenthic communities in a eutrophic coastal lagoon (Obidos lagoon, Portugal). Marine Environmental Research 71, 97-110.
Chambers, P.A., Kaiff, J., 1985. Depth Distribution and Biomass of Submersed Aquatic Macrophyte Com-munities in Relation to Secchi Depth Canadian Journal of Fisheries and Aquatic Sciences 42, 701-709. Como, S., Magni, P., 2009. Temporal changes of a macrobenthic assemblage in harsh lagoon sediments.
Estuarine Coastal and Shelf Science 83, 638-646.
Costa, A.M., Cristo, M., Cancela da Fonseca, L., 2003. Annual cycle of the benthic community of a coastal lagoon: Lagoa de Melides (Grˆandola, SW Portugal). Revista de biologia 21, 71-89.
Drake, P., Arias, A.M., 1997. The effect of aquaculture practices on the benthic macroinvertebrate com-munity of a lagoon system in the Bay of Cadiz (southwestern Spain). Estuaries 20, 677-688.
Elliot, M., Burdon, M., Hemingway, K.L., Apitz, S.E., 2007. Estuarine, coastal and marine ecosystem restoration: confusing management and science A revision of concepts. Estuarine Coastal and Shelf Science 74, 349-366.