Access to private higher education in Brazil: empirical analysis of growth with
panel data (1995-2017)
Acesso ao ensino superior privado no Brasil: análise empírica do crescimento
com dados em painel (1995-2017)
DOI:10.34117/bjdv6n2-135
Recebimento dos originais: 30/12/2019 Aceitação para publicação: 13/02/2020
Fabiano Roberto Santos de Lima
Mestre em Economia e Gestão Empresarial Instituição: Centro Universitário Geraldo Di Biase
Endereço: Rua Antenor de Moura Raunheitti, 152 - Nova Iguaçu – RJ, 26260-050, Brasil E-mail: fabianosdelima@gmail.com
Marcelo Cosme da Silva Maria
Mestre em Engenharia Cartográfica Instituição: Centro Universitário Geraldo Di Biase
Endereço: Rua Antenor de Moura Raunheitti, 152 - Nova Iguaçu – RJ, 26260-050, Brasil E-mail: posicao@yahoo.com.br
Jódiney Benedito Marques
Especialista em Gestão Pública Municipal Instituição: Universidade de Vassouras
Endereço: Av. Expedicionário Osvaldo de Almeida Ramos, 280 - Vassouras - RJ, 27700-000, Brasil
E-mail: jde_marques@yahoo.com.br
ABSTRACT
From the stabilization of the Brazilian economy that occurred in 1994 until the year 2017, there was a considerable increase in access to private higher education. Inclusive policies, that guaranteed access to higher education, increased the number of students in private undergraduate courses by 339% in the period analyzed. The economic stability achieved by the country since the decade of 1994 guaranteed better living conditions for Brazilians who, with educational stimuli, could rise in the escalation of formal university education. The aim of this article is to empirically verify how the improvement in Brazilian’s living conditions is related to access to private higher education. For this, the econometric strategy used was the panel data regression model for the time series of enrollments in higher education in the five major Brazilian regions. The variables that incorporate the living conditions of Brazilians in this study are the real wage, the cost of living, inflation and the unemployment rate. Evidence indicates that, in addition to inclusive policies, real wages and falling living costs were decisive for increasing enrollment in private higher education institutions. It was also revealed that unemployment and inflation in Brazil did not bring about effects that would generate disinterest in the population in attending a university, which was supported by the educational incentives carried out in the country.
RESUMO
Da estabilização da economia brasileira ocorrida em 1994 até o ano de 2017, houve um aumento considerável no acesso a cursos particulares de graduação. Políticas inclusivas, que garantiam acesso ao ensino superior, aumentaram em 339% o número de estudantes em cursos particulares de graduação no período citado. A estabilidade econômica alcançada pelo país a partir da década de 1994 garantiu melhores condições de vida aos brasileiros que, com os estímulos educacionais, poderiam subir na escalada da formação educacional. O objetivo deste artigo é verificar empiricamente como a melhora nas condições de vida do brasileiro se relaciona com o acesso ao ensino superior privado. Para isso, a estratégia econométrica utilizada foi o modelo de regressão de dados em painel para as séries temporais de matrículas no ensino superior nas cinco grande regiões Brasileiras. As variáveis que incorporam as condições de vida dos brasileiros neste estudo são o salário real, o custo de vida, a inflação e a taxa de desemprego. As evidências indicam que, além das políticas inclusivas, o salário real e a queda no custo de vida foram decisivos para o aumento das matrículas em instituições privadas de ensino superior. Também foi revelado que o desemprego e a inflação no Brasil não trouxeram efeitos que gerassem desinteresse na população em frequentar uma universidade, o que foi suportado pelos incentivos educacionais realizados no país.
Palavras-chave: acesso ao ensino superior; matrículas; melhoria nas condições de vida; dados do
painel.
1 INTRODUCTION
Access to higher education in Brazil presented exponential growth over the past twenty-two years. Only in Higher Education Institutions (IES), when observed the number of enrollments that were made in 1995 compared to the number of undergraduate students in 2017 saw a 339% increase. Admission to courses of all categories and to all types of IES (colleges, university centers and universities) had a steep increase, of which, especially, the overwhelming majority took place in private institutions (De Negri; Araujo & Bacelete, 2018).
Increasing enrollment data over time can be economic moment that the country went through after stabilization of its currency in the economy from 1994. The economic growth of a country is, without a doubt, a central point for the improvement of the living conditions of the society and the recovery of the economy in this period. In particular, it was accompanied by some structural reforms, such as the Social Security Reform in the private sector, the fiscal adjustment based on the Fiscal Responsibility Law and the adoption of a flexible exchange rate regime. These measures can improve the business environment by increasing the number of jobs created from 1994 to 2000.
Naturally, these actions to ensure economic stability coupled with the commitment of the federal government improved expectations for the future, both by entrepreneurs and families, which led to an increase in investments and aggregate consumption, generating an expansionary movement of growth in the economy. It happens that the national economy is subject to cyclical effects and exposed to external shocks, more precisely to crises. Expectations being the fundamental engine to guarantee demand, it is reasonable to believe that the deterioration of expectations due to the
behavior, in which agents anticipate a future of difficulties, choose to create stocks of financial reserves and give up consumption. This scenario can also be associated with unemployment as a result of a crisis and economic policies that, on a cyclical basis, severely affect society and still serve as a brake on consumption.
Given the improvements in the quality of life of Brazilians, the increase in income through minimum wage policies and also purchasing power, at the same time, begins the implementation of several affirmative educational policies that ultimately improve the results of the access to higher education, particularly in private institutions.
There is a lack in the Brazilian literature related to quantitative studies that address educational development associated with empirical evidence of socio-economic development, precisely the increase in college entrants. In order to contribute to the discussion, this material goes in this direction and points to the existence of a relationship between economic indicators and increase in the entry of third degree courses.
Taking as hypothesis the idea that higher education becomes an object of consumption that is governed as the law of demand for goods and services in society, The aim of this article is to empirically verify how the improvement in Brazilian’s living conditions is related to access to private higher education. For this, concepts and econometric tests were used from a panel data regression model for the time series of enrollment in higher education in the five regions of Brazil, North, Northeast, Southeast, South, and Midwest. The variables that incorporate the living conditions of Brazilians in this study are the real wage, the cost of living, inflation and the levels of unemployment.
2 EMPIRICAL LITERATURE
As noted by Araujo & Carvalho (2012), from the 1990s onwards, there has been a sharp reduction in the State's financing of public higher education institutions, which has led to the indiscriminate growth of private IES. Data from National Institute for Educational Studies and Research Anísio Teixeira - INEP (2010), point to the result that 74% of all undergraduate enrollments in Brazil correspond to the private sector and much of this result is due, in recent years, especially to initiatives for access to higher education such as the Program University for All (ProUni), the Student Financing Program (Fies), the Federal Universities Restructuring and Expansion Plans Support Program (Reuni), as noted by Barros, (2015). These policies have gained progress since the last decade, and points to the effects of reducing inequalities of access (Salata, 2018). This
situation led private institutions to be the main responsible for higher education in Brazil, because the public school system, although also showing results of increase in enrollments, grew less in relation
to private schools (Loch & Reis, 2004; Sguissardi, 2006; Barros, 2015; De Negri, Araujo and Bacelete, 2018).
From a certain perspective, access programs were income distribution policies, as they transferred financial resources to the poorest sections of the population (Corbucci, 2004). It is also possible to find authors who consider that the higher education system along the lines of access presented here promote more inequality. The central idea is that since the population with lower purchasing power, because they have poorer high school educational bases, cannot access public schools, which are more competitive, the quality is higher, and thus they are relegated, seeking training in private institutions in courses with less qualified teachers and that will offer lower quality courses when compared to public institutions (Araujo & Carvalho, 2012).
Far from this discussion, the truth is that, from a macroenomic point of view, it can be understood that this increase in enrollments, although supported by the educational policies mentioned, was driven by the increase in income and employment. Several authors agree that low unemployment rates are associated with the growth of a country (Russel & Teaser, 1988; Valentine, 1993; Dogan, 2012; Folanewo & Adeboje, 2017) and it is important to highlight that the growth and stabilization of the economy create positive expectations confidence in better living conditions in the future.
One way to quantitatively investigate the dependency relationships between social and economic variables is to use econometric tools. These are usually used to verify such dependency relationships and estimate their outcomes. In this study we chose to use panel data because it is possible to combine time series with cross-sectional data. Baltagi (2005), comments that this method provides more informative data, more variability and less collinearity between variables. Thus, it is possible to analyze in a single model the behavior of the dependent variable, in this case the number of students enrolled in higher education and the independent variables, for all observations, in the surveyed period.
3 MATERIAL AND METHODS
3.1 TIME SERIES
This study follows the hypothesis that real wages, the level of unemployment, the cost of living and inflation are determining factors for entering proved schools. The Equation 1 describes the hypothesis presented below:
where Enrt represents the entry of students in private higher education, WRt is the real wage, Unt
represents the unemployment rate, CLt is the cost of living, and Inft is the inflation captured in each
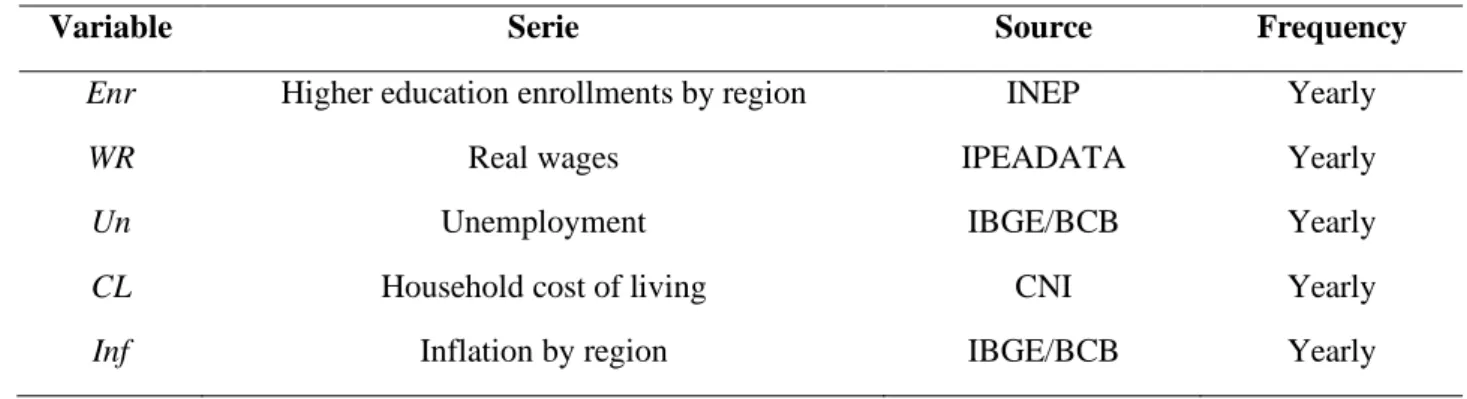
region. The data are annual between 1995 and 2017 and the Table 1 details the study variables.
Table 1 - Description of variables used
Variable Serie Source Frequency
Enr Higher education enrollments by region INEP Yearly
WR Real wages IPEADATA Yearly
Un Unemployment IBGE/BCB Yearly
CL Household cost of living CNI Yearly
Inf Inflation by region IBGE/BCB Yearly
Source: The Author’s.
Enrollments (Enr) - Data on the number of students entering private higher education courses were collected at INEP's own electronic site and are distributed across the five Brazilian regions: North, Northeast, Southeast, South and Midwest. They add up to the total number of admissions per selection process and other forms of access in on-site and distance-learning undergraduate courses including bachelor's degree, undergraduate and technologist courses. From Figure 1 it is possible to verify the behavior of the variable that measures the number of students enrolled in higher education courses in the various regions of Brazil.
Inflation (Inf) – Inflation is obtained from the monthly variation of the Extended National Consumer Price Index (INPC), which includes families with an income of 1 to 8 minimum wages. Inflation data were also obtained from the Brazilian regions and the series are available on the website of the Central Bank of Brazil (BCB), where the 13076 series is the inflation of the State of Pará that serves as a proxy for inflation in the North, a since this was not measured in the period comprising this study; the 13921 series is inflation in the Northeast region; 13585 series is the inflation of the Southeast region; series 12661 is the inflation in Porto Alegre, which serves as a proxy for inflation in the South region; and finally, the 13951 series, which presents inflation in the Midwest region of the country. All series were adjusted to their median 12-month results, so that they became annual.
Real Wages (WR) – The series is obtained from the national nominal minimum wage value deflated by the INPC. The data are available from the Institute of Applied Economic Research (IPEA).
Unemployment (Un) – The unemployment series used are 1620 and 24369 from BCB. The series underwent a change in methodology from 2012, during which time data were computed in the two series and thus maintained until early 2016, and thereafter old series was discontinued. Thus, it was necessary to adjust the series from the average of the ratios of the results obtained by the old method and the most recent one for the period before 2012.
Cost of Living (CL) – The cost of living can be understood as the sum of the prices paid for the various goods and services that people consume. To calculate the cost of living, and its variation over time, account is taken of parameters such as the range of income to be measured, the impact of each item (product or service) on consumers, and the geographic coverage. The series is measured by Intersindical Department of Statistics and Socioeconomic Studies (DIEESE) and is available on the BCB website under number 194.
It is also worth noting that a log-log model is used in this study because of its better adaptation to the data used. Gujarati & Porter (2011) states that this model enables the interpretation of results through the elasticity of the dependent variable as a function of a percentage change in the independent variable. Thus, each series was converted to its logarithmic specification.
To assess the impact of better living conditions on the number of enrollments in higher education, each region was analyzed, as the policies adopted regionally, or the cost of individual living and the level of development in each location results different effects on overall performance. Another important point is the fact that in IES the period with the largest number of newcomers occurs in the first half of the year. It is well known that, naturally, society tends to increase its consumption in the months of November and December, extending until the month of February of the following year. Much of this is due to the fact that in these periods the company accrues much higher income than usual due to the receipt of additional wages and vacation payments guaranteed by Brazilian labor law. It is a reasonable idea that, therefore, at the beginning of a new year a student may apply to attend undergraduate studies at an IES and, after a few months, lock up their enrollment, returning to later periods. This would increase the result obtained by INEP, since the indicator does not seek to exclude those returning to the courses.
This in itself may be a limitation to the work and therefore a seasonal adjustment has been made to the Enr series to reduce this effect.
Figure 1 - Higher education enrollment evolution in Brazilian regions
Source: Author´s computation based on survey data.
3.2 THE EMPIRICAL MODEL
There is no established model that relates the variables addressed in this study. Thus, the construction of a model incurs risks of specification problems. The panel method, which combines cross-sectional data with time series, makes it possible to eliminate effects of omitted variables. In addition, the method has the advantage of allowing to disregard and contrast assumptions implicit in the cross-section analysis. To this end, the model presented in Equation (1) describes the proposed relationship of variables. The proposed panel model is balanced, ie it has the same number of observations for each sectional unit, where the cross-section units (i=1,..., n) have n>1 and
periods (t=1,... T) T>1 (Johnston & Dinardo, 2001; Wooldridge, 2001):
yit = Xjitβ + εit (2) 0 50,000 100,000 150,000 200,000 250,000 300,000 96 98 00 02 04 06 08 10 12 14 16 North 0 200,000 400,000 600,000 800,000 1,000,000 96 98 00 02 04 06 08 10 12 14 16 Northeast 500,000 1,000,000 1,500,000 2,000,000 2,500,000 96 98 00 02 04 06 08 10 12 14 16 Southeast 100,000 200,000 300,000 400,000 500,000 600,000 700,000 800,000 96 98 00 02 04 06 08 10 12 14 16 South 0 100,000 200,000 300,000 400,000 500,000 96 98 00 02 04 06 08 10 12 14 16 Midwest
where yit is the dependet variable for the unit i at time t; Xjit is the value of the é o valor da j-th
explanatory variable for the unit i at time t (where there is j = 1,..., k); and εit, the error term for i-th
unit in t.
The analysis of the determinant factors of the entrance in private courses of higher education will be based on the econometric model to be estimated, in the stacked form, represented by equation 3:
Enrit = β0 + β1WRit + β2Unit + β3CLit + β4Infit + εit (3)
However, as previously mentioned, with the objective of smoothing the series variance and, thus, minimizing eventual problems of heteroscedasticity, we chose to use a log-log model, as Hilbert (2008) suggests. The econometric model that meets the specification of this article is described in Equation 4.
Log(Enrit)= β0 + β1Log(WRit)+ β2Log(Unit)+ β3 Log(CLit ) + β4 Log(Infit )+ εit (4)
4 ANALYSIS AND DISCUSSION OF RESULTS
4.1 SAMPLE STATISTICS
Table 2 reports the behavior of the variable Log(Enr) analyzed through the descriptive statistics of the sample over the years 1994 to 2017. Data are presented by Brazilian regions. The results show that the North region presented the lowest growth performance of students entering private undergraduate courses compared to other regions of the country. The Southeast region was the one that most attracted students to higher education, followed by the South. Interestingly, these two regions are those with the highest income generation and whose population has the highest purchasing power in the federation.
Another important data to be observed is the coefficient of variation of the regions. Obtained from the quotient between the standard deviation of the results and the sample mean, the coefficients with the lowest variability around the mean were those of the Southeast and South, while those with the highest variability were the North and Northeast accompanied by the Midwest.
Table 2 - Statistical analysis of enrollment by Brazilian’s region
North Northeast Southeast South Midweast
Mean 145.112 450.165 1.725.502 521.692 278.060 Median 152.381 439.862 1.950.652 619.054 298.201 Maximun 287.779 900.488 2.456.228 720.807 451.805 Minimum 15.806 85.582 717.686 169.531 70.558 Std. Deviation 94.729 295.619 611.829 183.783 130.808 Jarque-Bera 1.853.106 1.948.559 2.459.013 3.548.282 1.832.311 Coef. of Variation 0,6528 0,6567 0,3546 0,3523 0,4704
Source: Author´s computation based on survey’s data.
This suggests that the North and Northeast regions are more susceptible to fluctuations in the number of students entering undergraduate courses. Possibly for reasons related to income and cost of living in the region and even the low education of the population in the region, which prevents them from taking advantage of access to higher education incentive plans.
4.2 CORRELATION ANALYSIS
In order to identify the degree of correlation between the study variables, the Pearson Correlation Matrix test was applied. Table 3 reveals the result of the matrix in which the data is already grouped for panel.
Table 3 - Correlation between the variables.
Log(Enr) Log(WR) Log(Un) Log(CL) Log(Inf)
Log(Enr) 1.0000
Log(WR) 0.6336 1.0000
Log(Un) 0.1887 0.0527 1.0000
Log(CL) -0.2791 -0.3709 -0.2665 1.0000
Log(Inf) -0.2244 -0.3512 -0.3030 0.8467 1.0000
Source: Author’s computation based on survey data.
As Callegari-Jacques (2003) suggests, the interpretation of the correlation matrix results in this study can be done as follows: the Log(WR) variable showed a strong positive linear correlation while Log(Un) revealed a weak linear correlation. The variable that expresses the cost of living revealed a weak correlation with the enrollment variable, which is negative, indicating that, if the cost
of living increases, conversely, there is a decrease in the number of aggregate enrollments in colleges. Same observation is obtained for the Log (Inf) variable.
4.3 ESTIMATION FOR PANEL DATA MODELS
There may be problems with panel data, such as those related to selection bias, ie errors resulting from selecting data that does not form a random sample. Thus, issues such as self-selectivity and lack of response or friction can be considered unobserved effects.
According to Wooldridge (2001), for the modeling of unobserved effects there are two possibilities: fixed effects and random effects. In the first one it is considered that the specific intercepts of each individual may be correlated with one or more regressors. In the case of random effects models the assumption is that the intercept of an individual unit is not correlated with explanatory variables. Importantly, since the unobserved effect is assumed to be random, this does not mean that the random effect would be the best estimate to adopt. In this case, considering that the variables are not correlated, the random effects method is the most appropriate. On the other hand, if unobserved effects are correlated with some explanatory variable, fixed effects estimation would be the most appropriate. Table 4 reports the result of panel data regression by ordinary least squares methods for fixed effects and random effects data.
Table 4 - Estimation of Results
Dependent Variable Log (Enr)
Variable Fixed Effects Random Effects
Log(WR) 2.4506*** 2.4505*** (0.1058) (0.1058) [23.1493] [23.1484] Log(Un) 0.6634*** 0.6633*** (0.1103) (0.1103) [6.0100] [6.0093] Log(CL) -0.1862* -0.1866* (0.1001) (0.1001) [-1.8597] [-1.8639] Log(Inf) 0.2071*** 0.2075** (0.1012) (0.1012) [2.0458] [2.0502]
(0.7537) (0.8850)
[-7.2482] [-6.1715]
Total Significance of the Models
R² 0.9388 0.8722
F-statistic 213.0360 196.3201
Prob (F-statistic) 0.0000 0.0000
Source: Author’s computation based on survey data.
Notes: Coeficient in bold. * Significant at 10%; ** Significant at 5%; *** Significant at 1%. Value between Parentheses ( ) denotes standard deviation; value in brackets [ ] denotes t-statistic.
Once the results of the regressions were obtained, the Hausman test (1978) was performed to select the most appropriate method, which verifies the existence of a correlation between the individual error components and the regressors and between the fixed effects tests and the Random effects.
The Hausman test reported in Table 5, with p-value of 1.0000, does not allow rejecting the null hypothesis that random effects are consistent. Thus, the selection indicated is the one that contemplates modeling by random effects.
Table 5 - Hausman Test – correlated random effects
Test summary Chi2 Chi2 d.f. p-value.
Random cross-section 0.0000 4 1.0000
Source: Author’s computation based on survey data.
Once the random effects modeling is defined, the estimated model below is based on the results of the statistical tests in Table 4.
Log(Emrit)= -5,46 + 2,45Log(WRit)+ 0,66Log(Unit)– 0,18Log(CLit ) + 0,20Log(Infit )+ εit
The regression showed an adjustment of 87% in changes in real wage, unemployment, cost of living and inflation, based on R². This means that all the variables together explain the level of enrollment in higher education courses at 87%. F-Test revealed that data groupings by categories are
significant. The null hypothesis argues that the variances of the series are the same, so the proposed grouping is not significant.
The equation presented above tested the hypothesis that the improvement of living conditions positively influenced the decision to enter private undergraduate courses. This hypothesis was supported by the random effects model in which it was observed that the 1% increase in real salary increased the number of college admissions by 2.45%.
Regarding unemployment, in the analyzed period it showed a positive relationship with enrollment. This reveals that, possibly, with the increase in unemployment, an alternative to the problem and also a way to differentiate themselves in the job market to become more attractive professionally, would be the entry into an undergraduate course. This is in line with the statement by Catani, Oliveira & Dourado (2001) that the formation and production of knowledge has become of fundamental interest for companies. Notably, policies that facilitated access to higher education could support such a decision, although there is a low increase of 0.66% for every 1 percentage point of change in unemployment levels.
By analyzing the impact of the cost of living related to entering a private college, it is observed that this variable has a very low negative relationship, but it still showed that when the cost of living rises, the decision to enter in the private college recede with a reduction of 0.18% every 1 percentage point in the cost increase.
Attention should be drawn to the fact that, taken together, inflation has had a low participation in enrollment composition over time. This relationship was positive in that there is evidence that the inflationary process increased by 1%, related to the 0.20% increase in enrollment. In this case it is also evident the difference between correlation and causality between the variables, being clear the perception that the financing policies and access to higher education were more stimulating to the entrance than the own economic situation of the country.
5 FINAL CONSIDERATIONS
This paper showed the empirical relationships that the conditions to improve the life of society, evidenced by real wages, unemployment, cost of living and inflation, impacted the decision to seek training and higher education in private institutions. In this study, we used data from private HEIs from 1994 to 2017 with series obtained by Brazilian regions in which it was identified that the regions that least benefited from the incentive policies to enter the 3rd degree courses were the North and the Northeast and the one with the greatest growth was in the Southeast region. It can be inferred that, possibly for reasons related to income and cost of living in the North and Northeast regions, and
even due to the low education of the population, the numbers were lower, which still does not minimize the progress in the educational level in the regions.
In general, motivated by the policies of access to higher education since 2004, by the increase in the number of IES, by the increase in the offer of courses and by the expansion of distance courses, the Brazilian population may receive incentives to qualify and improve their degree of study. The results pointed to the existence of significant relationships between the real salary and the cost of living with enrollments. The increase in salary positively impacted the number of enrollments, even with funding for students, while the increase in the cost of living causes a reduction in this decision, discouraging society.
Unemployment and inflation, variables whose expected relations were contrary to entering college, did not have a negative impact, which may be related mainly to the fact that the search for higher education is related to expectations of guarantee of employability and improving living conditions.
Thus, the educational policies presented here were important for people to enter colleges and universities, but the empirical evidence shows that other factors were determinant for the success of the program and the expansion of the number of people accessing an IES such as salary and cost of living.
REFERENCES
ARAUJO, G. J. F.; CARVALHO, C. M. Public education and the policies of access to Brazilian higher education in the Lula government. Revista Espaço Acadêmico. v. 11, n. 132, p. 166-174, 2012.
BANCO CENTRAL DO BRASIL – BCB. Time Series Manager System. Broad National Consumer Price Index - metropolitan region of Porto Alegre (12661 Series) https://www3.bcb.gov.br/sgspub/consultarvalores/consultarValoresSeries.do?method=consultarVal ores > Accessed on: 13 Oct. 2019.
________ Time Series Manager System. Broad National Consumer Price Index - metropolitan region
of Belém (13076 Series)
https://www3.bcb.gov.br/sgspub/consultarvalores/consultarValoresSeries.do?method=consultarVal ores > Accessed on: 13 Oct. 2019.
________ Time Series Manager System. Broad National Consumer Price Index - metropolitan region
https://www3.bcb.gov.br/sgspub/consultarvalores/consultarValoresSeries.do?method=consultarVal ores > Accessed on: 13 Oct. 2019.
________ Time Series Manager System. Broad National Consumer Price Index - metropolitan region
of Southeast (13585 Series)
https://www3.bcb.gov.br/sgspub/consultarvalores/consultarValoresSeries.do?method=consultarVal ores > Accessed on: 13 Oct. 2019.
________ Time Series Manager System. Broad National Consumer Price Index - metropolitan region
of Midwest (13951 Series)
https://www3.bcb.gov.br/sgspub/consultarvalores/consultarValoresSeries.do?method=consultarVal ores > Accessed on: 13 Oct. 2019.
________ Time Series Manager System. Unemployment rate (1620 Series). https://www3.bcb.gov.br/sgspub/consultarvalores/consultarValoresSeries.do?method=consultarVal ores > Accessed on: 26 Oct. 2019.
________ Time Series Manager System. Unemployment rate - PNADC (24369 Series). https://www3.bcb.gov.br/sgspub/consultarvalores/consultarValoresSeries.do?method=consultarVal ores > Accessed on: 26 Oct. 2019.
________ Time Series Manager System. Cost of living index (194 Series). https://www3.bcb.gov.br/sgspub/consultarvalores/consultarValoresSeries.do?method=consultarVal ores > Accessed on: 30 Oct. 2019.
________ Time Series Manager System. Cost of living index (194 Series). https://www3.bcb.gov.br/sgspub/consultarvalores/consultarValoresSeries.do?method=consultarVal ores > Accessed on: 30 Oct. 2019.
BALTAGI, B. H. Econometric analysis of panel data. 3rd edition. John Wiley & Sons, 2005. BARROS, A. S. X. Expansion of higher education in Brazil: limits and possibilities. Educação &
Sociedade, v. 36, n. 131, p. 361-290, 2015.
CALLEGARI-JACQUES, S. M. Biostatistics: principles and applications. Artemed, 2003. CATANI, A. M.; OLIVEIRA, J. F.; DOURADO, L. F. (2001). Educational policy, changes in the world of work and curricular reform of undergraduate courses in Brazil. Educação & Sociedade. v. 22, n. 75, p. 67-83, 2001.
CORBUCCI, P. R. (2004). Financing and democratizing access to higher education in Brazil: from the desertion of the state to the reform project. Educação e Sociedade, v. 25, n. 88, p. 677-702, 2004.
DE NEGRI, A.; ARAUJO, B. C.; BACELETTE, R. Challenges of the nation: supporting article. 2nd vol. Ipea, 2018.
DOGAN, T. Macroeconomic variables and unemployment: the case of Turkey. International
Journal of Economics and Financial Issues, v. 2, n. 1, p. 71-78, 2012.
FOLAWEWO, A. O.; ADEBOJE, O. M. Macroeconomic Determinants of unemployment: empirical evidence from economic community of West African States. African Development
Review, v. 29, n. 2, p. 197–210, 2017.
GUJARATI, D. N.; PORTER, D. C. Basic Econometrics. 5th edition. AMGH, 2011.
HAUSMAN, J. (1978). Specification tests in econometrics. Econometrica, v. 46, n. 6, p. 1251-1271, 1978.
HILBERT, C. (2008). Unemployment, wages, and the impact of active labour market policies in a
regional perspective. Logos, 2008.
HONORATO, G.; HERINGER, R. Access and success in higher education: a sociology of
students. Faperj, 2015.
INSTITUTO DE PESQUISAS ECONÔMICAS APLICADAS - IPEA. Ipeadata. National nominal minimum wage value deflated by the INPC. <http://www.ipeadata.gov.br/Default.aspx> Accessed on: 01 Nov. 2019.
INSTITUTO NACIONAL DE ESTUDOS E PESQUISAS EDUCACIONAIS ANÍSIO TEIXEIRA
– INEP. Higher Education Census. Years 1995 to 2017.
<http://portal.inep.gov.br/web/guest/microdados> Accessed on: 30 Oct. 2019.
JOHNSTON, J.; DINARDO, J. (2001). Econometric methods .4th edition. McGrawHill, 2001. RUSSEL, B.; TEASER, W. R. (1998). Employment, output and real wages. Research Department
Reserve Bank of Australia. Discussion paper, 1998.
SALATA, A. Higher education in Brazil in recent decades: reduction in inequalities of access?
Tempo Social. v. 30, n. 2, p. 219-253, 2015.
SGUISSARDI, V. (2006). University reform in Brazil - 1995-2006: precarious trajectory and uncertain future. Educação & Sociedade, v. 27, n. 96, p. 1021-1056, 2006.
VALENTINE, T. The sources of unemployment: a simple econometric analysis. Economic papers. v.12, n. 4, p. 1-20, 1993.