IN COFFEE GROWING
Alan Delon Andrade1, Rafael de Oliveira Faria2, Diego José Carvalho Alonso3, Gabriel Araújo e Silva Ferraz4, Miguel Angel Diaz Herrera5, Fábio Moreira da Silva6 (Received: April 16, 2018; accepted: June 20, 2018)
ABSTRACT: The intensive use of machines in agriculture tends to cause soil compaction, which can hamper the expansion of root system and the absorption of water and nutrients, thus affecting the crop development. In view of the above, the present study aimed to identify critical zones of soil compaction, through the spatial distribution of soil penetration resistance (SPR), having positions within the coffee rows and soil depth ranges as variables. The study was performed in a coffee plantation of 7.32 ha, belonging to the Bom Jardim Farm, located in the municipality of Bom Sucesso, MG, Brazil. The SPR was measured using a penetrometer in the depth range from 0 to 0.40 m, with discretization in four layers of 0.10 m. The data were interpreted based on geostatistics, in order to identify if there is spatial dependence of the SPR and generate thematic maps demonstrating the variable’s spatial behavior. It is concluded that there is spatial dependence of soil penetration resistance, being possible to use geostatistical tools to generate thematic maps based on classes of soil penetration resistance. The values of SPR in the tractor trail, for layers from 0.10 to 0.20 and from 0.20 to 0.30 m, were classified in the high SPR class and could cause damage to the crop.
Index Terms: Precision agriculture, penetrometer, soil compaction, Coffea arabica.
VARIABILIDADE ESPACIAL DA RESISTÊNCIA DO SOLO À PENETRAÇÃO NA CAFEICULTURA
RESUMO: O uso intensivo de máquinas na agricultura tende a causar a compactação do solo, processo esse que pode prejudicar a expansão do sistema radicular e a absorção de água e nutrientes, afetando, assim, o desenvolvimento da cultura. Diante do exposto, o presente trabalho tem o objetivo de identificar zonas críticas de compactação do solo, através da distribuição espacial da resistência do solo à penetração (RSP), tendo como variáveis posições dentro da linha do cafeeiro e faixas de profundidade do solo. O trabalho foi desenvolvido em uma gleba de lavoura cafeeira de 7,32 ha, pertencente à fazenda Bom Jardim, localizada no município de Bom Sucesso-MG. A medição da RSP foi feita com o uso de um penetrômetro na faixa de profundidade de 0 a 0,40 m, com discretização em 4 camadas de 0,10 m. Os dados foram interpretados com base na geoestatística, de modo a identificar se há dependência espacial da RSP e gerar mapas temáticos demonstrando o comportamento espacial da variável. Conclui-se que existe a dependência espacial da RSP, sendo possível utilizar das ferramentas da geoestatística para geração dos mapas temáticos, baseando-se nas classes de RSP, presentes na literatura. Os valores de RSP no rastro do rodado do trator, para as camadas de 0,10 a 0,20 m e 0,20 a 0,30 m, foram enquadradas na classe de alta RSP, podendo causar danos à cultura. Termos de indexação: Agricultura de precisão, penetrômetro, compactação do solo, Coffea arabica.
1 INTRODUCTION
Agriculture plays an important role in the social and economic development of Brazil (SOUZA et al., 2014). In this context, coffee stands out as one of the main commodities and revenue generator for the country. Due to globalization and market competitiveness, maintaining sustainably the high productivity is the main challenge for agricultural production (ST-MARTIN; BOMMARCO, 2016).
In this scenario, mechanization in agriculture has been intensified, since this process allows increasing the operating capacity and reducing production costs. Currently, in fully mechanized areas, all operations during the crop cycle are performed mechanically by different machines and implements (CUNHA; SILVA; DIAS, 2016).
1,2,3,4,6Universidade Federal de Lavras/UFLA - Departamento de Engenharia/DEG - Cx. P. 3037 - 37.200-000 - Lavras - MG
[email protected], [email protected], [email protected], [email protected], [email protected]
5Universidade Surcolombiana/USCO - Faculdade de Engenharia - 410001- Neiva - Huila - Colombia - [email protected]
However, the environmental impacts caused by mechanization negatively influence this process. Among the impacts, the soil compaction caused by the traffic of agricultural equipment in the crop is highlighted, which strongly influences the coffee cultivation, affecting the crop development and reducing productivity (CARVALHO et al., 2013; MARTINS et al., 2012).
Compaction process affects soil structure and physical properties (CARMO et al., 2011), reducing macroporosity and permeability and increasing resistance by the action of excessive loads on the soil. According to Nawaz, Bourrié and Trolard (2013), since soil compaction directly affects soil physical properties, such as density, penetration resistance and porosity, these parameters can be used to quantify soil compaction. The authors also state that the consequences caused by soil compaction are still underestimated.
2 MATERIAL AND METHODS
The study was developed in a coffee plantation of 7.32 ha, belonging to the Bom Jardim Farm, located in the municipality of Bom Sucesso, MG, Brazil, at coordinates 21°01’20” S and 44°55’9” W, and 990 m altitude. The coffee variety in the plot is Catuaí IAC 62 with spacing of 4.0 x 1.0 m. The soil was characterized as dystrophic red latosol (Brazilian Agricultural Research Agency - EMBRAPA, 2013).
The studied area has been managed by mechanized operations, except harvesting, for 20 years. In total, 16 mechanized operations are carried out per year. However, there is no record of soil subsoiling in the area since the installation of the coffee, in 1973.
For the accomplishment of the study values of soil penetration resistance (SPR) were collected in December 2016, using a regular grid with 29 points (four points per hectare), as observed in Figure 1 (a). At each point, RSP values were collected in three different positions: under coffee canopy (UCC), in the tractor trail (TT) and in the midway between coffee rows (MCR), according to Figure 1 (b). The positions were determined using the coffee row as reference. The distances from the coffee row were 0.3 m, 1.3 m and 2 m, for the positions UCC, TT and MCR, respectively. For each plot, two replicates were performed and data were collected at depths from 0 to 0.10; 0.10 to 0.20; 0.20 to 0.30, and 0.30 to 0.40 m.
For the measurement of SPR, it was used an electronic penetrometer of the brand Falker (PenetroLOG), model PLG1020. The apparatus was programmed to operate up to 40 cm depth, with data then transferred to the computer and tabulated, finding an average value for each layer of 10 cm of soil. The data collection points were generated through the Farm WorksTM software, and for localization in the plot it was used the CR Campeiro, a free distribution software developed by the Department of Rural Engineering of the Federal University of Santa Maria.
The spatial dependence of SPR was analyzed through semivariogram fitting by the classical estimator, as follows (Equation 1):
where, N (h) is the number of experimental pairs of observations Z(xi) and Z (xi + h) separated by According to Fernandes, Santinato and
Santinato (2012), the presence of the compacted layer in the soil diminishes its useful depth, hindering the coffee growing due to the difficulty of water infiltration in the soil and precluding the root growth of plants, thus resulting in low yield. In a study to evaluate the effect of subsoiling on coffee yield, the authors verified the superiority of all subsoiling treatments in relation to the control, increasing from 26 to 65% in the average of three analyzed harvests, indicating that the superiority of the subsoil treatments is resulting from the reduced soil compaction with the practice of subsoiling, justifying the use of subsoiler for this purpose.
However, subsoiling is a costly process (SALVADOR; BENEZ; MION, 2009), requiring high use of labor force and equipment. In this way, it can be noted the importance of the compaction study in the cultivated areas, seeking to identify and quantify critical compaction locations. Thus, in possession of this information, the management of subsoiling can become more efficient, showing better results and reducing costs.
Measurement of soil penetration resistance is one of the identification methods of soil compaction, where high resistance values indicate compacted areas. This indicator is widely used due to its practicality, providing a good estimation of the soil compaction at each sampling point. The knowledge on the spatial variability of soil penetration resistance may allow identifying areas that need specific management. In this context, the use of precision agriculture or “precision coffee growing” techniques, become an interesting alternative for the management of compacted zones and as a decision tool.
According to Ferraz et al. (2012), precision coffee growing can be defined as a set of techniques and technologies capable of assisting the coffee grower in the crop management, based on the spatial variability of soil and plant properties, in order to increase process efficiency and maximize profitability, thus increasing productivity and the product’s final quality.
Geostatistics is highlighted among the tools used in precision agriculture, which differs from classical statistics because it considers that the data sampled are spatially dependent. Moreover, it makes possible to identify whether or not there is spatial dependence for the analyzed factors and to characterize the magnitude of spatial variability, allowing generating thematic maps that aid in the decision making in the crop (CARVALHO et al., 2013).
In this context, the aim in this study was to identify the critical soil compaction zones, through soil penetration resistance data, using geostatistical tools, comparing positions within the coffee row and in soil depth ranges.
a distance h. The semivariogram is represented by the graph versus h. From the fit of a mathematical model to the calculated values of the coefficients of the theoretical model were estimated for the semivariogram; these coefficients are: nugget effect , sill
and range (a).
In order to analyze the spatial dependence index (SDI) of properties under study, the classification of Cambardella et al. (1994) was used, calculated by Equation 2, in which are considered as spatial dependence:
- Strong: semivariograms with nugget effect lower than or equal to 25% of the sill (SDI 0.25);
- Moderate: semivariograms between 25 and 75% of the sill (0.25 SDI 0.75);
- Weak: nugget effect greater than or equal to 75% of the sill (SDI 0.75).
FIGURE 1 - Grid sample of the area (a) and schematic sampling drawing (b).
The fitting of semivariograms models was chosen according to the ordinary least squares (OLS), using the spherical model. Such model is the most used in geostatistical studies related to the soil and to the coffee growing (SILVA et al., 2007).
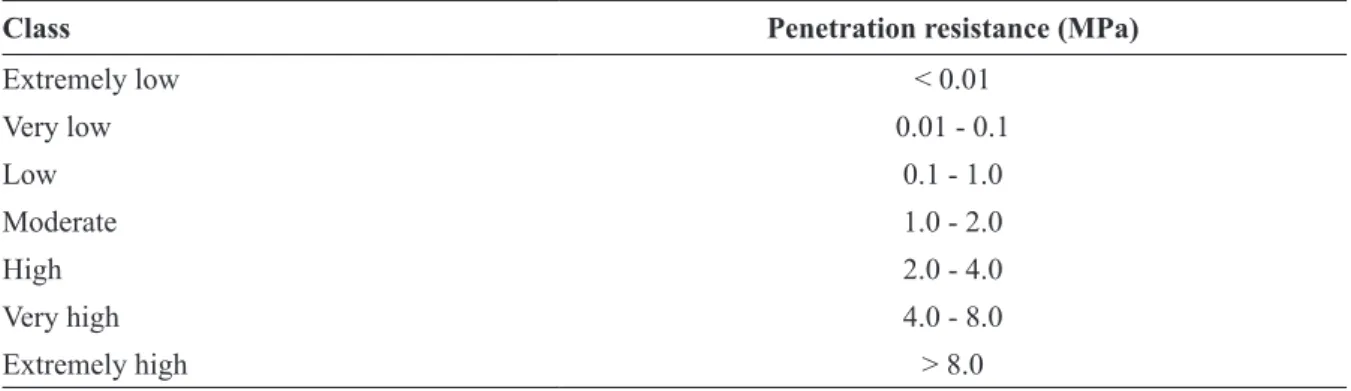
After fitting the semivariograms, the data were interpolated by ordinary kriging. Thereby, it is possible to show spatial distribution patterns of variables in the crop, in the form of thematic maps. The maps were created based on SPR classes, according to Table 1, classifying the SPR in pressure ranges that when related to crops may or may not influence the plant development.
For the geostatistical analysis, the R statistical software, free distribution, was used through the geoR package (RIBEIRO JUNIOR; DIGGLE, 2001), while the software Farm WorksTM was used to generate the thematic maps. The maps were generated in the Universal Transverse Mercator (UTM) coordinate system in zone 23K, where is located the experimental area.
TABLE 1 - Classes of soil penetration resistance.
Class Penetration resistance (MPa)
Extremely low < 0.01 Very low 0.01 - 0.1 Low 0.1 - 1.0 Moderate 1.0 - 2.0 High 2.0 - 4.0 Very high 4.0 - 8.0 Extremely high > 8.0
Source: Adapted from Soil Science Division Staff (2017). (2)
TABLE 2 - Descriptive statistics of the soil penetration resistance (MPa) in different positions and layers.
Positions Layers Descriptive statistics
Min Max Md Avg Var SD Cs CK CV
UCC 0-10 cm 0.00 2.41 0.58 0.62 0.20 0.44 1.52 4.15 71.6 10-20cm 0.48 2.26 1.50 1.48 0.14 0.38 -0.34 0.29 25.6 20-30cm 0.59 2.62 1.74 1.74 0.19 0.43 -0.25 -0.10 24.8 30-40cm 0.25 2.43 1.64 1.62 0.19 0.43 -0.41 0.71 26.8 MCR 0-10 cm 0.49 3.44 2.00 2.01 0.34 0.58 -0.01 -0.01 28.9 10-20cm 1.16 2.62 1.86 1.93 0.10 0.32 0.08 -0.17 16.6 20-30cm 1.16 2.67 1.93 1.93 0.12 0.35 -0.11 -0.66 17.9 30-40cm 1.11 2.74 1.85 1.89 0.14 0.38 0.17 -0.39 20.1 TT 0-10 cm 0.30 3.40 1.53 1.55 0.23 0.48 0.62 3.28 30.80 10-20cm 1.93 3.66 2.71 2.64 0.16 0.40 0.12 -0.26 15.10 20-30cm 1.56 2.84 2.13 2.17 0.08 0.29 0.42 -0.20 13.20 30-40cm 0.73 2.60 1.71 1.74 0.10 0.31 0.03 1.38 18.00
UCC - Under coffee canopy; MCR - Midway between coffee rows; TT - Tractor trail; Min - Minimum value; Max - Maximum value; Md - Median; Avg - Average; Var - Variance; SD - Standard deviation; Cs - Coefficient of skewness; Ck - Coefficient of kurtosis; CV - Coefficient of variation.
3 RESULTS AND DISCUSSION
Descriptive analysis of soil penetration resistance (SPR) data is presented in Table 2. Regarding the coefficient of variation (CV), it can be observed values ranging from 13.2% to 71.6%. According to Gomes and Garcia (2002), the variability of a property can be classified according to the magnitude of its CV, which can be: low, when lower than 10%; moderate, between 10 and 20%; high, between 20 and 30%; and very high, when higher than 30%.
Thus, it can be noted that the variable studied fits into the variability classes from moderate to very high. Moreover, high CV values are indicators of data heterogeneity.
Referring to the average, minimum and maximum value, a variation is observed in the SPR data. However, according to Carvalho et al. (2013), only the knowledge of these measures cannot be used as the only way to identify the expression of the variable in an area. To this end, the geostatistical analysis aims to verify the spatial variability of a variable and, whether identified, thematic maps are generated in order to aid in understanding of its behavior in the field.
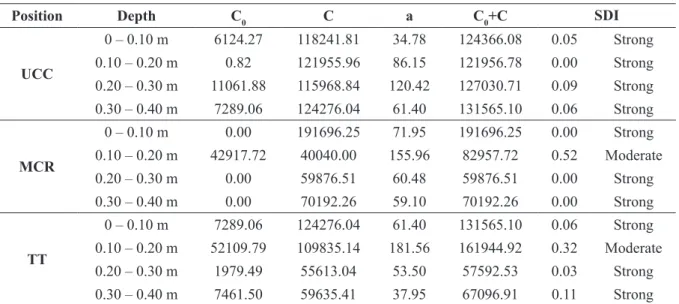
By analyzing the estimated parameters of experimental semivariogram for SPR (Table 3), it is verified that the range varied from 34.78 to 181.56 m between the studied positions and depths, demonstrating a good structural continuity of the soil. This result differs from that found by Kamimura et al. (2013), in which the range was
3.4 m for SPR in the layer from 0.25 to 0.28 m, using the spherical model. Silva and Lima (2013), aiming to analyze the spatial distribution of soil physical properties and coffee productivity, found values for the range varying from 11 to 95 m, adjusting the spherical and the gaussian models.
The spatial dependence index (SDI) was strong for most positions and depths, being that the SDI was moderate only in MCR and TT, both at depths from 0.10 to 0.20 m. This indicates that there is spatial dependence for SPR data, and geostatistics might be used to describe the variable behavior in the studied area.
SDI results are similar to those found by Palma et al. (2013), which obtained the SDI classification as moderate for SPR in the layers from 0.10 to 0.20 and 0.40 to 0.50 m, whereas was strong for the other layers. On the other hand, Bottega et al. (2011) did not find much satisfactory results, since SDI of SPR was considered as moderate for all studied soil depths.
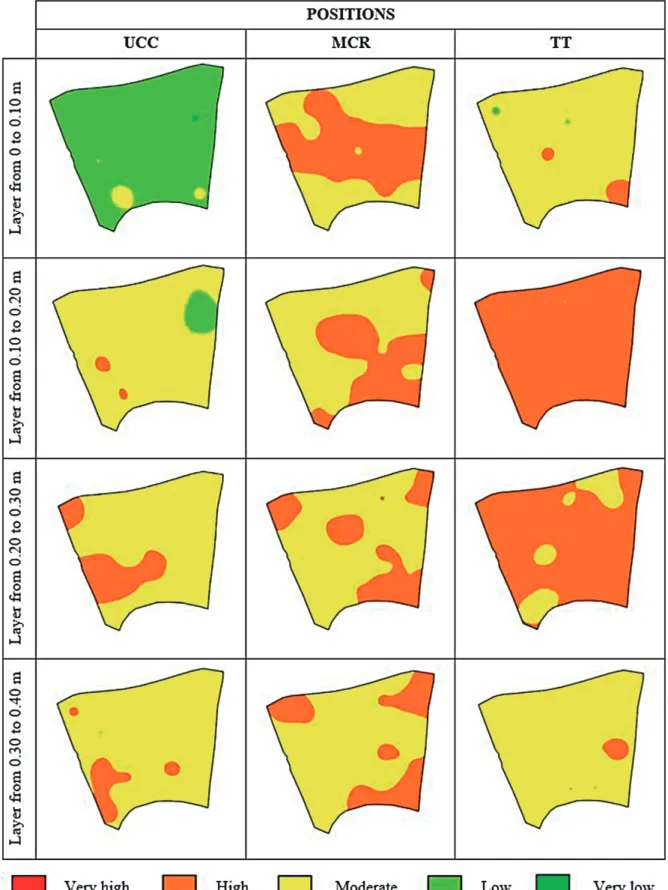
Once the semivariogram of the variable and its structure of spatial dependence by kriging are known, it is possible to interpolate values at any point in the study area, without tendency and with minimum variance (KAMIMURA et al., 2013). Thus, the SPR maps were generated for the positions UCC, MCR and TT in the layers from 0 to 0.10 m, 0.10 to 0.20 m, 0.20 to 0.30, and 0.30 to 0.40 m (Figure 2). The maps were generated based on the SPR classes, being possible to distinguish each area and their framing to a specific SPR class.
In the UCC position, the layer from 0 to 0.10 m showed SPR in the low class for 98.2% of the area. This condition was already expected due to the presence of a layer of organic material underneath the plant, as well as the machinery does not travel in that region after the crop establishment. In the layers from 0.10 to 0.20 and 0.30 to 0.40 m, the SPR was predominantly framed in the moderate class, where these values reflect intrinsic soil characteristics.
In the layer from 0.20 to 0.30 m, 19.9% of the area of the UCC position was framed in the high SPR class. This fact can be explained by the high concentration of roots in this soil layer, since the penetrometer may have shocked with the roots, increasing the measured values of penetration resistance. Palma et al. (2013) showed high SPR results for layers ranging between 0.20 and 0.60 m depth, in the coffee growing row with mechanized management system.
In the MCR position, 50% of area of the layer from 0 to 0.10 m exhibited SPR class classified as high, the other half area was classified into the moderate SPR class. For the layer from 0.10 to 0.20 m, 36% of the area was classified as high SPR and the remainder as moderate. These SPR values for coffee interlines were higher than expected. However, this result corroborates to those found by Martins et al. (2012) studying the effect of mechanized operations on soil compaction in the coffee growing, where they observed that the layer from to 0.03 m underwent higher compaction than the layer from 0.15 to 0.18 m. The lack of vegetation mulch and the low soil moisture in this position may have influenced this result.
TABLE 3 - Estimated parameters of experimental semivariogram for soil penetration resistance (MPa).
Position Depth C0 C a C0+C SDI
UCC 0 – 0.10 m 6124.27 118241.81 34.78 124366.08 0.05 Strong 0.10 – 0.20 m 0.82 121955.96 86.15 121956.78 0.00 Strong 0.20 – 0.30 m 11061.88 115968.84 120.42 127030.71 0.09 Strong 0.30 – 0.40 m 7289.06 124276.04 61.40 131565.10 0.06 Strong MCR 0 – 0.10 m 0.00 191696.25 71.95 191696.25 0.00 Strong 0.10 – 0.20 m 42917.72 40040.00 155.96 82957.72 0.52 Moderate 0.20 – 0.30 m 0.00 59876.51 60.48 59876.51 0.00 Strong 0.30 – 0.40 m 0.00 70192.26 59.10 70192.26 0.00 Strong TT 0 – 0.10 m 7289.06 124276.04 61.40 131565.10 0.06 Strong 0.10 – 0.20 m 52109.79 109835.14 181.56 161944.92 0.32 Moderate 0.20 – 0.30 m 1979.49 55613.04 53.50 57592.53 0.03 Strong 0.30 – 0.40 m 7461.50 59635.41 37.95 67096.91 0.11 Strong UCC - Under coffee canopy; MCR - Midway between coffee rows; TT - Tractor trail; C0 - nugget effect; C -
contribution; a - range; C0+C - sill; SDI - spatial dependence degree.
Another justification for these results in the MCR would be the compaction generated in the superficial layers of the soil by the mechanized operations for weed control, sweeping and windrowing of coffee. For the layers from 0.20 to 0.30 and 0.30 to 0.40 m, the SPR was framed as moderate in approximately 70% of the area.
In the TT position, the layers from 0 to 0.10 m and 0.30 to 0.40 m displayed predominantly values classified as moderate SPR. The layers from 0.10 to 0.20 and 0.20 to 0.30 m were framed as high SPR class, result expected due to the compaction generated by the traffic of machines in the crop. Similar results were found by Beutler et al. (2001), where an increasing SPR gradient was verified with increasing depth, reaching maximum resistance between 0.15 and 0.30 m in a dystrophic red latosol under no-till systems.
Nevertheless, Bottega et al. (2011) analyzed the spatial variability of SPR in a dystrophic red latosol under no-till system for soybean and maize crops, and found different results than those presented here. The authors emphasize that the increase in depth resulted in decrease of values of variance and standard deviation, demonstrating that the compaction variability degree is higher in more superficial layers, showing that the compaction effect by machine traffic is reflected in these regions.
Palma et al. (2013) state that in the coffee growing is verified higher RSP to greater depth in relation to annual crops, which is justified by the traffic of machines always occurring parallel to the planting row of the crop.
FIGURE 2 - Spatial distribution maps of soil penetration resistance (SPR) in the study area, as a function of the positions (under coffee canopy - UCC; Midway between coffee rows - MCR; tractor trail - TT) and studied soil layers.
4 CONCLUSIONS
Soil penetration resistance showed spatial dependence, being possible to use geostatistical tools to generate thematic maps based on classes of soil penetration resistance.
In the tractor trail, the soil penetration resistance obtained in deep from 0.1 to 0.30 m was classified as high, indicating soil compaction.
The generated maps have important and useful information to proceed with the subsoiling operation, aiming to reduce soil compaction.
5 REFERENCES
BEUTLER, A. N. et al. Resistência à penetração e permeabilidade de Latossolo Vermelho distrófico típico sob sistemas de manejo na região dos cerrados. Revista
Brasileira de Ciência do Solo, Viçosa, v. 25, n. 1, p.
167-177, Jan/Mar. 2001.
BOTTEGA, E. L. et al. Variabilidade espacial da resistência do solo à penetração em um Latossolo Vermelho distroférrico. Revista Brasileira de
Ciências Agrárias, Recife, v. 6, n. 2, p. 331-336, Apr/
June. 2011.
CAMBARDELLA, C. A. et al. Field scale variability of soil properties in Central Iowa soils. Soil Science Society of America Journal, Madison, v. 58, n. 5, p. 1501-1511, Sept/Oct. 1994.
CARMO, D. L. et al. Propriedades físicas de um latossolo vermelho-amarelo cultivado com cafeeiro em três sistemas de manejo no sul de minas gerais. Revista Brasileira de Ciência do Solo, v. 35, n. 3, p. 991-998, May/June. 2011.
CARVALHO, L. C. C. et al. Variabilidade espacial de atributos físicos do solo e características agronômicas da cultura do café. Coffee Science, Lavras, v. 8, n. 3, p. 265-275, July/Sept. 2013.
CUNHA, J. P. B.; SILVA, F. M.; DIAS, R. E. B. A. Eficiência de campo em diferentes operações mecanizadas na cafeicultura. Coffee Science, Lavras, v. 11, n. 1, p. 76-86, Jan/Mar. 2016.
EMBRAPA - EMPRESA BRASILEIRA DE PESQUISA AGROPECUÁRIA. Sistema brasileiro de classificação de solos. Centro Nacional de Pesquisa de solos: Rio de Janeiro, 2013.
FERNANDES, A. L. T.; SANTINATO, F.; SANTINATO, R. Utilização da subsolagem na redução da compactação do solo para produção de café cultivado no cerrado mineiro. Enciclopédia Biosfera, Centro Científico Conhecer, Goiânia, v. 8, n. 15, p. 1648, 2012.
FERRAZ, G. A. S. et al. Variabilidade espacial e temporal do fósforo, potássio e da produtividade de uma lavoura cafeeira. Engenharia Agrícola, Jaboticabal, v. 32, n. 1, p. 140-150, Jan/Feb. 2012. GOMES, F. P.; GARCIA, C. H. Estatística aplicada a experimentos agronômicos e florestais. Piracicaba: FEALQ, 2002. 305 p.
KAMIMURA, K. M. et al. Variabilidade espacial de atributos físicos de um latossolo vermelho-amarelo, sob lavoura cafeeira. Revista Brasileira de Ciência do Solo, Viçosa, v. 37, n. 4, p. 877-888, July/Aug. 2013.
MARTINS, P. C. C. et al. Compaction caused by mechanized operations in a Red-Yellow Latosol cultivated with coffee over time. Ciência e Agrotecnologia, Lavras, v. 36, n. 4, p. 391-398, July/ Aug. 2012.
NAWAZ, M. F.; BOURRIÉ, G.; TROLARD, F. Soil compaction impact and modelling. A review. Agronomy for Sustainable Development, Paris, v. 33, n. 2, p. 291-309, Apr/June. 2013.
PALMA, M. A. Z. et al. Resistência do solo à penetracao em cafezais cultivados com sistema mecanizado e manual. Coffee Science, Lavras, v. 8, n. 3, p. 364-370, July/Sept. 2013.
RIBEIRO JÚNIOR, P. J.; DIGGLE, P. J. GeoR: a package for geostatistical analysis. R-News. New York, v. 1, n. 2, p. 14-18, May/Aug. 2001.
SALVADOR, N.; BENEZ, S. H.; MION, R. L. Demanda energética na subsolagem realizada antes e depois de diferentes sistemas de preparo periódico do solo. Ciência Rural, Santa Maria, v. 39, n. 9, p. 2501-2505, Dec. 2009.
SILVA, F. M. et al. Variabilidade espacial de atributos químicos e de produtividade na cultura do café. Ciência Rural, Santa Maria, v. 37, n. 2, p. 401-407, Mar/Apr. 2007.
SILVA, S. A.; LIMA, J. S. S. Atributos físicos do solo e sua relação espacial com a produtividade do café arábica. Coffee Science, Lavras, v. 8, n. 4, p. 395-403, Oct/Dec. 2013.
SOIL SCIENCE DIVISION STAFF. Soil survey manual. USDA Handbook 18. Washington: Government Printing Office, 2017, 605 p.
SOUZA, J. M. et al. Atributos físicos do solo em lavoura de cafeeiro conilon submetida à subsolagem. Revista Engenharia na Agricultura, Viçosa, v. 22, n. 5, p. 413, Sept/Oct. 2014.
ST-MARTIN, A.; BOMMARCO, R. Soil compaction and insect pollination modify impacts of crop rotation on nitrogen fixation and yield. Basic and Applied Ecology, Uppsala, v. 17, n. 7, p. 617-626, Nov. 2016.