Balance emissions and CO
2
uptake in concrete
structures: simulation based on the cement content
and type
Balanço das emissões e da captura de CO
2
em
estruturas de concreto: simulação em função do
consumo e tipo de cimento
a Department of Structural Engineering, São Carlos School Engineering, University of São Paulo, São Carlos, SP, Brazil; b Postgraduate Program in Civil Engineering, Federal University of Latin American Integration, Foz do Iguaçu, PR, Brazil.
Received: 04 Nov 2016 • Accepted: 29 Jun 2017 • Available Online: 15 Feb 2018
E. F. FELIX a
E. POSSAN b
Abstract
Resumo
While the cement plant is considered one of the most polluting industry, responsible for about 5% of global CO2 emissions, the concrete has the
potential to uptake this gas through the carbonation process, offset in part the emissions generated in its production. With the purpose to analyze
this process, this study aims to evaluate emissions and CO2 uptake with cement content 300-580 kg produced with different cement types (CP II F,
CP II E, CP II Z, CP III, CP IV and CP V). Through mathematical modeling, the emissions balance was made, identifying the mix that shows good
resistance to carbonation and greater absorption of CO2 during the concrete life cycle. The results show that concrete with cement consumption between 380 and 420 kg/m³ showed better balance emissions.
Keywords: CO2 sequestration, cement content, CO2 emissions, compensatory measures, sustainability.
Apesar da indústria cimenteira ser considerada uma das mais poluentes do setor, responsável por aproximadamente 5% das emissões mundiais de CO2, o concreto tem a potencialidade de absorver esse gás, através do processo de carbonatação, compensando em partes as emissões geradas na sua produção. Com o objetivo de analisar este processo, o presente estudo avalia por meio de simulações as emissões e a captura de CO2 de concretos com consumos de 300 a 580 kg de cimento por metro cúbico de concreto, produzidos com diferentes tipos de cimento Portland
(CP II F, CP II E, CP II Z, CP III, CP IV e CP V). Por meio da modelagem matemática fez-se o balanço das emissões, identificando o traço que
apresenta boa resistência à carbonatação e maior absorção de CO2 durante o ciclo de vida do concreto. Os resultados apontam que concretos com consumo de cimento entre 380 e 420 kg/m³ e com maiores taxas de adições apresentam melhores balanços de emissões.
136 IBRACON Structures and Materials Journal • 2018 • vol. 11 • nº 1
1. Introduction
The elevated gaseous emissions of the cement production have drawn the attention of the productive sector, since cementitious industry is, by itself, responsible for approximately 5 to 7% of CO2 global emissions [1, 2, 3].
Due to rising consumption of concrete in the world and, consequently, of cement, there has been a lot of discussion regarding alternatives to reduce the emissions associated to concrete – the second most used material in the world [3]. According to Sindicato Nacional da Indústria do Cimento (Cement Industry National Union) [4], in Latin
America, Brazil is among the countries with the highest rates of
cement production and consumption, having produced 68 million of tons in 2012. In the same period, China showed a consumption that exceeded 2 billion of tons, being the largest producer and consumer of cement in the world, emitting almost the same quantity of CO2, since according to sources [5], for the production of one ton of clinker, 700 to 1100 kg of CO2 are generated globally.
In a domestic scenario, due to actions of the cementitious industry, the CO2 emissions, caused by the cement production, represent a participation of 3%, according to data from the 2º Inventário
Brasileiro de Emissões e Remoções Antrópicas de Gases de Efeito Estufa (Brazilian Inventory of Anthropic Emissions and Removal of Greenhouse Effect Gases), with data pertaining to the years from
1990 to 2005, with the country emitting around 536 kg of CO2 per ton of cement produced [4].
However, an important feature of cement-based materials relates to their capacity of reabsorbing CO2 from the atmosphere during the process of carbonation: reaction between CO2, which enters through the concrete, and calcium hydroxide (Ca(OH)2), present in the cementitious matrix, in the presence of water. According
to Pade and Guimarães [5], carbonation and its consequent CO2 uptake occur throughout the entire service life of concrete structure and even after its demolition, when it is more intense.
In reinforced concrete structures, carbonation is considered a mechanism of deterioration, since it decreases of the concrete pH, leaving the steel reinforcement susceptible to corrosion. At environment temperature, concrete shows pH around 12.5 due to the presence of Ca(OH)2. With the reduction of the calcium hydroxide levels in the interior of the pores of the hydrated cement paste and, afterwards, its transformation into calcium carbonate (CaCO3), because of the carbonation reactions, the pH is reduced to values close to or lower than 9 [8, 9, 10, 11].
In non-reinforced concrete elements (i.e., dams, concrete walls, pavers, decorative elements, among others), though, carbonation
can be beneficial, acting as a process of atmospheric CO2 uptake, partially compensating the CO2 generated in the cement production [7, 12, 13, 14], and thus can be considered in the balance of
greenhouse effect gases emissions.
In light of this, this paper aims to achieve a balance between the emissions of CO2 and the capture of this gas through
carbonation for concretes with different types of binders and
strength levels, expressed by the consumption of cement in the concrete mixture. In order to, using simulation and mathematical
modelling, a period of 100 years will be analyzed, of which 70
years refers to the concrete service life and 30 years refer to the post demolition period.
2. Emissions associated to cement and
CO
2uptake due to concrete carbonation
The emissions of the cement production process are caused especially by the calcination of limestone rock, as demonstrated in
Figure 1
the simplified reaction showed in Equation 1, and by the fossil fuel
burning for the production of clinker.
(1)
In cement life cycle, 95% of total CO2 emitted comes from the production stage [15], with almost the entire emission in cement industry concentrating on the clinker production [5], since during the cement production process, half of the emitted CO2 is caused by the calcination of limestone rock, and the other half derives from the burning of fuels for energy generation in the clinkering process [6]. However, it has been argued that concrete has the potential to capture CO2 from the atmosphere through a process known as
carbonation [16, 7, 13]. One of the results of this reaction (Equation
2) is the reduction of the concrete pH, which destroys the passivity
of the steel, leaving the reinforcement susceptible to corrosion, which is not desirable from a durability perspective. Another result is the CO2 uptake from the atmosphere, generating calcium carbonate (CaCO3), which apprehends the carbon dioxide inside the concrete structure, removing it from the atmosphere, in a
process inverted to the cement production (Equation 1).
(2)
Generally, the process of CO2 uptake due to the carbonation of the concrete can be outlined as in Figure 1.
The study verifies that the previous works shows discrepancies in
relation to the potential of CO2 uptake due to concrete carbonation.
Pade [17] highlights a global potentiality of CO2 uptake due to the
carbonation of concrete structures of 33-57%, while Gajda [18]
Figure 2
138 IBRACON Structures and Materials Journal • 2018 • vol. 11 • nº 1
reports that only 7.6% of the emitted CO2 can be absorbed. In South
Korea, Lee, Park and Lee [19] mention the uptake of only 2.9% of CO2 in a structure during 20 years of its service life. In a study developed in Norway, Jacobsen e Jahren [20] estimated that 11% of the CO2 emitted during cement production is reabsorbed by the concrete due to carbonation during its service life. In the USA, Haselbach and Thomas [21] mention 28.2% of CO2 uptake during service life. Pade
and Guimarães [7], in a study developed in Denmark, estimate, for
a 100 years perspective, considering the demolition of the structure, which, due to carbonation, the concrete can absorb up to 57% of the CO2 emitted during cement production. If the demolition of the structure is not considered, this value is reduced to 24%. The method
adopted by Pade and Guimarães [7] assumes that the concrete has a
degree of hydration of 100%, while the diffusion and concentration of
CO2 were assumed constants over time. The authors also considered that the aggregates generated by the demolition of the structure will be 100% carbonated during a 30 years period, with the structure and its demolition waste under the same environmental conditions.
Felix and Possan [22] highlight that the carbonation of
post-demolition concrete is strongly dependent of the exposure conditions and of the dimensions of the demolished materials, therefore there are some practicality problems in the calculation methods adopted by some authors. One of the major problems
discovered is finding a way to expose the demolition waste of
a structure, in a way that it stays in contact with the CO2 for the carbonation to occur. Hence, the CO2 uptake due to concrete
Table 1
Concrete compositions used in the simulations (with blended cements: CP II Z, E and F)
Type of cement
Addition F
cj (MPa)
Dosage (kg/m³)
Type* Content* Cement Stone Sand Water
CP II-E Slag 6 - 34
20.92 300.00 864.17 1056.21 120.00
25.55 340.00 860.41 1051.61 136.00
29.78 380.00 849.14 1037.84 152.00
31.75 400.00 845.39 1033.25 160.00
33.63 420.00 841.63 1028.66 168.00
37.13 460.00 834.12 1019.47 184.00
40.30 500.00 826.60 1010.29 200.00
43.20 540.00 819.09 1001.11 216.00
45.84 580.00 811.57 991.92 232.00
CP II-F Limestone
filler 15 - 50
20.22 300.00 818.24 1000.07 120.00
24.87 340.00 808.99 988.76 136.00
29.90 380.00 799.74 977.46 152.00
32.59 400.00 842.95 1090.77 160.00
34.48 420.00 790.49 966.15 168.00
38.66 460.00 781.24 954.85 184.00
42.46 500.00 771.99 943.54 200.00
45.93 540.00 762.74 932.24 216.00
49.10 580.00 753.49 920.94 232.00
CP II-Z Fly ash 15 - 50
21.98 300.00 926.26 1132.09 120.00
26.56 340.00 912.73 1115.56 136.00
30.69 380.00 899.21 1099.04 152.00
32.24 400.00 795.11 971.81 160.00
34.39 420.00 885.69 1082.51 168.00
37.72 460.00 872.16 1065.98 184.00
40.73 500.00 858.64 1049.45 200.00
43.45 540.00 845.12 1032.92 216.00
45.92 580.00 831.60 1016.39 232.00
carbonation on the post-demolition period requires further studies in order to verify whether it can be conducted in a real scale. These discrepancies found in previous works come of the many factors
that influence the concrete carbonation phenomenon (strength, exposure
environment, amount of cement used for concrete production, age of the structure, among others). They are, also, dependent of the adopted calculation methods and assumptions made by the researcher, what
hinders the comparison of results generated by different researches [22].
3. Methodology for estimating
the CO
2balance
Since the study of CO2 uptake associated with concrete structures is
recent, few published articles describe the methods adopted for these
estimates in detail. In light of this, Felix, Possan and Thomaz [23] developed a methodology as described by the flow chart in Figure 2.
Composed by six steps, the method begins with the description of the structure scenario (Step 1), then to estimating the emissions associated with cement and aggregates (Step 2) and the concrete carbonation depth over time (Step 3). In Steps 4 and 5, the potential of CO2 uptake due to carbonation is estimated during the service life and post-demolition period of the structure, respectively, culminating in Step 6, the balance of emissions
(difference between emitted and captured CO2). In the sequence, the methods and materials adopted in this work are presented in
detail, in accordance with the flow chart in Figure 2.
Table 2
Concrete compositions used in the simulations (with blended cements: CP III, II and V)
Type of cement
Addition F
cj (MPa)
Dosage (kg/m³)
Type* Content* Cement Stone Sand Water
CP III* Slag 6 - 34
19.64 300.00 875.35 1069.88 120.00
22.53 340.00 860.82 1052.11 136.00
28.19 380.00 846.28 1034.34 152.00
30.92 400.00 839.01 1025.46 160.00
33.56 420.00 831.74 1016.58 168.00
38.61 460.00 817.21 998.81 184.00
43.33 500.00 802.67 981.04 200.00
47.73 540.00 788.13 963.28 216.00
51.83 580.00 773.60 945.51 232.00
CP IV** Fly ash 15 - 50
25.09 300.00 757.21 925.48 120.00
30.62 340.00 746.04 911.82 136.00
35.68 380.00 734.86 898.16 152.00
38.03 400.00 729.27 891.33 160.00
40.28 420.00 723.68 884.50 168.00
44.46 460.00 712.50 870.84 184.00
48.26 500.00 701.32 857.17 200.00
51.73 540.00 690.15 843.51 216.00
54.89 580.00 678.97 829.85 232.00
CP V ARI*** Limestone
filler 0 - 5
24.01 300.00 785.03 959.48 120.00
30.26 340.00 774.23 946.28 136.00
36.32 380.00 763.44 933.09 152.00
39.25 400.00 758.04 926.49 160.00
42.10 420.00 752.64 919.89 168.00
47.57 460.00 741.84 906.70 184.00
52.70 500.00 731.05 893.50 200.00
57.51 540.00 720.25 880.30 216.00
62.02 580.00 709.45 867.11 232.00
140 IBRACON Structures and Materials Journal • 2018 • vol. 11 • nº 1
3.1 Step 1 – Determination of concrete
characteristics and exposure conditions
of the structure
Considering that many factors influence the concrete carbonation,
especially concrete proportioning (cement consumption, compressive strength, water/cement ration, type of the cement used, among others), geometrical characteristics of the structure or structural
elements (shape, volume and superficial area in contact with the
atmosphere) and characteristics of the exposure environment of the structure (CO2 content in the environment, relative humidity of the air, rain exposure – internal or external area, sheltered or not sheltered from the rain) [23], in this step, it is important to describe clearly the variables employed in the simulation.
In relation to the concrete, in this study, various compositions
were simulated through the ABCP/ACI method. The compositions were obtained by fixating the water/cement ratio as 0.4. For the
constituent materials of the concrete, a large aggregate of basaltic
origin with maximum diameter of 19 mm, specific weight of 2700
kg/m³ and unit mass of 1515 kg/m³. The small aggregate used was
natural quarzitic sand with fineness modulus of 2.9, specific weight
of 2660 kg/m³ and unit mass of 1490 kg/m³.
For the binder, six types of Portland cement were considered in the simulation: three blended cements (CP II E, with slag, CP II F, with filler, and CP II Z, with pozzolan) [25], one Portland-Slag Cement (CP III) [26], one Portland-Pozzolan Cement (CP IV) [27] and one High Early-Strength Cement (CP V ARI) [28].
The concrete composition obtained through the ABCP/ACI method
(Tables 1 and 2) have different cement consumptions, varying
between 300 and 580 kg/m³.
It is assumed that the structure will be built in urban environment, not sheltered from rain, with average annual humidity of 70%1 and a CO2 local content of 0.04%2. No rendering layer will be considered (apparent concrete, no painting). All the evaluated variables are presented in Table 3.
3.2 Step 2 – Estimating the CO
2emissions
CO2 emissions resulting from cement production were estimated considering emissions due to cement manufacturing, aggregates production and transportation until it is available on the construction site, be it from an industry or produced in the site.
Therefore, based on methodologies by IPCC [29] and CSI [30] to
estimate CO2 emissions due to cement production (Ecim), Equation
3 was used, in which are considered emissions due to energy use (Eene), to decomposition of the material (calcination) (Edesc) and to transportation during cement production (Etrans). All emissions are given in kgCO2/t.
(3)
To calculate Eene, Edesc e Etrans, the methodology presented by Lima [5] was used with the energy data collected by the Balanço
Energético Nacional (National Energetic Balance) [31] presented
in Table 4.
It should also be considered that the different Portland cements traded in Brazil (CPI, CP II, CP III, CP IV e CP V) have different
Table 3
Input data to determine carbonation depth
Variáveis de análise Concrete
Tipo de cimento CP II E1 CP II Z1 CP II F1 CP III2 CP IV3 CP V ARI4
Compressive strength
(MPa) Variable Variable Variable Variable Variable Variable
Addition content (%) 6 – 34 6 – 14 0 – 10 35 – 70 15 – 50 0 – 5
Addition type Slag Fly ash Fly ash Slag Fly ash Limestone
filler
Exposure condition 5 EP EP EP EP EP EP
Relative humidity (%) 70 70 70 70 70 70
CO2 concentration (%) 0.04 0.04 0.04 0.04 0.04 0.04
Time (years) 1 - 100 1 - 100 1 - 100 1 - 100 1 - 100 1 - 100
1 ABNT NBR 11578:1991 Revised version: 1997; 2 ABNT NBR 5735:1991; 3 ABNT NBR 5736:1991; 4 ABNT NBR 5733:1991; 5 EP = Outdoor, sheltered from rain.
Table 4
Average CO
2emissions (in kg) for the production of one ton of cement [29]
Emissions/year 2008 2009 2010 2011 2012
Energy use 246.00 224.00 210.00 214.38 210.27
Calcination 368.00 363.00 358.00 364.78 361.10
Transportation 33.00 31.00 31.00 30.66 30.26
contents of mineral admixtures, and it is necessary to subtract them from the emissions calculations, since they are inserted at the end of the cement production process, not being part of the complete production process [23]. This way, only the clinker contained in each type of cement is considered, according to the limits set by the corresponding technical standards [24-28].
In the estimation of emissions caused by the production of the aggregates, indicators found on the literature were used, such as 5.81 kgCO2/t for natural sand and 15.46 kgCO2/t for gravel [32]. For the estimation of emissions for concrete transportation, Lima [5] suggests using 8.4 kgCO2/t.
Therefore, according to Equation 4, with the sum of all CO2 emissions (in kgCO2/g) regarding cement production (Ecim), aggregate production (Eagr) and concrete transportation(Etrans-con), it is possible to estimate the emissions of the concrete production, provided that the concrete proportioning is known.
(4)
3.3 Step 3 – Estimating carbonation depth
To estimate the carbonation depth it is necessary to consider the
exposure conditions of the structure (defined in step 1), as well as
employing a model of carbonation depth behavior over time, for
which the mathematic model of Possan [33] was used, as shown in Equation 5.
(5)
In which:
y = average carbonation depth of the concrete, in mm;
fc = average characteristic compressive strength of concrete, in MPa;
kc = variable factor relative to the type of cement used (Table 5.a);
kfc = variable factor related to the compressive strength of the concrete, according to the type of cement used (Table 5.a);
t = concrete age, in years;
ad = pozzolanic admixture content in the concrete, in % of concrete
mass;
kad = variable factor relative to pozzolanic admixtures in the
concrete – silica fume, metacaulin and rice husk ash, according to the type of cement used (Table 5.a);
UR = average relative humidity, in %/100;
kur = variable factor related to relative humidity, according to the type of cement used (Table 5.a);
CO2 = atmospheric CO2 content, in %;
kco2 = variable factor related to the CO2 content in the environment, according to the type of cement used (Table 5.a);
kce = variable factor related to rain exposure, according to the exposure conditions of the structure (Table 5.b).
Possan model [33] is used because it shows good results when
estimating the carbonated depth (it represents 85% of tested cases) and demands input data easily obtained (concrete compressive strength, type of cement, CO2 content in the exposure environment) [34].
3.4 Step 4 – Estimating CO
2uptake throughout
the concrete structure service life
To estimate the CO2 uptake during the service life (SL) of the structures (70-year period), carbonation calculations were conducted considering the concrete in the structural element
presented in Figure 3.a in different configurations (corresponding
to Tables 1 and 2). Through stoichiometric calculations, the CO2
uptake due to carbonation was estimated by Equation 6.
(6)
In which: “y” is the carbonation depth (in meters), “c” is the amount of cement used to produce one cubic meter of concrete (without
Table 5
Coefficients of the model according to: (a) concrete characteristics and environment conditions;
(b) exposure conditions [33]
(a)
Type of cement
Properties of concrete Environmental conditions
Cement fc Addition CO2 UR
kc kfc kad kco2 Kur
CP I 19.80 1.70 0.24 18.00 1300
CP II E 22.48 1.50 0.32 15.50 1300
CP II F 21.68 1.50 0.24 18.00 1100
CP II Z 23.66 1.50 0.32 15.50 1300
CP III 30.50 1.70 0.32 15.50 1300
CP IV 33.27 1.70 0.32 15.50 1000
CP V ARI 19.80 1.70 0.24 18.00 1300
(b)
Exposure conditions of structures
Sheltered from rain kce
Indoor sheltered from rain 1.30
Outdoor, sheltered from rain 1.00
142 IBRACON Structures and Materials Journal • 2018 • vol. 11 • nº 1
considering the mineral admixtures) (in kg/m³), “CaO” is the amount of calcium oxide contained in the cement (in %), “r” is the CaO proportion completely carbonated (in %), “A” is the concrete
superficial area exposed to CO2 action (in m²) and “M” is the CO2/ CaO mole fraction.
3.5 Step 5 – Estimating CO
2uptake in the
post-demolition period
To estimate the CO2 uptake after the demolition of the structure, concrete elements were assumed to be crushed and to have its dimensions reduced to the scale of aggregates in the simulation. To do
so, since carbonation occurs from the surface to the inner layers of the structure, the “cover” of the concrete carbonated during service life was removed, the “non-carbonated concrete” was transformed in cubes with small dimensions (i.e. 30x30x30 mm bricks), as represented in Figure 3.b. The exposure of these elements to CO2 activity for a certain time period was considered (30 years or the time interval needed for full carbonation of the concrete elements to occur). The cubic shape was adopted to simulate the crushed elements since this geometry provides an easier way to describe carbonated and non-carbonated volumes in the post-demolition period. For the length adopted for the sides of the
cubes, it is reported that analyzed samples of demolition waste have
average characteristic dimension of 30 mm.
Figure 3
Concrete elements during: (a) service life; (b) post-demolition
Concrete element (life cycle) Concrete element (post-demolition)
B
B
A
B
Figure 4
Therefore, to estimate CO2 uptake by the concrete post-demolition, the following substeps:
a) Estimative of carbonation depth at the end of the service life of
the structure (70 years) according to Step 3;
b) Estimative of the volume of carbonated concrete (Equation 7) and non-carbonated concrete (Equation 8) during service life; c) Definition of approximated dimensions of the concrete elements
(cubes) after demolition;
d) Computation of the new total superficial area of concrete
elements after demolition;
e) Determination of carbonation depth in the post-demolition
period (applying Equation 5);
f) Computation of the new carbonated superficial area (Equation
9) to determine the amount of CO2 uptake (kg/m³) after
demolition (Equation 6).
(7)
(8)
(9)
In which:
Vcarb = Volume of carbonated concrete during service life (in m³);
y = Concrete carbonation depth over time (in m);
Ast = Total superficial area of the concrete element that is in contact
with the atmosphere during SL (in m²);
Vnc = Volume of concrete that has not been carbonated (in m³);
Vee = Total volume of concrete element in SL (in m³);
Table 6
Concrete carbonation depth over time, as a function of the type and consumption of cement
Type of cement
C1 (kg/m³)
Depth carbonation (mm)
Structure (As2 = 6,5 m²) Waste particles (post-demolition) (As2 = 64±1 m²)
5 10 20 30 40 50 60 70 75 80 85 90 95 100
CP II Z
300 10 14.3 20.1 24.6 28.4 31.8 34.9 37.5 10 14.5 * * * *
400 5.6 7.8 11.2 13.6 15.7 17.6 19.2 20.8 5.6 7.76 9.51 10.9 12.2 13.4
500 3.9 5.6 7.9 9.7 11.2 12.6 13.7 14.9 3.9 5.42 6.64 7.67 8.57 9.39
580 3.3 4.7 6.6 8.2 9.3 10.5 11.4 12.5 3.3 4.46 5.47 6.31 7.06 7.74
CP II E
300 10.3 14.6 20.6 25.2 29.1 32.6 35.7 38.6 10.3 14.5 * * * *
400 5.5 7.8 11.0 13.5 15.5 17.4 19.0 20.6 5.5 7.76 9.51 10.9 12.2 13.4
500 3.8 5.4 7.7 9.4 10.8 12.1 13.3 14.4 3.8 5.42 6.64 7.67 8.57 9.39
580 3.2 4.5 6.3 7.7 8.9 10.0 10.9 11.8 3.2 4.46 5.47 6.31 7.06 7.74
CP II F
300 11.0 15.5 21.9 26.8 31.0 34.6 37.9 41.0 11.0 * * * * *
400 5.4 7.6 10.8 13.2 15.3 17.1 18.7 20.2 5.4 7.62 9.34 10.7 12.0 13.2
500 3.6 5.0 7.1 8.7 10.0 11.2 12.3 13.3 3.6 5.02 6.14 7.10 7.93 8.69
580 2.8 4.0 5.7 7.0 8.1 9.0 9.9 10.7 2.8 4.02 4.93 5.69 6.36 6.97
CP III
300 15.4 21.8 30.9 37.8 43.7 48.8 53.5 57.8 15.4 * * * * *
400 7.1 10.1 14.2 17.4 20.1 22.5 24.6 26.6 7.1 10.0 12.3 14.2 * *
500 4.0 5.7 8.0 9.8 11.3 12.6 13.9 15.0 4.0 5.65 6.92 7.99 8.94 9.79
580 2.9 4.2 5.9 7.2 8.3 9.3 10.2 11.0 2.9 4.16 5.10 5.89 6.58 7.21
CP IV
300 11.5 16.2 22.9 28.1 32.5 36.3 39.7 42.9 11.5 * * * * *
400 5.6 7.9 11.2 13.8 15.9 17.8 19.5 21.0 5.6 7.94 9.73 11.2 12.5 13.7
500 3.7 5.3 7.5 9.2 10.6 11.8 12.9 14.0 3.7 5.28 6.47 7.47 8.35 9.15
580 3.0 4.2 6.0 7.3 8.5 9.5 10.4 11.2 3.0 4.23 5.19 5.99 6.70 7.34
CP V ARI
300 7.3 10.3 14.5 17.8 20.5 23.0 25.2 27.2 7.3 10.2 12.5 14.5 * *
400 3.1 4.4 6.3 7.7 8.8 9.9 10.8 11.7 3.1 4.42 5.41 6.25 6.99 7.66
500 1.9 2.7 3.8 4.6 5.3 6.0 6.5 7.1 1.9 2.67 3.27 3.77 4.22 4.62
580 1.4 2.0 2.9 3.5 4.0 4.5 5.0 5.4 1.4 2.02 2.47 2.85 3.19 3.50
144 IBRACON Structures and Materials Journal • 2018 • vol. 11 • nº 1
3.6 Step 6 – CO
2balance
To balance the CO2 during the life cycle (LC) of concrete structures,
(10)
Figure 5
Evolution of CO
2uptake over time for concretes with blended cements (CP II Z. E and F) and with
different consumptions
Figure 6
4. Results and discussions
In Figure 4, two analysis performed with the various concretes listed
in Tables 1 and 2 are presented. The first one (axis of ordinates
on the left) refers to the cement consumption (kg/m³) needed to produce concretes with characteristic compressive strength of
20, 25, 30, 35, 40 and 45 MPa. The second one reports the CO2 emissions (in kg) associated with concrete production (axis of ordinates on the right) as a function of the compressive strength. It was observed that concrete elements with higher compressive strength demand more cement per volume in their production, as was reported by Mehta and Monteiro [3], also, they release a larger volume of CO2 to the atmosphere, proving that emissions grow gradually with the increase in binder consumption by the concrete. Table 6 presents the carbonation depth of the structures over time for consumptions of 300, 400, 500 and 580 kg/m³ (calculated
by Equation 4). In some cases (all the concretes with 300kg/m³
consumption, regardless of the type of cement), it was observed that, in the post-demolition period, the concrete was completely carbonated before the end of the 30-year period. This fact is explained by the shape and dimensions of the demolition waste particles, which were assumed as cubes with 30 mm sides. Considering that the CO2 can enter though all faces of cube, the maximum carbonation depth of each particle is 15 mm (see detail of Figure 3.b), what is easily obtained in concretes with low compressive strength or high water/cement ratio.
The increase in cement consumption has direct impact in compressive strength (see Tables 1 and 2) if the same water/ cement ratio is adopted. The elevation in concrete compressive strength causes a decrease in the carbonation depth of the material [33, 35], reducing the amount of carbon absorbed by the atmosphere (see Figures 5 and 6). According to Kumar and
Bhattacharjee [36], due to the influence of the water/cement ratio,
concretes with greater strengths show less porosity, hindering the CO2 intake. Therefore, the potential of CO2 uptake due to concrete carbonation is decreased, as observed in this research.
In Figures 5 and 6, the values of CO2 (kg) taken from the atmosphere by the concrete structures over their service life (0 to 70 years) and in the post-demolition period (71 to 100 years) are presented as a function of the type and consumption of cement. A further analysis
of these Figures, in parallel with Table 6, verifies that, for cement
consumptions between 300 and 400 kg/m³, the carbonation front is larger, resulting in a higher CO2 uptake.
It is possible to verify that for concretes with consumptions higher
than 300 kg/m³ and compressive strength over 20 MPa, the CO2 uptake potential due to concrete carbonation in the structure
demolition (considering only the first five years of the post-demolition
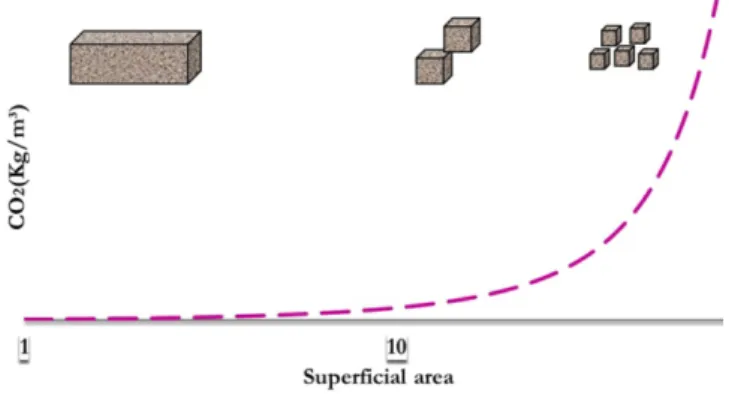
Figure 7
CO
2uptake as a function of the concrete element
superficial area [22]
Figure 8
146 IBRACON Structures and Materials Journal • 2018 • vol. 11 • nº 1
period) is on average 60% superior to the service life period. This indicates the importance of considering the structure demolition in the CO2 emissions balance. This result is related to the larger
superficial area of concrete exposed to carbon gas action (present in
the atmosphere) in the structure post-demolition period (see Figure 7), generating, thus, a higher taking of CO2 due to carbonation, as exposed in the literature [19, 22, 37].
Regarding the emissions balance (emitted CO2 volume vs. captured CO2 volume, according do Equation 9), it was possible to
determine, for the different types of agglomerates, the consumption
which result in the higher CO2 balance (Figures 8 and 9).
For concretes with CP II Z (Figure 8), the 380 kg/m³ consumption was
the one that generated the best emissions balance, reabsorbing around 94% if all the CO2 emitted in its production. For concretes with CP II E,
CP II F, CP III, CP IV and CP V, the consumptions that generated the
best balances for each type of cement were, respectively, 380, 380, 420, 420 and 300 kg/m³. It can be seen that on average the concretes produced with type II, III and IV cements show ideal consumption (regarding CO2 balance) between 380 and 420 kg/m³, suggesting that
in this range there is an optimum point (optimization point) in the curve
cement consumption versus CO2 uptake.
Finally, for concretes with cement CP V (Figure 9), the 300 kg/
m³ consumption was the one that presented the best results concerning the emissions balance, ensuring that 86% of the CO2 released in its production was reabsorbed from the atmosphere in the 100 years of analysis. It can be noted that the maximum value of CO2 capture by the concrete with CP V was considerably lower than the other four types of cement (between 94 and 99%), and that the consumption that achieves the best balance is 300 kg/m³, a lower value than the other types. These results were obtained
due do different factors, such as: (i) smaller content of mineral
admixtures in the cement (and, consequently, higher content of
clinker) (ii) higher mechanical strength and higher CO2 penetration (due to the lower porosity of the concrete matrix and alkaline reserve availability); (iii) lower consumption of necessary cement for the production of concretes with greater strength.
5. Conclusions
The CO2 uptake due to concrete carbonation can be relevant to the construction industry because, through knowledge of this process, it becomes possible to designate concretes by their performances in respect to durability, less cement consumption and CO2 uptake potential. In the future, these parameters could be considered as compensatory measures in the design of concrete structures. Regarding emissions balance, concretes with cement consumption between 380 and 420 kg/m³ presented the best performances, capturing more than 90% of the CO2 emitted during their production.
Concretes produced with CP II, CP III and CP IV cements show, in
average, the same intervals for the optimum point between cement consumption, carbonation depth and CO2 uptake. The emissions
balance for the different cement consumptions is, in average,
74% (average amount of carbon dioxide that is taken from the atmosphere by the concrete, compensating the emissions in its production).
Concretes produced with CP IV cement present generally the
best emissions balance. Regardless of the cement consumption
analyzed, the average balance is of 81%. The concretes can be
produced with larger cement consumptions and still have a good sustainability index (with respect to CO2 emissions).
Concretes with CP V show the worst CO2 balances, in comparison with the others, reabsorbing in average 50% of the emitted CO2. This work also indicated an optimal point between cement consumption, carbonation depth and CO2 uptake situated between
Figure 9
380 and 420 kg of cement per m³ of concrete. This point generates an average carbonation depth during service life compatible with the durability performance (carbonation depth smaller that the concrete cover on the reinforcements).
6. Acknowledgments
The authors thank the financial supported by CEASB – Center of Advances Studies in Dams Security, to FPTI – Fundação Parque Tecnológico de Itaipu, to CNPq – Brazilian National Council of Scientific and Technological Development and to UNILA – Federal
University of the Latin American Integration for its collaboration.
7. Literature references
[1] ALI, M.; SAIDUR, R.; HOSSAIN, M. A review on emission analysis in cement industries. Renewable and Sustainable
Energy Reviews, vol. 15, pp. 2252-2261, 2011. doi: 10.1016/j.
rser.2011.02.014.
[2] SNIC. Sindicato Nacional da Indústria do Cimento. “Relatório Anual,” Rio de Janeiro, 2010.
[3] MEHTA, P. K.; MONTEIRO, P. J. M. "Concrete: Microstructure, Properties, and Materials", fourth ed., McGraw-Hill, 2014.
[4] SNIC. Sindicato Nacional da Indústria do Cimento. “Relatório anual”, Rio de Janeiro, 2013.
[5] LIMA, J. Avaliação das consequências da produção de
concreto no Brasil para as mudanças climáticas, São Paulo: Tese (Doutorado em Engenharia) - Escola Politécnica da Universidade de São Paulo, Departamento de Engenharia de Construção Civil, EPUSP, 2010.
[6] BRASIL. Ministério da Ciência, Tecnologia e Inovação
(MCTI), “Relatório de referência. Emissões de Gases de Efeito Estufa nos Processos Industriais. Produtos Minerais. Parte I: Produção de Cimento”. Disponível em: www.mct. gov.br/upd_blob/0228/228962.pdf, Brasília, 2010.
[7] PADE, C.; GUIMARÃES, M. The CO2 uptake of concrete in a 100 year perspective. Cement and Concrete Research, vol. 47, nº 9, p. 1384–1356, 2007. doi:10.1016/j. cemconres.2007.06.009.
[8] BAKKER, F. M. Initiation period. In: Corrosion of steel in
concrete, London: Chapman & Hall, 1988, p. p. 22–5.
[9] GENTIL, V. Corrosão, LTC, Rio de Janeiro: Ed. LTC. 3º Edição, 2006..
[10] ANDRADE, C. Calculation of diffusion coefficients in
concrete from ionic migration measurements. Cement and Concrete Research, vol. 23, nº 3, pp. 724-742, 1993. [11] HAMADA, M. Concrete carbonation and steel corrosion.
Cement/Concret, nº 272, pp. 2-18, 1969.
[12] GALAN, I.; ANDRADE, C.; MORA, P.; SANJUAN, M.
Sequestration of CO2 by concrete carbonation. Environmental Science & Technolog, vol. 44, nº 8, p. 3181–3186, 2010. doi: 10.1021/es903581d.
[13] POSSAN, E.; FOGAÇA, J.; PAZUCH, C. Sequestro de CO2 devido à carbonatação do concreto: potencialidades da barragem de Itaipu. Revista de estudos ambientais, vol. 14, nº 2, pp. 28-38, 2012.
[14] YANG, K.; SEO, E.; TAE, S. Carbonation and CO2 uptake
of concrete. Environmental Impact Assessment Review, vol.
46, pp. 43-52, 2014. doi:10.1016/j.eiar.2014.01.004.
[15] HARBERT, G.; ROUSSEL, N. Study of two concrete
mix-design strategies to reach carbon mitigation objectives. Cement & Concrete Composites, vol. 31, pp. 397-402, 2009. doi:10.1016/j.cemconcomp.2009.04.001.
[16] GAJDA, J.; MILLER, F. Concrete as a Sink for Atmospheric
Carbon Dioxide: a Literature review and estimation of CO2
absorption by Portland Cement Concrete. PCA. R&D Serial
no. 2255, Chicago, 2000.
[17] PADE, C. The CO2 uptake of concrete in the perspective of life cycle inventory. In: International Symposium on Sustainability in the Cement and Concrete Industry, Norway, 2007.
[18] GAJDA, J. Absorption of Atmospheric Carbon Dioxide by Portland Cement. PCA, Serial no. 2255, Chicago, 2001. [19] LEE, S.; PARK, W.; LEE, H. Lifecycle CO2 assessment
method for concrete using CO2 balance and suggestion to decrease LCCO2 of concrete in South-Korean apartment.
Energy Build, vol. 58, p. 93–102, 2013. http://dx.doi.
org/10.1016/j.enbuild.2012.11.034.
[20] JACBSEN, S.; JAHREN, P. Binding of CO2 by Carbonation
of Norwegian OPC Concrete. In: CANMET/ACI International
Conference on Sustainability and Concrete Technology, Lyon, 2002.
[21] HASELBACH, L.; THOMAS, A. Carbon sequestration in
concrete sidewalk samples. Construction and Building Materials, 2014.
[22] FELIX, E.; POSSAN, E. Sequestro de CO2 em estruturas de concreto em uma perspectiva de 100 anos. In: 56º Congresso Brasileiro do Concreto, Natal, 2014.
[23] FELIX, E.; POSSAN, E.; THOMAZ, W. Metodologia para
estimativa da captura de CO2 devido à carbonatação do
concreto. In: Estudos ambientais, vol. 4, C. Poleto, Ed.,
Interciência Ltda, 2017.
[24] PAULETTI, C.; POSSAN, E.; DAL MOLIN, D. C. C.
Carbonatação acelerada: estado da arte das pesquisas no
Brasil. Ambiente construído, vol. 7, pp. 7-20, 2007.
[25] ASSOCIAÇÃO BRASILEIRA DE NORMAS TÉCNICAS (ABNT). Cimento Portland composto - NBR 11578, Rio de
Janeiro, 2001. Versão Corrigida:1997.
[26] ASSOCIAÇÃO BRASILEIRA DE NORMAS TÉCNICAS (ABNT). Cimento Portland de alto forno - NBR 5735 EB208,
Rio de Janeiro, 1991.
[27] ASSOCIAÇÃO BRASILEIRA DE NORMAS TÉCNICAS (ABNT). Cimento Portland Pozolânico - NBR 5736, Rio de
Janeiro, 1991.
[28] ASSOCIAÇÃO BRASILEIRA DE NORMAS TÉCNICAS (ABNT). Cimento Portland de alta resistência inicial - NBR 5733 EB2, Rio de Janeiro, 1991.
[29] IPCC. Guidelines for National Greenhouse Gas Inventories. Intergovernmental Panel on Climate Change, 2006.
http://www.ipcc.ch.
[30] CSI: Cement Sustainability Initiative. WBCSD: World Business Council for Sustainable Developement, 2011. [Online]. Available: http://www.wbcsdcement.org/pdf/tf1_ CO2%20protocol%20v3.pdf. [Acesso em 14 4 2016].
148 IBRACON Structures and Materials Journal • 2018 • vol. 11 • nº 1
Energético Nacional 2012: Ano base 2011. Empresa de Pesquisa Energética - EPE, Rio de Janeiro, 2012.
[32] MARCOS, M. Análise da emissão de CO2 em edificações
através de uma ferramenta CAD-BIM. In: SIGraDi 2009 SP –
From Modern to Digital: The Challenges of a Transition, São
Paulo, 2009.
[33] POSSAN, E. Modelagem da carbonatação e previsão da
vida útil de estruturas de concreto em ambiente urbano,
Porto Alegre: Tese (Doutorado em Engenharia) - Escola de Engenharia, Programa de Pós-Graduação em Engenharia Civil, UFRGS, 2010.
[34] DAL MOLIN, D. C. C.; MASUEIRO, A. B.; ANDRADE, J. J. O.; POSSAN, E.; MASUEIRO, J. R.; MENNUCCI, M. M. Contribuição à Previsão da Vida Útil de Estruturas de Concreto. In: Claudio de Souza Kazmierczak, Márcio Minto Fabrício. (Org.). Avaliação de Desempenho de Tecnologias
Construtivas Inovadoras: Materiais e Sustentabilidade. 1ed.:
Editora Scienza, v., p. 223-270, 2016.
[35] PAULETTI, C. Estimativa da carbonatação natural de materiais cimentícios a partir de ansaios aceleradose de modelos de predição, Porto Alegre: Tese (Doutorado em Engenharia) - Escola de Engenharia, Programa de Pós-Graduação em Engenharia Civil, UFRGS, 2009
[36] KUMAR, R.; BHATTACHARJEE, B. Porosity, pore size
distribution and in situ strength of concrete. Cement and Concrete Research, vol. 33, p. 155–164, 2003.
[37] POSSAN, E.; FELIX, E.; THOMAZ, W. CO2 uptake by carbonation of concrete during life cycle of building
structures. Journal of Building Pathology and Rehabilitation,