Summary – In this paper the application of Artificial Intelligence to on-line dynamic security assessment of isolated power systems with increased wind power penetration is presented. The developed security functions have been integrated in the dynamic security assessment module of the advanced control system of the island of Crete providing timely warning of insecure operating conditions with very satisfactory accuracy.
Keywords — Dynamic Security, Isolated Power Systems, Wind Power, Artificial Intelligence, Decision Trees, Kernel Regression Trees, Neural Networks.
1. INTRODUCTION
In isolated power systems, like the ones operating in large islands, electric power is usually produced by Diesel Units and Gas Turbines, resulting in high costs due to fuel imports and transportation. In these systems the production of electric energy from wind presents particular interest, especially when important wind energy potential exists. Significant displacement of conventional fuels can therefore be obtained by a high wind power penetration. In this case however, it is important to ensure that the power system operation will not be adversely affected by an increased connection of this volatile form of energy in the system.
In general, the main problems faced by isolated electrical power systems are related to system security, control of frequency and management of system generation reserve [1]. A common aspect to all these problems is the requirement to ensure that sufficient 9, Heroon Polytechniou, 157 73 Zografou, Athens, GR reserve capacity exists within the system to compensate for sudden loss of generation at adequate speed. Thus,
mismatches in generation and load and/or unstable system frequency control might lead to system failures. The introduction of a high penetration from wind energy causes additional difficulties, i.e. fast wind power changes and very high wind speeds resulting in sudden loss of wind generator production can cause frequency excursions and dynamically unstable situations. Moreover, frequency oscillations might easily trigger the under-frequency protection relays of the wind parks, thus causing further imbalance in the system generation/load.
In order to guard isolated power systems against these disturbances and retain acceptable security levels, on-line dynamic security assessment functions need to be provided. Such functions have been developed within the European JOULE project CARE and have been integrated within an advanced control system installed on the island of Crete in Greece [2]. In this system, dynamic security assessment (DSA) is taken care of by a number of modules based on advanced inductive inference and statistical methods as well as artificial neural networks. More specifically, Decision Trees and Regression Trees are used for dynamic security classification, while Kernel Regression Trees and Neural Networks emulate the degree of security, evaluated by predicting the expected minimum value of system frequency and the maximum rate of frequency change for each selected disturbance. In the control center software, the relevant security evaluation functions can be activated “on call” by the operator providing dynamic security monitoring. Initial valuation of these functions has shown that timely and quite accurate assessment of frequency deviations, during the dynamic disturbances recorded, is provided.
N. Hatziargyriou*
E. Karapidakis
J. A. Peças Lopes
M. H. Vasconcelos
J.N. Fidalgo
J. Stefanakis
A. Gigantidou
National Technical University of
Athens
GREECE
Universidade do Porto (FEUP)
and INESC-Porto
PORTUGAL
Public Power Corporation
GREECE
ARTIFICIAL INTELLIGENCE TECHNIQUES APPLIED TO DYNAMIC SECURITY
ASSESSMENT OF ISOLATED SYSTEMS WITH HIGH WIND POWER
2. THE CRETE POWER SYSTEM
The power system of the island of Crete is the largest autonomous power system in Greece with the highest rate of increase in energy and power demand nationwide. Its conventional generation system consists of two major power plants with several types of oil-fired units. There are 18 thermal generating units with a total capacity of 524 MW installed, including 6 Steam Units of total capacity 112 MW, 4 Diesel Units with 50 MW, 7 Gas Turbines with 227,5 MW and one Combined Cycle plant with 134,5 MWs. In 1998 the peak load exceeded 380 MW, while the lowest load was about 100 MW. A total of 11 Wind Parks (WPs) with a nominal capacity of more than 80 MW are being installed or are planned to be installed in the near future. These WPs will be located at the eastern part of the island, that presents the most favourable wind conditions. As a result, in case of faults on some particular lines the majority of the wind parks might be disconnected. Furthermore, the protections of the WTs might be activated in case of frequency variations, decreasing additionally the dynamic stability of the system. Extensive simulations on the power system model using EUROSTAG software have shown that for the most common wind power variations, the system remains satisfactorily stable, if sufficient spinning reserve is provided [3]. On the other hand for various short-circuits and conventional unit outages, the system frequency might undergo fast changes and reach low values that can activate load shedding. In any case, the dynamic security of the system depends critically on the amount of spinning reserve provided by the conventional machines and the response of their speed governors.
3. CREATION OF LEARNING & TEST SETS The application of Automatic Learning techniques is based on previous knowledge about the behavior of the system, obtained from a large number of off-line dynamic simulations that define a data set. This data set is split into a Learning Set (LS), used to derive security evaluation structures, and a Test Set (TS) used for testing the developed structures. The data set consists of a large number of operating points (OPs) each characterized by a vector of pre-disturbance steady-state variables, called attributes. These can be directly measured (powers, voltages etc.) or indirectly calculated quantities (wind penetration, spinning reserve etc.). For the creation of the data set, the initial OPs are obtained by varying randomly the load for each load busbar, the wind power for each wind park and the wind margin. These variables are assumed to follow normal distributions around three operating profiles:
Low-load with a total load PL =100MW.
Medium-load with a total load PL =180MW.
High-load with a total loadPL =280MW.
For each of the 11 load busbars and each of the 4 aggregate wind parks in operation, a perturbation of approximately ±10% is applied around each of the above operating profiles. A dispatch algorithm approximating actual operating practices followed in the control system of Crete is applied next in order to complete the pre-disturbance OPs. For a given load PL
and wind power PW, the total conventional generation PC
given by
PC = PL – PW (1)
is dispatched to the units in operation, depending on their type and their nominal power. This means that the Steam Units and the Combined Cycle plant cover the base load, while the Gas Turbines mainly supply the peak.
For each of the OPs, a number of disturbances has been simulated using EUROSTAG. Two major disturbances have been finally selected after studying extensively the behavior of the network. These are:
a) outage of a major gas turbine
b) three phase short-circuit at a critical bus near the Wind Parks.
In fact, a unit disconnection is a frequent event and a three-phase fault, although rare, is a severe event that can occur during stormy conditions.
For each OP, the minimum value of system frequency and the maximum rate of frequency change are recorded. Both of these parameters are checked against the values that activate the under-frequency relays that protect the WPs, and the OPs are then labeled as secure/insecure.
The list of attributes characterizing each OP, includes namely:
• Active and reactive power of all power sources (Pci).
• Spinning reserve of the conventional units (SR). • Wind power penetration, expressed as ratio of the
total wind power to the load of the system (WP). • Wind margin, expressed as the ratio of the
conventional units spinning reserve to the total wind power.
• Active and reactive loads (PL).
The security criterion exploits the minimum frequency of the system after the disturbance, according to the following rule:
If fmin <= 49 Hz then the OP is insecure else it is secure
Using this approach 2765 acceptable OPs have been obtained, which were divided into the LS comprising 1844 OPs and the TS comprising 921 OPs. In this way, the capability of the security structures to evaluate correctly the security of unforeseen states can be estimated on a more objective basis.
4. DESIGN OF SECURITY EVALUATION STRUCTURES
4.1 Decision Trees
The decision tree methodology is a non-parametric learning technique able to produce classifiers about a given problem in order to deduce information for new unobserved cases. The construction of a DT starts at the root node with the whole LS of pre-classified OPs. These OPs are analysed in order to select the test T that splits them “optimally” into a number of most “purified” subsets. For the sake of simplicity, a two-class partition is considered. The test T is defined as:
T: Ai < t (2)
where t is the optimal threshold value of the chosen attribute Ai.
The selection of the optimal test is based on maximizing the additional information gained through the test. The selected test is applied to the LS of the node splitting it into two subsets, corresponding to the two successor nodes. The optimal splitting rule is applied recursively to build the corresponding subtrees. In order to detect if one node is terminal, i.e. “sufficiently” class pure, the stop splitting rule is used, which checks whether the entropy of the node is lower than a present minimum value. If it is, the node is declared a leaf, otherwise a test T is sought to further split the node. If the node cannot be further split in statistically significant way, it is termed a deadend, carrying the two class probabilities estimated on the basis of the corresponding OPs subset. A more detailed technical description of the approach followed is described in [4,5].
4.2 Kernel Regression Trees
The Kernel Regression Tree (KRT) is an hybrid algorithm that integrates regression trees (RT) with kernel regression (KR), dealing with continuous goal variables (i.e. regression problems). Like in decision trees, the design of a RT consists in the extraction of interpretable security rules. The regression problem consists on obtaining a functional model that relates the
output y with the inputs a1, a2, ...,an (OP attributes),
where the output y (denominate as goal variable) is a numerical value of the security index of the system, i.e. the minimum frequency - fmin (Hz).
Building the RT
The learning of a RT consists on the decomposition of the LS into disjoint regions where the severity/security of a disturbance (y value) is as constant as possible. The splitting rule of a node is defined by a dichotomic test, as described in (2), specified so as to minimize the MSE (Mean Squared Error) of the security index (y). The procedure continues splitting the created successor nodes, until it is not possible to reduce the MSE further in a statistically significant way or the variance has been sufficiently reduced. Finally, to avoid overfitting problems a pruning algorithm is applied. A more detailed description of the method can be found in [6].
Deriving Kernel regressors
Given a new operating point Q, a prediction for its security index, y(Q), can be obtained by applying a regression model to the learning samples stored in the RT leaf that verifies the Q operating conditions. Kernel Regression models provide prediction by a weighted average of the response y (fmin in our case) of the form:
(
)
[
]
(
)
[
]
∑
∑
= = × = samples i i h samples i i i h Q,OP D K y Q,OP D K (Q) ' y 1 1(3)
where D(Q,OPi)- normalized distance function measured in the attributes hyper-space; h - bandwidth value; Kh
[ ] [ ]
x =K x/h , K(.) is the Kernel function. The prediction is obtained using the samples (also denominated by neighbors) that are "most similar" to Q, being this similarity measured by the distance function. The Kernel function estimates the weight of each neighbor, giving more weight to neighbors that are nearest to Q. To a more detailed description of the applied KRT approach see [9].4.3 Artificial Neural Networks
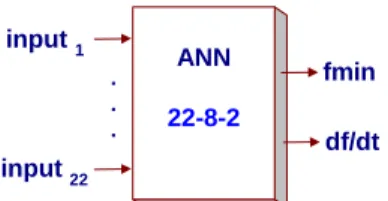
Two multi-layer ANNs were trained (one for each disturbance) using an adaptive back propagation algorithm described in [7]. For the two ANNs the following structure was selected (Figure 1) one input layer with 22 attributes as inputs, one hidden layer with 8 neurons and one output layer with the two security indices as outputs. ANN 22-8-2 fmin df/dt . . . input 1 input 22
Figure 1 –
Structure selected for training the ANNs5. NUMERICAL RESULTS
Regarding the security classification approaches, the performance is evaluated by the following indices: global classification error, false alarm and missed alarm errors, relatively to a priori classes. For the security prediction, mismatches relatively to the target output values y, in this case the minimum frequency – fmin are quantified by the mean absolute error and the mean square error. These performance evaluation indices for the short-circuit disturbance are shown in the following tables.
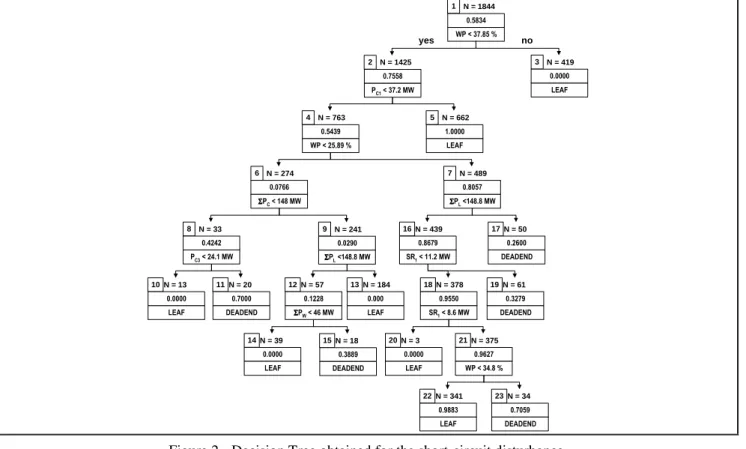
Figures 2 and 3 describe the DT and RT designed for the short-circuit disturbance. In these figures, the total number of operating points in the learning set belonging to each node are presented aside the node number. The contents of the box representing each node are respectively:
• For DT - the ratio of the secure operating points over the total number of LS OPs belonging to the node and the splitting test for non terminal nodes; Terminal nodes with a safety ratio larger than 0,5 correspond to mostly secure nodes;
• For RT – the mean value and the variance of the security index (Hz) regarding the OPs belonging to that node (for terminal nodes); For non-terminal nodes the splitting test is included.
Table 2. – Performance evaluation of the DTs
Decision Tree – Disturbance ( Short-Circuit )
Classification Performance Evaluation
Global Error 2.17%
False Alarm 1.87%
Missed Alarm 2.58%
Table 3. –Performance evaluation of the KRTs
Kernel Regress. Tree – Dist. (Short-Circuit)
Classification Performance Evaluation
Global Error 2,39%
False Alarm 1,83%
Missed Alarm 3,20%
Numerical Performance Evaluation Mean Absolute Error 0,0289 Root Mean Squared Error 0,1127
Table 4. –Performance evaluation of the NNs
Kernel Regress. Tree – Dist. (Short-Circuit)
Classification Performance Evaluation
Global Error 3,80%
False Alarm 4,40%
Missed Alarm 2,93%
Numerical Performance Evaluation Mean Absolute Error 0,0330 Root Mean Squared Error 0,0654
In Regression Trees one can assign a given degree of security to each leaf according to the mean value of the OPs that belong to the node. Tables 3 and 4 enable to compare the performance of ANNs and KRT in classification and prediction of security for the considered disturbance. Extensive results from the application of these procedures in the Crete network can be found in [8].
From the results obtained with the three approaches one can derive the following conclusions:
• When used for security classification all 3 approaches lead to small classification errors. • KRTs have the advantage of producing
simultaneously a classification structure and giving the degree of robustness of the system through the predicted value of fmin; KRT can still provide interpretable classification and regression rules. • All the security evaluation structures are able to
provide information on the system security in a very fast way.
• The DTs present, in general, simpler classification structures, which makes easier any interpretation of the phenomena and the identification of the influence of the relevant parameters.
6. IMPLEMENTATION
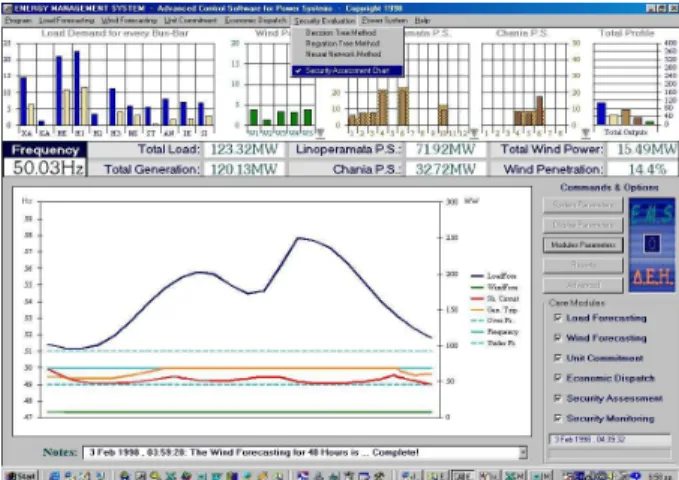
The CARE software comprises various modules for short-term load and wind power forecasting, unit commitment, economic dispatch and on-line security assessment oriented to the needs of isolated power systems with increased renewable power penetration [8]. The security evaluation structures described in Section 4 were integrated as modules, activated “on call” by the operators. In the execution cycle, security assessment follows the unit commitment and dispatch modules, leaving to the operator the decision to activate the module for validation of the proposed dispatch scenario. In Figure 4 the Dynamic Security Assessment module, as implemented in the EMS of Crete, is shown. Results for 48 hours ahead are displayed in the form of lines that represent the frequency that is expected in case of the considered disturbances under the predicted load demand and wind power production, also displayed in the same diagram. In this case the maximum frequency deviation appears within the specified security limits for both disturbances.
Figure 4. Man-Machine Interface of the Dynamic Security Assessment Module.
7. EVALUATION
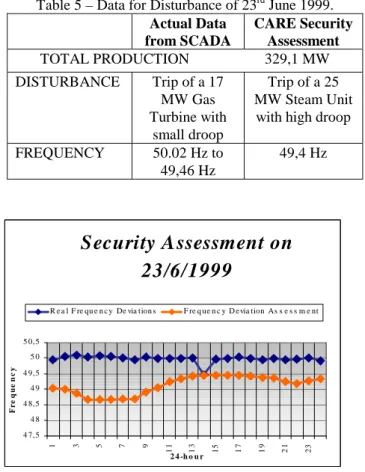
A pilot installation of CARE has been operating in Crete, since May 1999. During this time, wind parks of a total installed capacity of 32,5 MW have been operating and 27 MW more were at the final stage of their installation. During the evaluation period, the mean wind power penetration was 4,57% and the peak penetration 14,7%. From the beginning of 1999 there has been load shedding of 250 MWh, that corresponds to the energy of the whole island with middle load for one hour. From the beginning of the year, 15 trips of conventional units with load shedding, 51 trips of units without load shedding and 2 trips of Wind Parks were observed. As an example, Figure 4 shows the
information recorded during the trip of a 17 MW Gas Turbine at Chania on the 23rd of June (taking place between the 14th and 15th hours). In Table 5 this is compared to the security assessment output.
Table 5 – Data for Disturbance of 23rd June 1999. Actual Data from SCADA CARE Security Assessment TOTAL PRODUCTION 329,1 MW DISTURBANCE Trip of a 17 MW Gas Turbine with small droop Trip of a 25 MW Steam Unit with high droop
FREQUENCY 50.02 Hz to 49,46 Hz
49,4 Hz
Figure 5. Actual Frequency compared to Frequency Deviation Assessment
From the above figure it can be seen that the frequency drop predicted by the security assessment is very close to reality considering the differences in the disturbance assumed. It is clear, that enrichment of the security structures with more disturbances will provide on-line security assessment of very satisfactory accuracy. 8. CONCLUSIONS
The paper describes the application of automatic learning techniques to the evaluation of the dynamic security of isolated power systems with increased wind power penetration. These techniques have been integrated in the dynamic security assessment module of the advanced control system of the island of Crete, helping to identify the operating conditions and parameters, namely wind power penetration, that lead to a less robust operation of the system.
REFERENCES
[1] E.N. Dialynas, N.D. Hatziargyriou, N. Koskolos, E. Karapidakis, “Effect of high wind power
penetration on the reliability and security of isolated power systems”, paper 38-302, 37th Session, CIGRE, 30th August-5th Sept. 1998. [2] N. Hatziargyriou, G. Contaxis, M. Papadopoulos,
B. Papadias, J.A. Peças Lopes, M. Matos, G. Kariniotakis, E. Nogaret, J. Halliday, G. Dutton, P. Dokopoulos, A. Bakirtzis, A. Androutsos, J. Stefanakis, A. Gigantidou, “Operation and Control of Island Systems – The Crete Case”, IEEE PES WM, Singapore, January 23-37, 2000.
[3] N. Hatziargyriou, E. Karapidakis, D. Hatzifotis, “Frequency Stability of Power Systems in large Islands with high Wind Power Penetration”, Bulk Power Systems Dynamics and Control Symposium – IV Restructuring, Santorini, August 24-28, 1998. [4] L. Wehenkel and M. Pavella, "Decision tree
approach to power system security assessment”, Int. J. Electrical Power and Energy Systems, Vol. 15, No. 1, Feb 1993.
[5] L. Wehenkel, “Automatic Learning Techniques in Power Systems”, Kluwer A.P., 1998.
[6] L. Breiman, et.al, “Classification and Regression Trees”, Wadsworth International, 1984.
[7] V. Miranda, J. Fidalgo, J. Peças Lopes and L. Almeida, "Real Time Preventive Actions for Transient Stability Enhancement with a Hybrid Neural Network - Optimization Approach", Trans. on IEEE, PWRS, Vol. 10, May 1995.
[8] “CARE: Advanced Control Advice for power systems with large scale integration of Renewable Energy sources”, contract JOR3-CT96-0119, Final Report, August 1999.
[9] L. Torgo, “Kernel Regression Trees”, poster paper of the European conference on Machine Learning (ECHL-97), Prague, 1997.
Acknowledgment: The authors acknowledge the financial support of EU-DGXII of the project JOR3-CT96-0119 “CARE: Advanced Control Advice for Power Systems with Large Scale Integration of Renewable Energy Sources” within the JOULE III framework.
Security Assessment on
23/6/1999
4 7,5 4 8 4 8,5 4 9 4 9,5 5 0 5 0,5 1 3 5 7 9 1 1 1 3 1 5 17 1 9 2 1 2 3 2 4 -h o u r F r e q u e n c yN = 1844 1 0.5834 WP < 37.85 % N = 274 6 0.0766 ΣΣΣΣP C < 148 MW N = 489 7 0.8057 ΣΣΣΣP L <148.8 MW N = 378 18 0.9550 SR1 < 8.6 MW N = 61 19 0.3279 DEADEND N = 39 14 0.0000 LEAF N = 18 15 0.3889 DEADEND N = 341 22 0.9883 LEAF N = 34 23 0.7059 DEADEND N = 3 20 0.0000 LEAF N = 375 21 0.9627 WP < 34.8 % N = 1425 2 0.7558 PC1 < 37.2 MW N = 419 3 0.0000 LEAF N = 763 4 0.5439 WP < 25.89 % N = 662 5 1.0000 LEAF N = 439 16 0.8679 SR1 < 11.2 MW N = 50 17 0.2600 DEADEND N = 13 10 0.0000 LEAF N = 20 11 0.7000 DEADEND N = 57 12 0.1228 ΣΣΣΣPW < 46 MW N = 184 13 0.000 LEAF N = 33 8 0.4242 PC3 < 24.1 MW N = 241 9 0.0290 ΣΣΣΣP L <148.8 MW yes no
Figure 2 - Decision Tree obtained for the short-circuit disturbance.
Figure 3 – Regression tree obtained for the short-circuit disturbance
yes no N = 1844 1 s2 = 0.306514 Pc1 > 37.1 MW N = 13 14 Mean =47.9612 s2 = 0.057641 N = 530 13 Mean =49.0352 s2 = 0.005632 15 WP>22.5 MW 12 Pc1>36.4MW N = 7 22 Mean =47.1354 s2 = 0.019888 N = 15 23 Mean =46.7523 s2 = 0.010265 N = 2 16 Mean =49.1335 s2 = 0.000006 17 WP>26.2 MW N = 8 9 Mean =46.2162 s2 = 0.184591 8 ΣΣΣΣP C>163.7MW 7 ΣΣΣΣPL>151.3MW 6 Pc1>14.2MW N = 2 18 Mean =47.8910 s2 = 0.018496 N = 91 19 Mean =48.7661 s2 = 0.012995 N = 458 11 Mean =48.8979 s2 = 0.003651 10 Pc2>41.5MW N = 31 20 Mean =48.6173 s2 = 0.008112 N = 25 21 Mean =48.4145 s2 = 0.008991 4 SR1>11.2MW 5 Pc3 >23.9MW 3 WP >23.4% N = 662 2 Mean =49.8028
s2 = 0.003372 Pc1 - Active generation in the conventional power plant 1
SR1 - Spinning reserve in the conventional power plant 1 Pc2 - Active generation in the conventional power plant 2 Pc3 - Active generation in the conventional power plant 3 WP - Wind penetration
ΣΣΣΣPC - Total conventional active generation
ΣΣΣΣPL - Total active load
[ ] [ ] [ ]