(Annals of the Brazilian Academy of Sciences) ISSN 0001-3765
www.scielo.br/aabc
Nutrient and phytoplankton biomass in the Amazon River shelf waters
MARIA L.S. SANTOS1, KÁTIA MUNIZ2, BENÍCIO BARROS-NETO3 and MOACYR ARAUJO2
1Faculdade de Engenharia de Pesca, Campus Universitário de Bragança, Universidade Federal do Pará (UFPA)
Alameda Leandro Ribeiro s/n, 68600-000 Bragança, PA, Brasil
2Departamento de Oceanografia, Universidade Federal de Pernambuco (UFPE)
Av. Arquitetura s/n, 50740-550 Recife, PE, Brasil
3Departamento de Química Fundamental, Universidade Federal de Pernambuco (UFPE)
Av. Arquitetura s/n, 50740-550 Recife, PE, Brasil
Manuscript received on July 29, 2007; accepted for publication on May 23, 2008; presented byALCIDESSIAL
ABSTRACT
The Amazon River estuary is notable at the Amazon Continental Shelf, where the presence of the large amount of water originating from the Amazon during the river’s falling discharge period was made evident by the low salinity values and high nutrient levels. Even so, the presence of oceanic waters in the shelf area was significant. Dissolved organic nitrogen was the predominant species of the nitrogen cycle phases, followed by total particulate nitrogen, nitrate, ammonium and nitrite. The chlorophylladata in the eutrophic area indicated that there is sufficient nitrogen in the area to withstand productivity, though dissolved inorganic nitrogen removal processes are faster than regenera-tion or mineralizaregenera-tion. The anomalous amounts of inorganic dissolved nitrogen showed more removal than addiregenera-tion. The simulations with the bidimensional MAAC-2D model confirmed that high nutrient waters are displaced northwest-ward (two cores at 2.5◦N-50◦W and 4◦N-51◦W) by the stronger NBC during falling river discharge. During high river
flow period these nutrient-rich lenses are distributed around 0.5◦N-48.5◦W as well as along the shallow Amazonian
shelf (20m-50m depth, 1◦N-3.5◦N), as a result of the spreading of Amazon freshwater outflow.
Key words:Amazon Continental Shelf, nitrogen, phosphate, mathematical modeling.
INTRODUCTION
The equatorial Atlantic region has an important role over the thermohaline overturning cell and the global heat and freshwater budgets. The major ocean current reaching the Amazon mouth is the North Brazil Current (NBC), a northward flowing western boundary current that carries warm water across the equator, this season-ally retroflects into the North Equatorial Counter Cur-rent (NECC), which contributes to the formation of the anticyclone current rings (NBC rings). This region is also very complex by the generation and evolutions of the North Brazil Current (NBC) rings interactions
be-Correspondence to: Maria de Lourdes Souza Santos E-mail: mdelssantos@yahoo.com.br
tween different zonal currents and water masses trans-formations. The NBC rings are a significant contributor to transporting water across current gyres and between hemispheres in the tropical Atlantic (Bourlès et al. 1999, Johns et al. 1998, Schott et al. 2003). In this context, the Amazon and Pará rivers are the main continental forcing to the adjacent coastal waters, giving rise to al-terations in local and remote hydrological parameters. Only for example, the water discharge of the Amazon River into the continental shelf is between 100,000 m3s-1 and 220,000 m3 s-1, and the solid discharge is of 11 to 13×108tons year-1(Kineke et al. 1996).
as part of the REVIZEE (Programa Nacional de Avalia-ção do Potencial Sustentável de Recursos Vivos da Zona Econômica Exclusiva). The REVIZEE is a Brazilian Program for Assessing the Sustainable Potential of the Live Resources of the Exclusive Economic Zone (ZEE), within the ambit of the Inter-ministerial Commission for Sea Resources-CIRM that resulted from the commit-ment undertaken by Brazil in 1988, when ratifying the UN Convention on the Law of the Sea, in force since November 1994. Two specific oceanographic campaigns used herein – Operation Norte III (1999) and Operation Norte IV (2001) – were performed during the periods of high and falling discharge of the Amazon River, respec-tively.
Based on the physical and chemical data of the North III Operation, Santos (M.L.S. Santos, unpublished data) characterized the Amazon Continental Shelf as a eutrophic environment, particularly because of the chlo-rophylla values, which had a median of 1.64 mg m-3.
As described by Humborg (1997), increase in the pri-mary productivity in this shelf occurs where nutrient concentrations and the penetration of light are favor-able to phytoplankton growth.
According to DeMaster and Pope (1996), the exter-nal source of nutrients responsible for algal blooms on the outer shelf depends on which nutrients predominate. Nearly all of the silicate (83%) and most of the nitrate (62%) supplied to the outer shelf come from the river itself, whereas only half of the phosphate and only a fifth of the ammonium have a river source. The shoreward advection of subsurface waters is the dominant ammo-nium source and an important source of phosphate to the algal blooms on the outer shelf. This flow carries 5-10 times the annual flow from the Amazon River.
The overall goal of this research was to examine the processes controlling nutrient uptake and primary pro-duction on the Amazon shelf. To reach this goal, three specific objectives were pursued:
• A study of the distribution of abiotic parameters during the Amazon River’s falling discharge period;
• Determining the concentration of nitrogen com-pounds in the same period;
• Simulation with the mathematical model to repre-sent the horizontal distribution of phosphate and
nitrate in the Amazon Continental Shelf, during the high and falling discharge periods.
STUDYSITE
The Amazon shelf, which lies between the Pará estu-ary and approximately 5◦N and between the coast and
100 m isobaths, has a broad gently dipping inner shelf (approximately 250 km in width), a steeper middle shelf (40-60 m depth), and an outer shelf extending to the shelf break at the 100 m isobaths (Nittrouer and DeMaster 1996).
Circulation on the Amazon shelf is a result of the complex interaction of river discharge, strong tidal cur-rents, wind stress and the flow, close to the shore, of the North Brazilian Current (Nittrouer et al. 1991). Mixing of river and ocean waters occurs out on the Amazon shelf.
The magnitude and nature of the North Brazilian Current changes seasonally. The highest flow (30 Sver-drup) occurs in August (low river discharge); the lowest flow (10 Sv) takes place in April, during the high dis-charge period (Philander and Pacanowski 1986). From January to June, the North Brazilian Current moves northward along the coast of South America. Between June and December, however, the current retroflects east-ward at about 5◦N (Muller-Karger et al. 1988).
Depending on the location on the shelf, as well as on the tidal regime (high/low, spring/neap), the river/ ocean mixing zone can be characterized by isohaline distributions consistent with the classic “salt wedge” model or the “partially well-mixed” model of estuarine circulation (Geyer et al. 1996). Dissipation of tidal en-ergy is a very important process, affecting salinity distri-butions on the shelf (Beardsley et al. 1995), as well as sediment transport (Kineke et al. 1996).
the along-shore current component leading the plume northwestward, Lentz also showed that the ambient flow was highly influenced by the semi-diurnal tidal compo-nent variation.
MATERIALS AND METHODS
ANALYTICALMETHODS
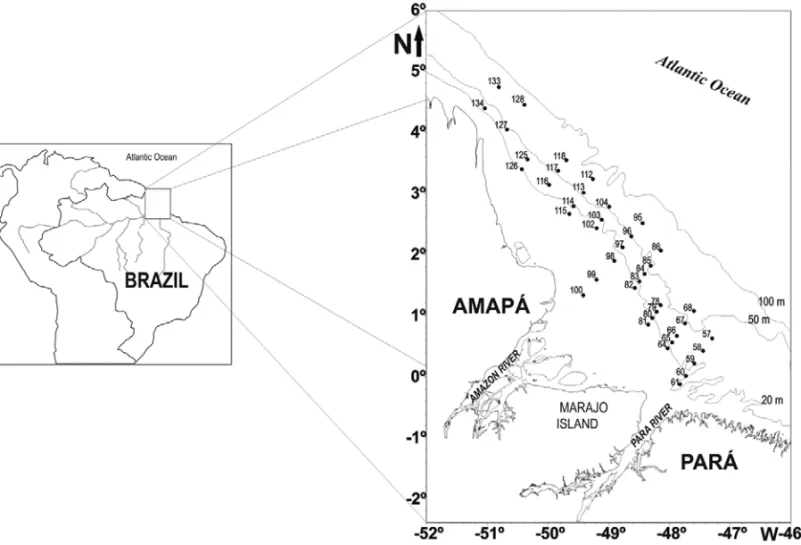
Water samples were collected in 5 L Niskin bottles, dis-tributed in a Rosette connected to a CTD (Conductivity, Temperature, Depth), in 41 oceanographic stations lo-cated in the Amazon Continental Shelf (Fig. 1), during the North IV Operation (August 2001).
The following physical and chemical parameters were determined on board the ship: temperature and salinity (recorded from the data obtained with the CTD); dissolved oxygen (DO), determined by Winkler’s method, described in Strickland and Parsons (1972); saturation rate of dissolved oxygen, obtained using UNESCO’s International Oceanographic Tables (1973); pH, measured with a HANNA pHmeter; and water transparency (determined with a Secchi disk), which allowed separation of the water column in the euphotic and aphotic layers.
To determine phosphate, ammonium, nitrate, nitrite and organic dissolved nitrogen, the water samples were filtered in 0.45µm GF/F Whatman filters, stored in
500-mL polyethylene flasks and frozen. To determine to-tal nitrogen, the water samples were stored in 250-mL polyethylene flasks, without filtering.
Subsequently, the frozen water samples were thawed at the Oceanography Laboratory of the Pará Federal University, and analyzed in duplicate to deter-mine the concentrations of the nutrients mentioned above, according to the methodology described in Grasshoff et al. (1983). The water required for the analyses was taken from an ALPHA Q. The precision of nutrient measurements was 2-5%.
The total particulate nitrogen concentration (TPN) was obtained from analyses of the total nitrogen (in the unfiltered sample) and total dissolved nitrogen (in the filtered sample) by the oxidation method using potas-sium persulfate in a basic medium. The difference be-tween the median values of total nitrogen and dissolved total nitrogen gives an estimate of the total particulate nitrogen.
The dissolved organic nitrogen concentration (DON) was estimated from the medians of the analy-ses made on the filtered samples, as the difference be-tween dissolved total nitrogen and inorganic dissolved nitrogen (sum of nitrate, ammonium and nitrite).
The particulate organic and inorganic materials (POM and PIM) were determined by the gravimetric method described in Paranhos (1996). For chlorophyll
a, the analyses were performed at the Laboratório de
Produtividade Primária of the Oceanography Depart-ment of the Federal University of Pernambuco, using the method described in Teixeira (1973).
MATHEMATICALMODEL
The bidimensional (2D) analytical model used in this study was the MAAC-2D model, developed in the Lab-oratory of Physical, Estuarine and Coastal Oceanogra-phy (LOFEC) of the OceanograOceanogra-phy Department, Fed-eral University of Pernambuco (DOCEAN/UFPE).
The MAAC-2D is a deterministic mathematical model with an analytically and temporally permanent solution. Its conception is based on the equation of the advective-diffuse transport of dynamically passive and biogeochemically active constituents. The equation (1) brings the balance of mass for each constituent C (also called state variable) in the MAAC-2D.
∂C ∂t |{z} temporal variation
+ v∂C ∂y | {z } advection
= K∂ 2C ∂y2 | {z } diffusion
− ψC
|{z} biogeochemical
changes
+ J(x,y) | {z } external
sources
(1)
where:
C = concentration of the constituent C (µmol L-1)
v = ocean current speed in the direction OY (m s-1)
K = horizontal dispersion coefficient (m2s-1)
ψ = rate of constituent change
– biogeochemical mechanisms (s-1) J(x, y) = external input of constituent
Fig. 1 – Map of the study area, showing the stations sampled during Operation North IV (Brazilian REVIZEE Program).
In the permanent situation
∂C ∂t
∼ =0
, eq. (1) becomes:
v∂C
∂y | {z } advection
= K∂ 2C ∂y2 | {z } diffusion
− ψC
|{z} biogeochemical
changes
+ J(x,y) | {z } external sources
(2)
Eq. (2) allows a simple analytical solution when we con-sider initially J(x, y) = 0, as follows:
Ch=c1er1y+c2er2y (3)
where the values of r1and r2are the roots of the
charac-teristic (second degree) equation given by,
K r2+v r+ψ=0 (4)
and whose coefficients are the values of parameters K, v andψof the proposed mathematical model – eq. (2).
The coefficients c1 and c2 in the eq. (3) are obtained
from the resolution of a system of two first degree to two unknown equations, with the use of values of C in the limits y = 0 and y = ymax (boundary conditions given
by the field data).
For J(x, y) 6=0 a source term appears as the so-lution of eq. (2). This term has the specific soso-lution Cpart.= J(x, y)/ψ, that should be added to the solution
of the homogeneous equation. Therefore the complete solution of eq. (1) is obtained as a linear combination of both homogeneous and particular solutions:
C=Ch+Cpart. (5)
taken into account through an exponential decay in the following way:
J(x, y) = J(0, y) exp(−λx) (6)
where (x, y) is the transport at the coordinate (x, y) of the study area, J(0, y) is the continental contriburtion at the lower edge of the study area (x = 0), situated closer the coastline. λ is the decay coefficient (m-1) for the
continental input, and x is the cross-shore distance along the OX axis (m).
It is important to stress that the use of the MAAC-2D model is limited to bidimensional geophysical flows submitted to mean horizontal velocity fields. The model is not able to reproduce vertical transport and state variable distributions along the water depth. By the same time, MAAC-2D routines can only take into account water quality constituents driven by biogeochemical transformations that may be mathematically repre-sented through first order kinetics. In this sense, toxic and heavy metals compounds cannot be simulated by MAAC-2D model.
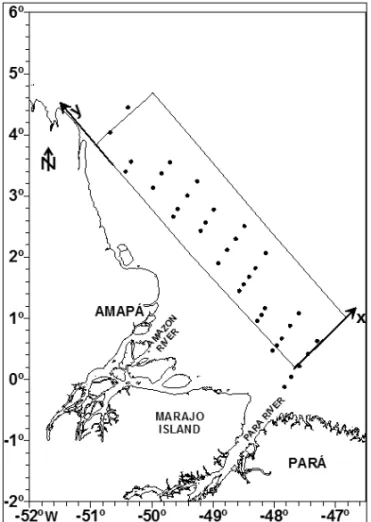
Figure 2 shows the sampling stations of Operations Norte III (high discharge of the Amazon River) and Norte IV (period of falling discharge of the Amazon River), bounded by the integration domain used in the simula-tions with MAAC-2D model.
The boundary conditions in eq. (2) are given by the nutrient concentration values at the extremes y = 0 and y = ymax, by the along shore ocean current intensity v, and by the term J(0, y) at eq. (6). These conditions were tested and chosen in order to represent numerically the situations observed during the river’s high discharge period, as well as during the falling discharge period. The average current intensity v (of the North Brazil Cur-rent – NBC) used in simulations was estimated from thein situ measurements and calculus of Schott et al.
(1998) and Johns et al. (1998). These authors covered the hydrography of the northern Brazilian coast in differ-ent transversal sections (i.e.: 35◦W and 44◦W) using a
LADCP (Lowered Acoustic Doppler Current Profiler). The horizontal dispersion coefficient K and the kinematics rate ψ in eq. (2) represent respectively the
(turbulent + dispersion) flux and the balance between the mechanisms of removal and production of nutrients (ni-trate/phosphate). The decay coefficientλin the eq. (3)
Fig. 2 – Map of the stations of the REVIZEE Program, and the inte-gration domain used in the simulations with MAAC-2D.
is associated to the reduction of the continental contri-bution of nutrients along the OX axis. Table I shows the boundary conditions and the values of the rates and coefficients used in the simulations with the MAAC-2D model.
The values for K andψ were estimated from the
theoretical/experimental results in addition to previous numerical works involving the study area (CLIPPER team 2000, Silva 2006, Silva et al. 2007). The cross-shore decayλfor N and P, and those of J(0, y) were
cal-ibrated taking into account the best agreement between numerical results and experimental sea data. The best set of parameter values (see Table I) was obtained when the minimum value of the objective function
σ = v u u t1
N
N X
1
(xit−xio)
xi m
(computed after about 20 different performed simula-tions for each river discharge scenario) was achieved. In this formulation n is the number of sample station, xi
tis
TABLE I
Boundary condition values, rates and coefficients used in the simulations with the MAAC-2D model.
Amazon river discharge – Periods
Boundary condition High Falling
V (m s-1) 0.25 0.35
J(0, y) – Nitrate (µmol L-1s-1) (9.954 – 10.001)×10-5 (9.958 – 10.001)×10-5
J(0, y) – Phosphate (µmol L-1s-1) (9.948 – 10.000)×10-5 (9.946 – 10.000)×10-5 Rates and Coefficients
K (m2s-1) 6.0×10⁴ 6.0×10⁴
ψ(s-1) 1.15×10⁻⁸ 1.15×10⁻⁸
λ(m-1) 5.0×10⁻³ 1.0×10⁻²
nitrate), xi
ois the corresponding measured value and xim
is the average, observed value of the state variable (phos-phate and nitrate) (Jørgensen and Bendoricchio 2001).
RESULTS
PERIOD OFFALLINGDISCHARGE
The descriptive statistics for the data recorded in the eu-photic (13 m average depth) and aeu-photic (20 m average depth) layers are given in Tables II and III, respectively. The median values are higher for temperature, DO and dissolved oxygen saturation rate in the euphotic layer, whereas the aphotic layer has larger medians for nitrate, nitrite, phosphate, PIM and POM. Salinity, pH and am-monium medians are very similar in the two layers.
These differences indicate that photosynthesis in the euphotic layer favors an increase in dissolved oxy-gen, whereas, in the aphotic layer, the remineralization of organic material liberates nutrients in their inorganic form (nitrate and phosphate). The larger POM value for the aphotic layer indicates the liberation of organic ma-terial from several kinds of detritus, such as fecal balls and fragments of animal and plant tissue. The PIM in-crease may be associated to a resuspension of the deep sediments.
The box-and-whisker plot in Figure 3 allows a vi-sual comparison of the temperature and salinity distri-butions in the euphotic and aphotic layers. In this kind of plot, the height of the box represents the interquar-tilic distance, the central point corresponds to median and the whiskers are limited by maximum and minimum values of the plotted variables. To compare in the same plot variables with different units, the data were first
sub-jected to an autoscaling transformation, which consists in subtracting from the original values the mean of all recorded values for the variable under consideration and then dividing this difference by the standard deviation of the same data. Consequently, the values become di-mensionless and can be easily compared. One of the features that stand out in Figure 3 is the large skewness of the salinity values, indicated by the long whiskers to-ward lower values. This is consistent with the location of sampling stations at the Amazon estuary. The tem-perature values are more spread out – and toward lower values – in the aphotic layer. This is also to be expected, as this layer corresponds to sampling points not affected by sunlight.
The boxplot of the autoscaled nutrient values is shown in Figure 4. They all have very skewed distri-butions, with long upper tails and smaller median val-ues in the euphotic layer (nitrate = 2.12µmol L-1,
ni-trite = 0.05µmol L-1, ammonium = 0.10µmol L-1 and
phosphate = 0.18µmol L-1, as given in Table II). The
interquartilic width for the nitrogenated forms indicates a variation in the distribution of the concentrations of these nutrients in both layers. In the euphotic layer, the nitrate and nitrite medians are closer to the minimum values, indicating a larger concentration of values close to the lower quartile. The interquartilic distances for phosphate are similar in both layers, with a larger me-dian in the aphotic layer (0.30µmol L-1, Table III).
val-TABLE II
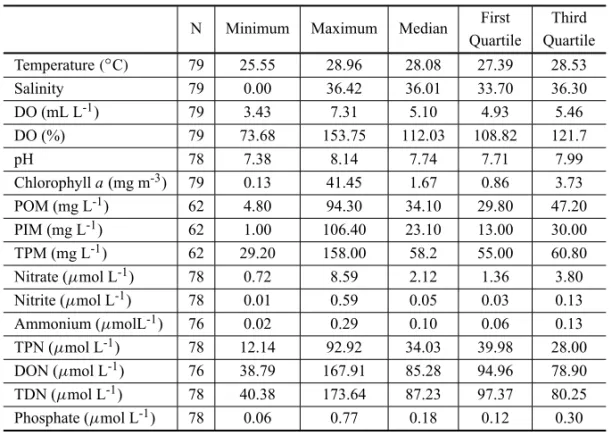
Descriptive statistics of the abiotic and chlorophylladata recorded at the Amazon Continental Shelf in the euphotic layer, during the falling discharge period.
Acronyms are as given in the text. N is the number of samples for which the statistical values were calculated.
N Minimum Maximum Median First Third Quartile Quartile Temperature(◦C) 79 25.55 28.96 28.08 27.39 28.53
Salinity 79 0.00 36.42 36.01 33.70 36.30
DO (mL L-1) 79 3.43 7.31 5.10 4.93 5.46
DO (%) 79 73.68 153.75 112.03 108.82 121.7
pH 78 7.38 8.14 7.74 7.71 7.99
Chlorophylla(mg m-3) 79 0.13 41.45 1.67 0.86 3.73 POM (mg L-1) 62 4.80 94.30 34.10 29.80 47.20 PIM (mg L-1) 62 1.00 106.40 23.10 13.00 30.00 TPM (mg L-1) 62 29.20 158.00 58.2 55.00 60.80 Nitrate (µmol L-1) 78 0.72 8.59 2.12 1.36 3.80 Nitrite (µmol L-1) 78 0.01 0.59 0.05 0.03 0.13 Ammonium (µmolL-1) 76 0.02 0.29 0.10 0.06 0.13 TPN (µmol L-1) 78 12.14 92.92 34.03 39.98 28.00 DON (µmol L-1) 76 38.79 167.91 85.28 94.96 78.90 TDN (µmol L-1) 78 40.38 173.64 87.23 97.37 80.25 Phosphate (µmol L-1) 78 0.06 0.77 0.18 0.12 0.30
TABLE III
Descriptive statistics of the abiotic and chlorophylladata recorded at the Amazon Continental Shelf in the aphotic layer, during the falling discharge period.
Acronyms are as given in the text. N is the number of samples for which the statistical values were calculated.
N Minimum Maximum Median First Third Quartile Quartile Temperature(◦C) 53 23.72 28.95 27.51 26.17 28.49
Salinity 53 0.00 36.42 36.18 35.01 36.29
DO (mL L-1) 52 3.58 5.84 4.85 4.65 5.03
DO (%) 52 80.71 122.37 104.92 100.88 109.82
pH 52 7.32 8.12 7.72 7.69 7.76
ues very similar for the two layers (7.74 and 7.72 for the euphotic and aphotic layers, respectively).
For DO distribution and its saturation rate, the me-dians were 5.10 mL L-1(112.03%) in the euphotic layer and 4.84 mL L-1(104.90%) in the aphotic layer. These values are characteristics of a saturated to supersatured environment.
As shown in Tables II and III, the phases of the nitrogen cycle in the water column are in order of decreasing values DON, followed by NTP, nitrate, ammonium and nitrite, for both layers. The predom-inant nitrogen form in the entire water column is therefore dissolved organic nitrogen (euphotic layer: 38.79µmol L-1 minimum, 167.91µmol L-1 maximum,
85.28µmol L-1 median; aphotic layer: 30.62µmol L-1
minimum, 125.3µmol L-1 maximum, 81.98µmol L-1
median). The maximum overall value, 167.91µmol L-1
was determined at Station 134, where the largest phyto-plankton biomass concentration was also measured (41.45 mg m-3).
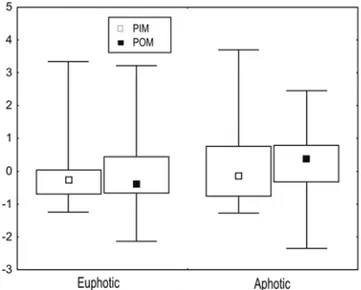
The concentration of total particulate material (TPM) during the period of falling discharge of the Amazon River varied from 29.20 mg L-1 to 158.00 mg L-1 in the euphotic layer and between 47.60 mg L-1 and 188.00 mg L-1 in the aphotic layer, as also shown in Tables II and III. These relatively high concentrations of suspended material may be related to the process of resuspension during sampling operations. The POM distribution is also quite skewed in both layers, with lower medians in the euphotic layer. The upper limit for this layer corresponds to 94 mg L-1, de-termined at Station 100, close to the mouth of the Amazon River. Even though the maximum single POM concentration has been detected in the euphotic layer, the POM levels in the aphotic layer were generally higher, as indicated by the positions of the respective boxes and the 46.80 mg L-1 median value (Table III and Fig. 5).
The PIM distributions follow the same pattern, with the difference that the median values are quite close for the two layers (euphotic: 23.10 mg L-1; aphotic: 26.60). This may be explained by the balance between the resus-pension and deposition processes.
Anomalous DIN amounts were calculated as de-scribed in DeMaster et al. (1996), using solely the
Fig. 3 – Autoscaled value distributions for temperature and salinity.
Fig. 4 – Autoscaled value distributions for nitrite, nitrate, ammonia and phosphate.
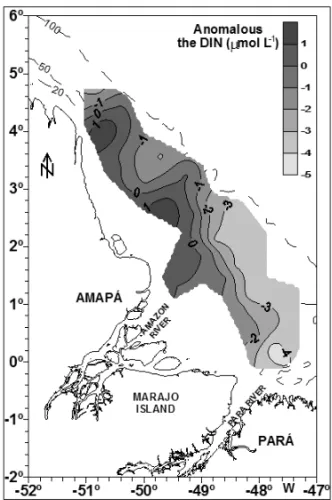
superficial data. The distribution of DIN anomalies (Fig. 6) shows positive rises between the mouth of the Amazon River and Cape Orange, suggesting that in this area the addition of this nutrient occurs not only through fluvial input, but also through other processes such as, for example, nitrification and the oxidative decomposi-tion of organic material. On the other hand, negative amounts predominated in a large area of the Amazon Continental Shelf, indicating larger removal than addi-tion of dissolved inorganic nitrogen.
Fig. 6 – Superficial distribution of the anomalous dissolved inorganic nitrogen data (DIN) during the Amazon’s falling discharge period at the Amazon Continental Shelf.
SPATIALDISTRIBUTION OFPHOSPHATE ANDNITRATE IN THEAMAZONSHELF
The bidimensional model used to represent the phos-phate and nitrate spatial distributions in the superficial layer of the Amazon Continental Shelf, though simpli-fied, contemplates the main mechanisms of influence on the balance of mass of these nutrients in the study area (Figs. 7-10). From a hydrodynamical point of view, the model is based on the assumption of the prepon-derance of advective and diffusive processes along the
axis situated parallel to the North Brazilian coast, re-sulting mainly from the action of the North Brazilian Current. With respect to the biogeochemical processes, the model assumes a flux of mass resulting from the balance between production mechanisms and the con-stituent consumption.
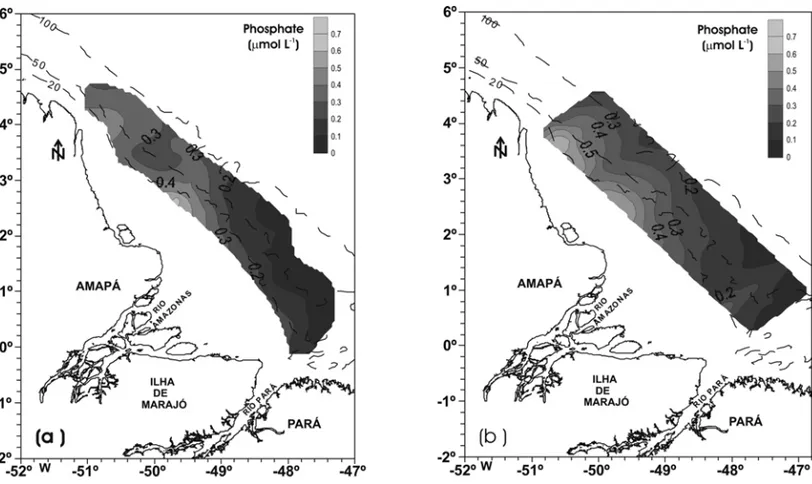
Figures 7 and 8 present the distributions of the superficial phosphate and nitrate concentrations in the Amazon Continental Shelf, obtained during the North IV Operation (2001), in the falling discharge period of the Amazon River. In these figures, these distributions are compared with the results of the simulations with the MAAC-2D model. In general, the figures indicate a cer-tain similarity, with the largest concentrations occurring close to the coast, a reduction towards the open sea and a northwesterly water mass transport caused by the North Brazilian Current.
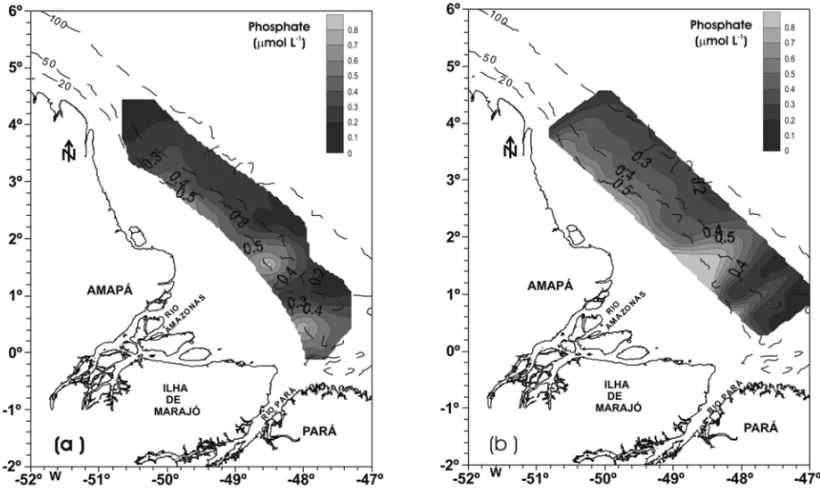
The superficial phosphate and nitrate data obtained during the North III Operation (1999), carried out in the high discharge period, are presented in Figures 9 and 10, respectively. As in the previous figures, field data are comparable to those derived from the MAAC-2D model simulations.
DISCUSSION
The temperature dispersion in the euphotic layer is slightly skewed, with a median close to the higher val-ues and a longer lower tail. In the aphotic layer, the skewness is less pronounced, with smaller median and minimum values, indicating a temperature drop with in-creasing depth, as one would expect (Fig. 3). The me-dian temperature in this layer was 27.51◦C, while in the
euphotic layer it was 28.08◦C (Tables II and III). The
distribution of this parameter confirms studies developed for the Northern ZEE (Ryther et al. 1967, M.L.S. San-tos, unpublished data, Eschrique et al. 2006), which de-scribe a thermal stability in the superficial layer, a tem-perature drop with increasing depth and the presence of the thermocline in the oceanic area.
Fig. 7 – Distribution of the superficial concentration of the phosphate during Operation Norte IV (falling discharge of the Amazon River): (a) REVIZEE data; and (b) MACC-2D model results.
Fig. 9 – Distribution of the superficial concentration of the phosphate during Operation Norte III (high discharge of the Amazon river): (a) REVIZEE data; and (b) MACC-2D model results.
in the euphotic and aphotic layers, respectively), with the medians very close to the maximum values (Tables II and III). The interquartilic distance in the aphotic layer is significantly lower, indicating a narrower distribution for the salinity rates, as shown in Figure 3.
The low salinity values caused by the Amazon River discharge are observed in a northwesterly direc-tion, due to the transport performed by the North Brazil-ian Current. Lentz (1995a) observed that from August to October approximately 70% of the Amazon plume is transported westwards, during the retroflection of the North Brazilian Current, while the remaining 30% are advected in a northeast direction towards the Caribbean. The mixed zone between the river and the ocean occurs at the shelf, because of the Amazon River immense dis-charge (DeMaster et al. 1996).
According to Carvalho and Cunha (1998), the Andean Mountain Chain (source of the Solimões and Madeira Rivers) constitutes the main natural source of sediments for the Amazon River. The suspended mate-rial in the Amazon Basin is not uniformly distributed. In 1983, during the high discharge period, Curtin and Legeckis (1986) found concentrations of approximately 200 mg L-1near the river mouth. Moreover, high sus-pended sediment concentrations (>544 mg L-1) were
observed by these authors in the Northwestern coast (ap-proximately as far as the 10 m isobar), and significant concentrations (>10 mg L-1) in the superficial waters
up to approximately 200 km towards the open sea. Milliman et al. (1974), in a study performed be-tween February and March 1973 (period of rising dis-charge), related values of suspended organic material larger than 4 mg L-1close to the outflow of the Amazon estuary and lower than 0.20 mg L-1in the oceanic waters. These authors described the suspended inorganic mate-rial as consisting of sandy grains and non-combustible biogenic material, in approximately equal proportions.
In the present study, POM quantities were larger than those described by Milliman et al. (1974). However, several physical processes, in addition to the seasonality of the river discharge, characterize the hydrodynamics of the Amazon Continental Shelf.
Nitrate was the dominant form of dissolved inor-ganic nitrogen found in this study. The values reported here are similar to those described by Santos (M.L.S.
Santos, unpublished data) during the high discharge pe-riod of the Amazon River (euphotic layer: 1.02µmol L-1
minimum, 9.54µmol L-1 maximum; aphotic layer:
2.19µmol L-1minimum, 10.21µmol L-1maximum).
In impacted areas, such as, for example, the Chi-nese estuaries, nitrate concentrations are high (Yalu-jiang, 309.8µmol L-1, Huanghe 121.0µmol L-1,
Changi-jiang, 32.9µmol L-1 Minjiang 55.5µmol L-1, Zhang
1996). The same can be observed in the Paraíba River, South Brazil (21µmol L-1 minimum and 57µmol L-1
maximum, Silva et al. 2001). BrancoapudMenezes
(1999) describes waters with high ammoniacal nitrogen concentrations as being associated to recent pollution. On the other hand, with high nitrate levels indicate long-time pollution. For the Chinese estuaries, the ammo-nium concentration in the Changijiang was determined as 14.6µmol L-1 (Zhang 1996). In the Paraíba River,
ammonium concentration varied between 1.4µmol L-1
and 6.7µmol L-1(Silva et al. 2001). From the nitrate
and ammonium data shown in Tables II and III, one can conclude that the area under study has not been impacted.
Santos (M.L.S. Santos, unpublished data) found higher ammonium amounts during the Amazon’s high discharge period (euphotic layer: 0.01µmol L-1
min-imum and 0.91µmol L-1 maximum; aphotic layer:
0.11µmol L-1 minimum and 0.97µmol L-1 maximum)
than those verified in the falling discharge period. The low ammonium concentration is the result of the heavy consumption of this nitrogenated form, which is easily assimilated by phytoplankton, and of nitrification.
The development of the marine phytoplankton is associated to the recycling of the ammoniacal nitrogen, by excretion and by degradation of dead organic ma-terial. According to Braga (E.S. Braga, unpublished data), the preference that the great majority of the ma-rine phytoplankton has for assimilating this nitrogenated species, is largely due to the energetic gain involved in its metabolism. In oligotrophic waters, ammoniacal ni-trogen assimilation can supply 80% of the local popula-tion’s nitrogen requirements.
(M.L.S. Santos, unpublished data), who found a mini-mum of 0.01µmol L-1and a maximum of 0.11µmol L-1
in the euphotic layer, and a minimum of 0.01µmol L-1
and a maximum of 0.09µmol L-1in the aphotic layer.
Total dissolved nitrogen (TDN) becomes lower with increasing depth (Tables II and III). The TDN dis-tributions are similar to the DON disdis-tributions. On the other hand, total particulate nitrogen amounts (TPN) in-crease as depth inin-creases. This suggests that the re-suspension of the particulate material, phytoplankton growth and sedimentation may have contributed to the higher TPN values observed at deeper sampling stations. DeMaster et al. (1996) described the difference be-tween the actual dissolved inorganic nitrogen concen-tration (DIN) and the theoretical concenconcen-tration of the mixture diagram as an anomaly of the Amazon Conti-nental Shelf. Positive values would indicate the addition of inorganic nitrogen and negative values, the removal of this nutrient. The data of these authors reflected more assimilation than regeneration, with a negative anomaly for this nutrient.
The distribution of DIN anomalies (Fig. 6) shows positive peaks between the mouth of the Amazon River and Cape Orange, whereas negative amounts predomi-nate in a large area of the Amazon Continental Shelf.
The data for chlorophylla is consistent with a
eu-trophic area (1.67 mg m-3median), indicating that there is sufficient nitrogen in the area to withstand the pro-ductivity, although with DIN removal processes that are faster than regeneration or mineralization. One can ob-serve that nitrogen is mainly available in the two first sections of the cycle phase, in the TPN and DON forms. The simulations with the MAAC-2D model poin-ted out differences in the distribution of the superficial concentrations phosphate and nitrate, according to the seasonality of the discharge of the Amazon river. High concentrations throughout the Amazon Continental shelf observed from sea data were well reproduced by the model.
During periods of transition between high and low discharges (Operation Norte IV – Figs. 7 and 8) the ad-vection of waters from the south is enhanced as a re-sult of the westward South Equatorial Current (SEC) and North Brazil Undercurrent (NBUC) increase over the boreal summer (Schott et al. 1998, Johns et al. 1998).
NBC currents are also accelerated by the stronger trade winds (da Silva et al. 1994), and reach their maximum at late summer, connecting with eastward NECC through the Guyana retroflection zone (Schott et al. 1998, Johns et al. 1998, Bourlès et al. 1999). So, during this pe-riod the cores of high nutrient concentrations are present in the northern part of the integration domain since at this time the transport by the NBC is greater and surface nutrient rich (and low salinity) waters would be dis-placed and spread northwestward (Müller-Karger et al. 1988, Johns et al. 1990, Geyer at al. 1996, Hu et al. 2004). In particular model results confirm the pres-ence of two main cores of phosphate (Fig. 7) and nitrate (Fig. 8) placed around the coordinates (2.5◦N-50◦W)
and (4◦N-51◦W).
During the high discharge period (Operation Norte III – Figs. 9 and 10), the most important values of phos-phate and nitrate concentrations are observed (and re-produced by the model) on the central and southern parts of the Amazonian shelf, as a result of the spreading of Amazon freshwater outflow. High concentrations are also verified along the Pará coast and are mainly induced by increasing trade winds shear, which transport fresh-water lenses southwestward during this boreal spring season (e.g. Geyer et al. 1996, Silva et al. 2007). Model results confirm that high nutrient concentrations during this period are verified around (0.5◦N-48.5◦W), as well
as in the coastal water area distributed along the Ama-zonian shoreline between 20 m-50 m depth in the range (1◦N-3.5◦N).
CONCLUSIONS
The presence on the Continental Shelf of waters from the Amazon River is indicated by low salinity levels, together with high levels of nutrients and total partic-ulate material. On the other hand, the presence of the oceanic waters is significant during the falling of dis-charge period.
and for the aphotic layers. The figures for nitrate and am-monium indicate a non-impacted area, and the anoma-lous negative values of the inorganic dissolved nitrogen in a large area of the Amazon Continental Shelf show that there is more removal than addition of this nitro-genated form.
The data for chlorophyllain the eutrophic area indi-cate that there is sufficient nitrogen to withstand produc-tivity in this area, though with DIN removal processes are faster than those of regeneration or mineralization.
Simulation results obtained with the bidimensional analytical approach MAAC-2D model confirmed that the main geophysical processes contributing to the hor-izontal distribution of nutrients in the Amazonian shelf is the temporal changes in continental rivers discharges associated to seasonal variability of NBC and trade winds. During periods of transition between high and low discharges high phosphate and nitrate concentra-tions are present in the northern part of coastal area once nutrients are transported northwestward by a strongest NBC, while during the high discharge period phosphate and nitrate concentrates on the central and southern parts of the Amazonian shelf, as a result of the spreading of Amazon freshwater outflow.
ACKNOWLEDGMENTS
We thank the scientific and crew-members of the R/V Antares of the Brazilian Navy for their effort and dedi-cation during the oceanographic expeditions, as well as the Conselho Nacional de Desenvolvimento Científico e Tecnológico (CNPq) and the Brazilian Navy for support. The authors also thank the anonymous referees for their fruitful comments on this paper.
RESUMO
O estuário do rio Amazonas é notável na Plataforma Continen-tal do Amazonas, onde a presença das águas fluviais foi de-tectada, mesmo durante o período da diminuição da descarga desse rio, pelos baixos valores de salinidade e altos valores de nutrientes. Contudo, a presença das águas oceânicas tam-bém foi marcante. Em relação às fases do ciclo do nitrogênio, o nitrogênio orgânico dissolvido foi a forma predominante, seguido do nitrogênio total particulado, nitrato, amônia e ni-trito. Os dados de clorofilaa indicaram uma área eutrófica onde há nitrogênio embora os valores da anomalia do
nitrogê-nio inorgânico dissolvido tenham mostrado que ocorre maior remoção do que adição dessa forma nitrogenada na área em estudo. Os resultados das simulações com o modelo bidimen-sional MAAC-2D confirmaram que as águas ricas em nutrientes são deslocadas para noroeste (dois núcleos em 2,5◦N-50◦W
e 4◦N-51◦W), pela ação de uma CNB mais forte durante o
período de decaimento da vazão dos rios. No período de vazão máxima, estas lentes de águas ricas de nutrientes distribuem-se próximo de 0,5◦N-48,5◦W, bem como ao longo da plataforma
Amazônica rasa (20m-50m profundidade, 1◦N-3,5◦N), como
resultado do espalhamento da água doce de origem continental.
Palavras-chave:Plataforma Continental do Amazonas, nitro-gênio, fosfato, modelagem matemática.
REFERENCES
BEARDSLEYRC, CANDELAJ, LIMEBURNERWR, GEYER SJ, LENTZ BM, CASTRO D, CACCHIONE AND CAR -NEIRO N. 1995. The M2 tide on the Amazon shelf. J Geophys Res 100: 2283–2319.
BOURLÈSB, GOURIOUYANDCHUCHLAR. 1999. On the circulation in the upper layer of the western equatorial Atlantic. J Geophys Res 104: 21151–21170.
CARVALHONOANDCUNHASB. 1998. Estimativa da carga sólida do rio Amazonas e seus principais tributários para a foz e oceano: uma retrospectiva. Revista técnica e in-formativa da CPRM 4: 44–58.
CLIPPER PROJET TEAM2000. 1/6◦Atlantic Circulation model forced by the ECMWF clymatology: preliminary results. LEGI report number CLIPPER-R2, also available at www.ifremer.fr/lpo/clipper.
CURTINTBANDLEGECKISRV. 1986. Physical observation in the plume region of the Amazon River during peak dis-charge – I. Surface variability. Cont Shelf Res 6: 31–51. DASILVAA, YOUNGACANDLEVITUSS. 1994. Atlas of
surface marine data 1994, Vol. I: Algorithms and pro-cedures. NOAA Atlas NESDIS 6, U.S. Department of Commerce, Washington, D.C.
DEMASTERDJAND POPERH. 1996. Nutrient dynamics in Amazon shelf waters: results from AMASSEDS. Cont Shelf Res 16: 263–289.
DEMASTER DJ, SMITH WO, NELSON DM AND ALLER JY. 1996. Biogeochemical processes in Amazon shelf waters: chemical distributions and uptake rate of silicon, carbon and nitrogen. Cont Shelf Res 16: 617– 643. ESCHRIQUESA, SANTOSMLS, SARAIVAALL, DELFINO
GEYER WR, BEARDLEY RC, LENTZ SJ, CANDELA J, LIMEBURNER R, JOHNSEW, CASTROMBANDSOA -RES DI. 1996. Physical oceanography of the Amazon shelf. Cont Shelf Res 16: 575–616.
GRASSHOFF K, EHRHARDTM ANDKREMLINGK. 1983. Methods of seawater analysis, 2nded., Verlage Chemie. HUC, MONTGOMERY ET, SCHMITTRWANDMÜLLER
-KARGER FE. 2004. The Amazon and Orinoco river plumes in the tropical Atlantic and Caribbean sea: obser-vation from space and S-PALACE floats. Deep-Sea Res II 51: 1151–1171.
HUMBORGC. 1997. Primary productivity regime and nutri-ent removal in the Danube estuary. Estuar Coast Shelf Sci 45: 579–589.
JOHNS WE, LEE TN, SCHOTT FA, ZANTOPP RJ AND EVANS RH. 1990. The North Brazil Current retroflec-tion: seasonal structure and eddy variability. J Geophys Res 95: 22103–22120.
JOHNSWE, BEARDSLEYRC, CANDELAJ, LIMEBURNER RANDCASTROB. 1998. Annual cycle and variability of the North Brazil Current. J Phys Ocean 28: 103–128. JØRGENSENSEANDBENDORICCHIOG. 2001.
Fundamen-tals of ecological modelling. Developments in Environ-mental Modelling 21. Elsevier Sciences Publishers, 530 p. KINEKE CG, STERNBERG WR, TROWBRIDGE HE AND GEYERRW. 1996. Fluid-mud processes on the Amazon Continental Shelf. Cont Shelf Res 16: 667–696. LENTZSJ. 1995a. Seasonal variations in the horizontal
struc-ture of the Amazon plume inferred from historical hydro-graphic data. J Geophys Res 100: 2391–2400.
LENTZSJ. 1995b. The Amazon River plume during Amas-Seds: subtidal current variability and the importance of wind forcing. J Geophys Res 100: 2377–2390.
MENEZES LBC. 1999. Caracterização biogeoquímica de ecossistemas Amazônicos: rios e lagos selecionados nas microregiões Bragantina, do Salgado e Guajarina, PA. Tese de Doutorado, Universidade Federal do Pará. MILLIMAN JD, SUMMERHAYESCP ANDBARRETTOHT.
1974. Contribuição ao estudo de material em suspen-são na plataforma continental do Amazonas. Congresso Brasileiro de Geologia. 3: 263–282.
MÜLLER-KARGERFE, MCCLAINCRANDRICHARDSON P. 1988. The dispersal of Amazon’s water. Nature 333: 56–59.
NITTROUER CAANDDEMASTERDJ. 1996. The Amazon shelf setting: tropical, energetic and influenced by a large river. Cont Shelf Res 16: 553–573.
NITTROUER CA, DEMASTER DJ, FIGUEIREDO AGAND RINEJM. 1991. AMASSEDS: an interdisciplinary inves-tigation of a complex coastal environment. Oceanography 4: 3–7.
PARANHOSR. 1996. Alguns métodos para análise da água. UFRJ.
PHILANDERSGHANDPACANOWSKI. 1986. The mass and heat nudget in a model of the tropical Atlantic Ocean. J Geophys Res 92: 3691–3708.
PICAUT J, SERVAIN J, LECOMPTE P, SEVA S, LUKAS S ANDROUGIER G. 1985. Climatic atlas of the tropical Atlantic, wind stress and sea surface temperature, 1964-1979, Université de Bretagne Occidentale, 467 p. RYTHERJH, MENZELDWANDNATHANIELC. 1967.
In-fluence of the Amazon river outflow on the ecology of the western tropical Atlantic I. Hydrography and nutrient chemistry. J Mar Res 25: 69–83.
SCHOTTFA, FISCHERJ ANDSTRAMMAL. 1998. Trans-ports and pathsways of the upper-layer circulation in the western tropical Atlantic. J Phys Oceanogr 28: 1904– 1928.
SCHOTT FA, DENGLER M, BRANDT P, AFFLERK, FIS -CHERJ, BOURLESB, GOURIOUY, MOLINARIRLAND RHEIN M. 2003. The zonal currents and transports at 35◦W in the tropical Atlantic. Geophys Res Lett 30(7),
1349, doi:10.1029/2002GLO16849.
SILVAAC. 2006. An analysis of water properties in the west-ern tropical Atlantic using observed data and numerical model results. Tese de Doutorado, Universidade Federal de Pernambuco, 155 p.
SILVAAC, BOURLÈSBANDARAUJOM. 2007. Seasonal variability of the Amazon river plume during REVIZEE Program. Tropical Ocean 35(2): 92–109.
SILVAMAL, CALASANSCF, OVALLEARCANDREZENDE CE. 2001. Dissolved nitrogen and phosphorus dynamics in the lower portion of the Paraíba do Sul River, Campos dos Goytacazes, RJ, Brazil. Braz Arch Biol Technol 44: 365–371.
STRICKLAND JDH ANDPARSONSTR. 1972. A practical handbook of sea water analysis. Bull Fish Res Board Can 167: 1–311.
TEIXEIRA C. 1973. Introdução aos métodos para medir a produção primária do fitoplâncton marinho. Bol Inst Oceanogr 22: 59–92.
UNESCO. 1973. International oceanographic table. ZHANGJ. 1996. Nutrient elements in large Chinese estuaries.