Arq. Bras. Med. Vet. Zootec., v.69, n.2, p.457-464, 2017
Weight evaluation of Tabapuã cattle raised in northeastern Brazil using random-regression models
[Avaliação do peso de bovinos Tabapuã criados no Nordeste do Brasil utilizando-se modelos de regressão aleatória]
M.R. Oliveira1, D.M. Azevêdo2, C. Malhado3, L. Pires4, R. Martins Filho5, S. Sousa Júnior6
¹Universidade Federal do Piauí – UFPI Campus Teresina, Piauí
²Empresa Brasileira de Pesquisa Agropecuária Meio-Norte – Embrapa Meio-Norte Teresina, Piauí ³Universidade Estadual do Sudoeste da Bahia – UESB Campus Jequié, Bahia
4Universidade Federal do Sul da Bahia – UFSB Campus Teixeira de Freitas, Bahia 5Universidade Federal do Ceará Campus Cariri Juazeiro do Norte, Ceará
6Universidade Federal do Piauí – UFPI Campus Parnaíba, Piauí
ABSTRACT
The objective of this study is to compare random-regression models used to describe changes in evaluation parameters for growth in Tabapuã bovine raised in the Northeast of Brazilian. The M4532-5 random-regression model was found to be best for estimating the variation and heritability of growth characteristics in the animals evaluated. Estimates of direct additive genetic variance increased with age, while the maternal additive genetic variance demonstrated growth from birth to up to nearly 420 days of age. The genetic correlations between the first four characteristics were positive with moderate to large ranges. The greatest genetic correlation was observed between birth weight and at 240 days of age (0.82). The phenotypic correlation between birth weight and other characteristics was low. The M4532-5 random-regression model with 39 parameters was found to be best for describing the growth curve of the animals evaluated providing improved selection for heavier animals when performed after weaning. The interpretation of genetic parameters to predict the growth curve of cattle may allow the selection of animals to accelerate slaughter procedures.
Keywords:age, covariance functions, growth curve, legendre polynomials, livestock
RESUMO
Objetivou-se com esta pesquisa comparar diferentes modelos de regressão aleatória e determinar o mais adequado para descrever mudanças nos parâmetros de avaliação do crescimento de bovinos da raça Tabapuã criados no Nordeste brasileiro. O modelo de regressão aleatória M4532-5 foi definido como sendo o de melhor ajuste para descrição das estimativas de variância e herdabilidades das características de crescimento dos animais avaliados. As estimativas de variância genética aditiva direta aumentaram em função da idade, já as de variância genética aditiva materna mostraram crescimento do nascimento até próximo aos 420 dias. As correlações genéticas entre as quatro primeiras características foram positivas e de magnitudes moderada a alta. A maior correlação genética foi observada entre o peso ao nascer e aos 240 dias (0,82). A correlação fenotípica entre peso ao nascimento e demais características foi baixa. O modelo de regressão aleatória M4532-5 com 39 parâmetros apresentou-se como aquele de melhor ajuste para descrever a curva de crescimento dos animais avaliados. Resposta à seleção para obtenção de animais mais pesados será eficiente quando realizada em idades posteriores ao desmame. Ao se avaliar a curva de crescimento de bovinos por meio da interpretação dos parâmetros genéticos estimados, é possível selecionar animais com maior precocidade de abate.
Palavras-chave: curva de crescimento, funções de covariância, idade, pecuária, polinômios de Legendre
INTRODUCTION
Brazil is a major producer of the world's food, with favorable climatic conditions and soil for livestock production, especially for cattle. In 2012, the country possessed approximately 211 million animals, of which, around 140 million were suitable for meat production (Sistema…, 2012). However, the beef production systems in Brazil require improvements in their efficiency to increase productivity and competitiveness (Campos et al., 2013). Accordingly, the use of
animal breeding tools is of importance, especially for the selection of genetically-superior animals with characteristics of economic importance. Parameters, for example, that characterize the growth curve of animals, based on their weights at different ages are extremely useful. Such longitudinal data are commonly analyzed with infinite-dimensional models, such as random regression (MRA), as they monitor the average-growth curve of the animals in a given period of time (Malhado et al., 2008).
The random-regression models, used for the evaluation of longitudinal data, such as growth characteristics, are even more accurate than uni models. These employ multi characteristics to provide animal weight information and do not require standardization or pre adjustments (Albuquerque; El Faro, 2008; Baldi et al., 2010;
Sousa Júnior et al., 2010). To adjust
random-regression models, a covariance matrix of infinite size is required and an effective alternative is the use of covariance functions. These continuous functions are used for the estimation of variance and covariance of a characteristic measured at different points of a trajectory (Sousa Júnior et al., 2014).
Accordingly, this study aimed to compare different random-regression models in order to determine the most appropriate for predicting changes in the growth parameters of Tabapuã cattle raised in the Northeast of Brazil.
MATERIAL AND METHODS The weight records of 3,172 Tabapuã cattle, aged from 0 to 660 days, and born between the years 1984 and 2004 were analyzed. These data were obtained from herds of three states in the Northeast of Brazil (Alagoas, Sergipe and Maranhão) and provided by the Brazilian Association of Zebu Breeders (BAZB). After analysis of data consistency and restrictions, carried out with the help of SAS® software (Statistical Analysis System 9.0) (Statistical…, 2003), the final set of data contained 1.505 records (Table 1). Animals with less than three recordings of weight and / or contemporary groups with less than three animals were eliminated. The following criteria were used for the formation of contemporary groups; sex, month and year of birth and weight, farm of birth and rearing conditions (pasture breeding system). Data was classified into 118 age groups for evaluation.
Table 1. Composition of the data file
Data analyzed Number
Total records 1 505
Animals in the
relationship matrix 589
Animals with records 335
Animals with 03 records 102
Animals with 04 records 84
Animals with 05 records 46
Animals with 06 records 88
Animals with 07 records 15
Bulls 77
Cows 512
Contemporary groups 255
For the different random-regression models tested, fixed effects of the contemporary group and the covariates of the age of the cow at calving (quadratic effect) were taken into consideration. Genetic effects, direct and maternal additive values were defined as random effects in addition to the direct and maternal permanent environmental effects. The general model may be represented as below:
ijk m k m ij m jm ij m jm ij m k m jm ij m k m jm k m i m m ij C Q M A b t t t t t b F
y
1 0 1 0 1 0 1 0 1 0 ;
Where: yij = ith measure relating to the jth animal;
F = set of fixed effects; bm = fixed regression
coefficient for modeling the average curve of the population; m (ti) = regression function that
describes the average curve of the population, according to the age of the animal; m (tij) =
maternal additive direct and maternal permanent environment additive genetic random effects; jm, jm, jm, jm = direct and maternal additive,
direct and maternal permanent environmental genetic regression coefficients, respectively, for
each animal; kb, kA, kM, kC e kQ = order of
polynomials to be adjusted; ij = random error
associated with each i´s age from j´s animal.
In matrix form, the model is as follows:
Y= X + Z1 + Z2 +W1 + W2 +
V
=
R
A
A
m a N Q N C M A0
0
0
0
0
0
0
0
0
0
0
0
0
0
0
0
0
0
0
0
;Where: Y = vector of observations; = vector of fixed effects; = random vector of direct additive genetic coefficients;
= random vector of genetic maternal additive coefficients; = direct permanent environmental coefficient vector; = maternal permanent environmental coefficient vector; X, Z1, Z2, W1, W2 =corresponding incidence matrices; KA, KM, KC e
KQ = matrices of variance and covariance
between random regression coefficients for genetic additive direct and maternal effects and direct and maternal permanent environment, respectively; A = relationship matrix; I = identity matrix; Na and Nm = number of animals with data
and number of mothers, respectively; R = residual variance matrix; = residual vector.
The covariance components were estimated through restricted maximum verisimilitude method, using the WOMBAT statistical program
(Meyer, 2006). Orthogonal Legendre
polynomials were used from Monday to Friday, modeling order in the random effects mentioned above. Five classes of variance were used for the residual modeling.
Five models of random regression with five residual variance classes were tested (M4522-5, M4532-5, M4533-5, M4633-5 and M5633-5). These models were compared using the verisimilitude function (L log), plus the Akaike information criterion (AIC) and Bayesian Schwarz (BIC) and the BIC criterion, considered the most rigorous by penalizing more parameterized models (El Faro; Albuquerque, 2003). The use of these types of comparison
methods penalizes more parameterized models by determining the most parsimonious model, i.e. sets the most appropriate model, in this case to explain the cattle growth phenomenon (Sousa Júnior et al., 2010). The representation of the
criteria cited is below:
AIC= -2 logL + 2p
e BIC= -2 logL + p log (N-r(X)),
Where p = the number of model parameters; N = the total number of observations; and the r = the stand of the matrix X (which represents the incidence matrix of fixed effects). It is noteworthy that smaller values of AIC and BIC criteria describe a better fit model.
RESULTS AND DISCUSSION Considering the criteria of Akaike (AIC) and Bayesian Schwarz (BIC), the M4532-5 random-regression model that takes into account direct and maternal genetic and direct and maternal permanent environmental effects, respectively, with five classes of residual variance and 39 parameters, was considered the best fit model for description of estimates of variance and heritability of the growth characteristics of the animals evaluated (Table 2). According to Pelicioni et al. (2009), less parameterized models
Table 2. Random regression models evaluated with five residual variance classes
Model Statistical criteria*
Rvc Np log L AIC BIC
M4522 05 36 -4070. 020 8216. 940 8214. 60
M4532 05 39 -4069. 267 8216. 534 8214. 20
M4533 05 42 -4069. 267 8222. 534 8226. 32
M4633 05 48 -4060. 468 8216. 936 8214. 61
M5633 05 53 -4060. 397 8226. 794 8227. 07
*Rvc = residual variance class; Np = number of model parameters; log L = log-likelihood function; AIC = Akaike information criterion; BIC = Bayesian information criterion of Schwarz.
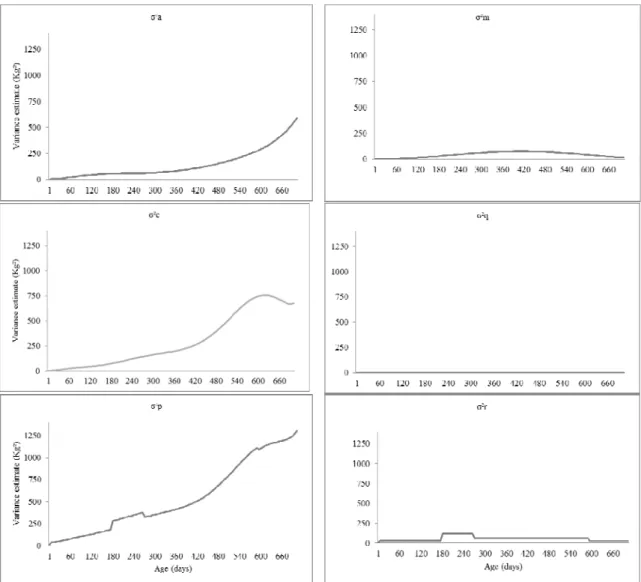
Estimates of direct additive genetic variance increased with age (Figure 1), corroborating the study of Martínez Niño et al. (2012) and
showing that there is satisfactory genetic variability in weight gain when selection is made at later ages after the weaning stage. On the other hand, the maternal additive genetic effect presented an increase from birth to 420 days of age, thereafter decreasing until 660 days. This finding differs from those commonly reported in studies with Zebu cattle, where maternal variance values are described as being more significant from the time of birth until weaning phase, which occurs at 205 days of age on average. Different profiles have been observed in studies conducted by Ribeiro et al. (2007) and
Albuquerque and El Faro (2008) when evaluating the growth characteristics of Tabapuã and Nelore cattle.
The estimates of variance for environmental effects (direct and maternal) presented different behaviors (Figure 1); while the variation in the primary environmental effect increased from birth until approximately 600 days of age, with a slight drop from this point until the end of the study period (660 days), the maternal permanent environment variance presented a linear behavior, i.e. did not present any change in the range evaluated without biological justification for such an event. Sousa Júnior et al. (2010)
found contrasting results, demonstrating that the estimated variance increased from birth to 660 days of age. The estimate of phenotypic variance increased early on up to 240 days and, after this period, showed a slight drop. A more significant increase was then observed up to older ages (Figure 1). Similar results were observed by Amaral et al. (2014) who evaluated the growth
of Nellore cattle in the Northeast of Brazil.
Finally, the estimated residual variance showed stable behavior from birth until 180 days, followed by a slight increase, and a drop after 240 days until later ages. A different result was observed by Boligon et al. (2009) (Weight =
0.505kg at weaning; weight = 0.980kg per year; yearling weight = 1.150kg) and Costa et al.
(2011) in which the residual variance estimates increased during the post-weaning period and thereafter.
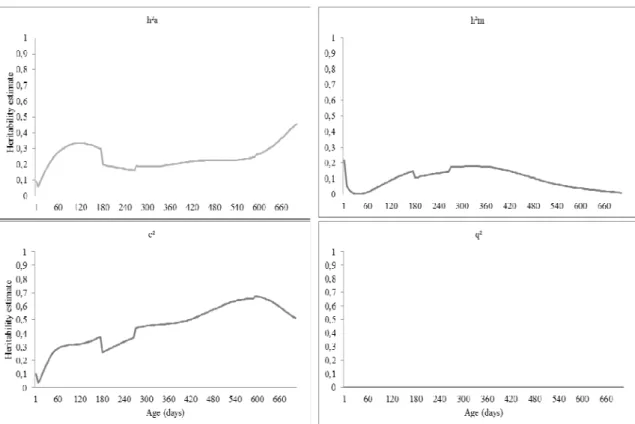
Estimates of direct heritability, in general, showed an increase at birth and during the following ages; however, there was a drop after 120 days that remained stable until 600 days of age, after which it increased again until the end of the study period (Figure 2). Laureano et al.
(2011) suggested that studies finding high levels of direct heritability yearling weight did not include the maternal genetic effect in the model, possibly causing an overestimation in additive genetic variance. Similar results were observed by Dias et al. (2006) (Weight = 0.21 at weaning
and yearling weight = 0.24) and Albuquerque and El Faro (2008) (Weight per year = 0.20 and Weight yearling = 0.38) with Zebu cattle, where the largest direct heritability values were obtained for measurements of yearling weight. This result can be explained by the fact that, at older ages, the maternal influence has less influence on the development of the animal and post-weaning growth, which becomes more influenced by environmental factors, such as nutritional management. However, Toral et al.
Figure 1. Estimates of direct additive genetic (σ²a) and maternal (σ²m), direct permanent environmental (σ²c) and maternal (σ²q), phenotypic (σ²p) and residual (σ²r) variance in weights from birth to 660 days of age in Tabapuã cattle, using a random-regression model with five residual variance classes (M4532-5).
In general, maternal heritability affected weight from birth up to approximately 300 days, with a smaller effect thereafter. Dias et al. (2006) found
different heritability values and reported that the highest maternal heritability values were found before weaning, at around 150 days of age in Tabapuã cattle. Authors suggested that there may be a good response to the selection feature of maternal ability, based on weights before weaning, as a result of the greater maternal influence at this age.
Estimates of direct and maternal permanent environmental variance, as a proportion of the
total phenotypic variance, showed different behaviors. In general, the direct permanent environmental variance showed growth from birth to 600 days of age that decreased slightly at the end of the study period. In contrast, Boligon
et al. (2010) and Palharim et al. (2013) found
Figure 2. Heritability (h²a) and maternal (h²m), direct permanent environmental variance (c²) and maternal (q²) estimates as a function of the total phenotypic variance for weights from birth until 660 days of age in Tabapuã cattle, using a random-regression model with five classes of residual variance (M4532-5).
Estimates of the genetic correlations between the first four characteristics, PNxP240 (0.82), PNxP365 (0.81) and PNxP540 (0.66), were positive and of moderate to high magnitude (Table 3). However, the greatest genetic
correlation was found between the
characteristics; birth weight (BW) and weight per year (P365), which was 0.82 and decreased with age. These data indicate that selection for weight gain, when performed in young animals, can increase the size and birth weight of calves and lead to complications in childbirth, increasing the rate of dystocia in the herd.
Similar results for this parameter were found by Sousa Júnior et al. (2010). However, Mota et al.
(2013) more recently related that the genetic correlation values increased during early ages for the yearling weight, resulting in a decrease in final weight. If we consider this final weight at 660 days as the same as that at adulthood, this finding is of interest as animals that are too heavy at this stage, raising production costs to maintain them in the herd. Another important
reason for avoiding high weight animals during older age, is that the preference of farmers is to produce younger animals according to growth and carcass.
High correlations between the characteristics that comprise the post-weaning period were observed; P240xP365 (0.97) P365xP540 (0.92) and P540xP660 (0.98) respectively. Sousa Júnior
et al. (2011) also found high levels of
post-weaning weight values; P365x450 (0.92), P365xP550 (0.89) and P450XP550 (0.93). According to Lira et al. (2008), this result
indicates that most of the genes responsible for higher weights at ages after weaning are the same.
correlations were found in studies by Albuquerque and El Faro (2008) and Sousa Júnior et al. (2010), when working with growth
characteristics of Zebu animals. Additionally, the characteristic low-birth weight presented a correlation with all other phenotypic characteristics evaluated PNxP240 (0.28); PNxP365 (0.23); PNxP540 (0.29) and PNxP660 (0.33). Ribeiro et al. (2009) showed different
phenotypic correlation results in which the correlation values between birth weight and later ages were high and close to the unit. The low phenotypic correlation of birth weight with weights during subsequent ages, found in this study, may be explained by the reduced influence of maternal effect on animals following weaning, when environmental effects begin to have more effect on calves.
Table 3. Estimates of genetic correlations (above the diagonal values) and phenotypic correlations (values below the diagonal) for weights at different ages in Tabapuã cattle
1characteristic BW W240 W365 W540 W660
BW - 0.82 0.81 0.66 0.56
W240 0.28 - 0.97 0.89 0.88
W365 0.23 0.80 - 0.92 0.96
W540 0.29 0.71 0.84 - 0.98
W660 0.33 0.69 0.78 0.89 -
1Birth weight (BW); weight at 240 (P240), 365 (P365), 540 (P540) and 660 (P660) days of age.
CONCLUSIONS
The M4532-5 random-regression model with 39 parameters was the best model for the description of the growth curves for Tabapuã bovine raised in three states of northeastern Brazil (Alagoas, Sergipe and Maranhão); the selection for potentially heavier animals will be more effective when performed after weaning, however selection due to maternal characteristics may be of some success if employed before weaning; when evaluating the growth curve of cattle by interpretation of genetic, animals with a higher growth rate may be identified and selected, allowing the definition of those eligible for early slaughter.
REFERENCES
ALBUQUERQUE, L.G.; EL FARO, L. Comparações entre os valores genéticos para características de crescimento de bovinos da raça Nelore preditos com modelos de dimensão finita ou infinita. Rev. Bras. Zoot., v.37, p.238-246,
2008.
AMARAL, R.S. et al. Tendências, parâmetros
fenotípicos e genéticos de características de crescimento em bovinos Nelore mocho do nordeste brasileiro. Rev. Bras. Saúde Prod. Anim., v.15, p.261-271, 2014.
BALDI, F.; ALENCAR, M.M.; ALBUQUERQUE, L.G. Random regression analyses using B-splines functions to model growth from birth to adult age in Canchim cattle. J. Anim. Breed. Genet., v.127,
p.433-441, 2010.
BOLIGON, A.A. et al. Covariance functions for
body weight from birth to maturity in Nellore cows. J. Anim. Sci., v.88, p.849-859, 2010.
BOLIGON, A.A. et al. Herdabilidades e
correlações entre pesos do nascimento à idade adulta em rebanhos da raça Nelore. Rev. Bras. Zootec., v.38, p.2320-2326, 2009.
CAMPOS, A.M. et al. Índices zootécnicos da
fase de cria de uma propriedade de gado de corte tecnificada. Rev. Tropic: Ciênc. Agrár. Biol., v.7,
p.82-88, 2013.
COSTA, R.B. et al. Estimation of genetic
parameters for mature weight in Angus cattle. J. Anim. Sci., v.89, p.2680-2686, 2011.
DIAS, L.T. et al. Estimação de parâmetros
genéticos para peso do nascimento aos 550 dias de idade para animais da raça Tabapuã utilizando-se modelos de regressão aleatória.
Rev. Bras. Zootec., v.35, p.1915-1925, 2006.
LAUREANO, M.M.M. et al. Estimativas de
herdabilidade e tendências genéticas para características de crescimento e reprodutivas em bovinos da raça Nelore. Arq. Bras. Med. Vet. Zootec., v.63, p.143-152, 2011.
LIRA, T.; ROSA, E.M.; GARNERO, A.D.V. Parâmetros genéticos de características produtivas e reprodutivas em zebuínos de corte (revisão). Ciênc. Anim. Bras., v.9, p.1-22, 2008.
MALHADO, C.H.M. et al. Correlações
genéticas entre características de crescimento e parâmetros da curva em bovinos da raça Nelore.
Rev. Cienc. Prod. Anim., v.10, p.102-111, 2008.
MARTÍNEZ NIÑO, C.A. et al. Genetic
parameters and breeding values for live weight using random regression models in a Bos taurus-Bos indicus multibreed cattle population in
Colombia. Rev. Colom. Cienc. Pecu., v.25,
p.548-546, 2012.
MEYER, K. “WOMBAT” – Digging deep for quantitative genetic analyses by restricted maximum likelihood. In: WORLD CONGRESS ON GENETICS APPLIED TO LIVESTOCK PRODUCTION, 8., 2006, Belo Horizonte.
Proccedings... Belo Horizonte: CGALP, 2006.
CD-ROM
MOTA, R.R. et al. Genetic evaluation using
multi-trait and random regression models in Simmental beef cattle. Genet. Mol. Res., v.12,
p.2465-2480, 2013.
PALHARIM, D.A. et al. Estimativas de
herdabilidade para o desempenho ponderal na raça Nelore no Mato Grosso. Sci. Electron. Arch., v.3, p.59-62, 2013.
PELICIONI, L.C.; ALBUQUERQUE, L.G.; QUEIROZ, S.A. Estimação de componentes de co-variância para pesos corporais do nascimento aos 365 dias de idade de bovinos Guzerá empregando-se modelos de regressão aleatória.
Rev. Bras. Zootec., v.38, p.50-60, 2009.
RIBEIRO, S.H.A. et al. Efeito da covariância
genética aditivo-materna sobre estimativas de parâmetros genéticos e em avaliações genéticas de características de crescimento de animais Tabapuã. Arq. Bras. Med. Vet. Zootec., v.61,
p.401-406, 2009.
RIBEIRO, S.H.A. et al. Estudo
genético-quantitativo de características de crescimento na raça Tabapuã. Arq. Bras. Med. Vet. Zootec., v.59,
p.473-480, 2007.
SISTEMA IBGE de Recuperação Automática: banco de dados agregados. [Rio de Janeiro],
IBGE, 2012. Disponível em:
<http://www.sidra.ibge.gov.br/bda/pecua/default. asp?t=2&z=t&o=24&u1=3&u2=1&u3=1&u4=1 &u5=1&u6=1&u7=1>. Acessado em: 11 de mar. de 2014.
SOUSA JÚNIOR, S.C. et al. Aplicação de
modelos de regressão aleatória utilizando diferentes estruturas de dados. Rev. Ciênc. Rural,
v.44, p.2058-2063, 2014.
SOUSA JÚNIOR, S.C. et al. Estimação
bayesiana de componentes de (co) variância de características ponderais na raça tabapuã. Rev. Bras. Saúde Prod. An., v.12, n.2, p.350-358,
2011.
SOUSA JÚNIOR, S.C. et al. Estimação de
funções de covariância para características de crescimento da raça Tabapuã utilizando modelos de regressão aleatória. Rev. Bras. Zootec., v.39,
p.1037-1045, 2010.
STATISTICAL analysis system. User's guide for windows environment. Versão 9.0 Cary: SAS Institute, 2003.
TORAL, F.L.B.; ALENCAR, M.M.; FREITAS, A.R. Estruturas de variância para funções de covariância para o peso de bovinos da raça Canchim. Rev. Bras. Zootec., v.38, p.2152-2160,