Palavras chave:
Análise espacial Covariável REML/BLUP Componentes de variância
Historic:
Received 23/05/2017 Accepted 11/09/2017
Keywords:
Spatial analysis Covariate REML/BLUP Components of variance
1 Federal University of Paraná - Curitiba, Paraná, Brazil
2 Federal University of Mato Grosso - Cuiabá, Mato Grosso, Brazil
+Correspondence:
DOI:
10.1590/01047760201723032365
Vanessa Ishibashi1+, Diego Tyszka Martinez2, Antonio Rioyei Higa1
PHENOTYPIC MODELS OF COMPETITION FOR Pinus taeda L GENETIC PARAMETERS ESTIMATION
ABSTRACT: The objective of this study was to evaluate the efficiency of the phenotypic
models of competition, through spatial analysis in the genetic evaluation of Pinus taeda L progenies. For this, four competition covariates were used to adjust the phenotypic values in a P. taeda progeny test installed in four different locations in the state of Santa Catarina. The test was implemented in randomized block design, with seven repetitions, linear plots containing six plants per plot in 2.5 m x 2.0 m spacing. The test installed in sites A, B, and D present 63 families and site C 53 families. At nine years old, the diameter at the breast height was measured for all individuals. The presence or absence of competition
was based on the residual autocorrelation coefficients, which had its significance tested
by the Durbin-Watson test. In general, the use of covariates corrected the competition
effect. The variances among and within plots, as well as the residual variation coefficient, were reduced. The classification by the genetic effect of the individuals in the progeny test
was extremely altered for this data set with and without the use of covariates for sites A and D, as well as the genotype x environment interaction. The use of these two tools is of great importance in the analysis of data in P. taeda progeny tests, since the effects of
competition can lead to mistakes in the selection of individuals and in the definition of
improvement zones.
MODELOS FENOTÍPICOS DE CONCORRÊNCIA PARA Pinus taeda L ESTIMAÇÃO DE PARÂMETROS GENÉTICOS
RESUMO: O objetivo foi avaliar a eficiência dos modelos fenotípicos de competição, via análise espacial, na avaliação genética de testes de progênies de Pinus taeda L. Para
isso foram utilizadas quatro covariáveis de competição para ajuste dos valores fenotípicos em um teste de progênies de P. taeda plantado em quatro diferentes locais no estado de Santa Catarina. O teste foi implantado em delineamento de blocos casualizados, com
PARAMETERS ESTIMATION
INTRODUCTION
Biological variation is the basis for the breeder’s work genetic improvement programs of forest species, the most widely used way to distinguish between environmental and genetic variability is progeny testing. This allows to estimate genetic and phenotypic parameters and to predict the genetic value of a
specific set of individuals. These tests are commonly
established in small linear plots, ranging from four to nine plants (STOEHR et al., 2010). This way, there is
an increase in statistical efficiency, since they reduce the
variance within the block, but increase the interaction between neighboring individuals due to the competition (LEONARDECZ-NETO et al., 2003).
Competition is caused by genetic and environmental factors and is due to genotypes and the spatial arrangement
of neighboring trees (CAPPA et al., 2016). In forest field
trials, it is mainly caused by the lack of space induced by
high intraspecific density (LEONARDECZ-NETO et al.,
2003). In which the growth of the individuals of the plot is correlated to its neighbors, due to the common micro environment (PAVAN et al., 2012). In linear plots, this competition can occur within the plots (inter-genotypic competition) or between the experimental plots (intra-genotypic competition).
However, in the models used for analysis of progeny tests, it is not common to consider the effects of competition, as there are no established routines; and
the definition of specific methods to correct this type
of interference (PAVAN et al., 2012), this implies in the reduction of the ability to identify the genetic variation and the precision of the genetic value prediction (YE and JAYAWICKRAMA, 2008).
This interference may occur in the favoring of certain plants due to the lack of competition as there may be faults in the experiment or by more aggressive genotypes that tend to have their performances overestimated once they compete with more sensitive genotypes (RESENDE
et al., 2005). Progeny selection is also influenced, as the
genetic effects may be underestimated or overestimated (RESENDE et al., 2016).
Overall, two competition models can be used: the phenotypic model, when competition or interference does not have genetic control, thus, treating the neighbors phenotypic value as a covariate; and the genotypic model, when there is genetic control in the competition, relating the genetic effects of the neighbors to the residual value of the plant (RESENDE et al., 2005).
Genetic models of competition can be seen in Resende et al. (2016) testing intra-genotypic competition
in Eucalyptus clones, Costa et al. (2013). Using simulated modeling data and Cappa and Cantet (2008) in P. taeda
tests at 13 years of age using models that incorporate competition for both, genetic and non-genetic levels. Phenotypic models were studied by Leonardecz-Neto et al. (2003), who used Hegyi competition index for DBH data in several forest species and Pavan et al. (2012), using besides this index other six covariates in Eucalyptus progenies tests for volume. The DBH
and volume variables are more influenced by spacing
and more susceptible to competition effects than the height (YE and JAYAWICKRAMA, 2008; STOEHR et al., 2010). Since DBH is a readily available variable through direct measurement and because volume estimates are dependent on this variable, it is preferable to adjust phenotypic competition models for DBH.
Thus, with the use of competition models, it is
expected to isolate in a more efficient way the variation
that occurs due to the environment, causing the analysis to express more consistently the experimental reality (LEONARDECZ-NETO et al., 2003). However, knowing
which covariant and how it fits to faithfully represent, the
biological effect, is often unknown (PAVAN et al., 2012). One way to diagnose the presence of competition effects
in field trials is from the residual correlation coefficient in
which competition effects between neighboring plants cause negative autocorrelation and spatial heterogeneity causes positive correlations (RESENDE et al., 2005; CAPPA et al., 2016). Thus, the objective of the present
work is to evaluate the efficiency of the phenotypic
models of competition using four distinct covariates, through spatial analysis, in the genetic evaluation of a P. taeda progeny test.
MATERIAL AND METHODS
Experimental area and genetic material
The experimental area is located in two cities: Rio Negrinho and Lages in a plateau region of Santa Catarina
state. The climate is classified as Cfb according to
Köppen, subtropical humid with mild summer, without dry season (ALVARES et al., 2013). The regions present frost incidence in the colder months. Table 1 shows the other characteristics and location of the experiment.
environments (Sites A, B, C and D) and the installation occurred in 2006 in randomized block design with seven repetitions, six plant linear plots, in 2.5 m x 2.0 m spacing and double border rows. The test installed in sites A, B, and D has 63 families and site C 53 families. The 53 families present at site C are common to all sites. At the age of nine, a direct measurement of the variable Diameter at Breast height (DBH, cm) of all individuals at all progeny test sites was performed.
Estimation of the spatial autocorrelation function
The autocorrelation coeffi cients between residues
following the direction of the rows or between columns (ρL), following the direction of the columns or between rows (ρc) and the value of the d statistic for the Durbin-Watson residue independence test were obtained using
SELEGEN-REML / BLUP® software statistical model
number 113 (RESENDE, 2007a). The value of the statistic
d is defi ned as described in equation 1, where L is the order of the plot positioning in the experiment and n refers to the residues as ordered in the space. The residues (ri)
were obtained via model 1 SELEGEN – REML/BLUP® software (equation 3) considering zero in the analysis. The relation between d and ρ is given by equation 2.
The calculated value of d was compared with
theoretical values with (n-1) degrees of freedom, where n is the number of data. The calculated value of dl (lower
d) and du (upper d) are given in tables associated to
certain signifi cance levels. For hypothesis Ha: ρ>0 the decision rule about d is given by: if d ≤ dL, it rejects H0 and autocorrelation is positive; If d ≤ du, it accepts H0 and the autocorrelation is null and if dl<d<du the test is inconclusive. For hypothesis Ha: ρ < 0 the decision rule is equivalent, but using (4-d) instead of d (RESENDE, 2007b).
selection of individuals and progenies from in open-pollinated parents, in the design used and performing the selection one site at a time, the statistical model 1 (equation 3) was used; and for the selection in the four sites (joint analysis) model 4 (equation 4) was used. In this model, y is the vector of data, r is the vector of the effects
of repetition (assumed as fi xed) added to the general
mean; a is the vector of the individual additive genetic effects (assumed as random); p is the vector of plot effects (assumed as random); i is vector of the effects of genotype x environment interaction (random) and ε is the vector of (random) errors or residues. Capital letters represent the incidence matrices for these effects (RESENDE, 2007a). For the estimates of the genetic parameters the zeros were not considered in the analysis.
TABLE 1 Location and characterization of the experimental area of the P. taeda progeny test.
SITE A SITE B SITE C SITE D
City Rio Negrinho/SC Rio Negrinho/SC Rio Negrinho/SC Lages/SC
Altitude (m) 852 830 886 895
Soil Hapless Cambisol Hapless Cambisol Humic Cambisol Humic Cambisol
Topography Slightly Wavy Strongly-wavy Wavy Slightly Wavy
Average precipitation (mm) 1876 1876 1876 1854
Minimum Temperature (° C) 13.2 13.2 13.2 11.6
Maximum temperature (° C) 22.1 22.1 22.1 21,2
Average temperature (° C) 18.3 18.3 18.3 16.1
[1]
[2]
Estimation of genetic parameters
Genetic analysis of progeny tests were performed
using SELEGEN - REML / BLUP® software. For the
[3]
[4]
Analysis of covariance
The analysis of covariance of the progeny tests were performed with SELEGEN - REML / BLUP® software using statistical model 131 (equation 5). In this, y is the data vector; r is the vector of the repetition effects (assumed as
fi xed values) added to the general mean; a is the vector of
the individual additive genetic effects (assumed as random), p is the vector of the plot effects (assumed as random), ε is
the vector of (random) errors or residues. The coeffi cient
β refers to the regression associated with the covariate Cov Capital letters represent the incidence matrices for these effects (RESENDE, 2007a). For the analysis of covariance, zeros were not considered.
[5]
The assumptions for analysis of covariance are: (I)
the covariate values are fi xed, measured without error
PARAMETERS ESTIMATION
and common variance (RESENDE, 2002; PALLANT, 2010; RAMALHO et al., 2012).
Three covariates were tested based on the performance of neighboring trees and one covariate based on the number of neighboring plants.
Hegyi Competition Index (IC)
Competition Mean (IC) through the distances and performance of the eight potential neighbors of the target plant i (LEONARDECZ-NETO et al., 2003). The expression for the calculation is given by equation 6, where ICi is the competition index of the target plant
i, Yi is the observed value of the target plant i; Yj is the observed value of competing plant j and Dij is the distance between plants i and j.
each surviving individual were adjusted according to equation 10 for the covariates IC, MAT and MAL and equation 11 (RESENDE, 2002) for covariate NV, where Yij is the phenotypic value measured for each individual and Yijcthe adjusted phenotypic value for each individual.
[6]
Self-competition mean (MAT)
Arithmetic mean of the silvicultural characteristic of the auto competitive trees (PAVAN et al., 2012), belonging to the same genetic material (equation 7), where Yj is the observed value of the self-competing plant j and n the number of auto competitive plants.
[7]
Alo competition Mean (MAL)
Arithmetic mean of the silvicultural characteristic of the alo competitive trees (PAVAN et al., 2012), belonging to different genetic material (equation 8), where Yj is the observed value of the alo competitive plant j and n the number of alo competitive plants.
[8]
Number of neighboring plants (NV)
Algebraic sum of the number of surviving neighboring plants (equation 9), where n is the surviving neighboring plant (RESENDE, 2002).
[9]
Adjustment of phenotypic values
This is based on the covariance value of each individual (xij), the mean value of the covariate ( ) and the residual regression coeffi cient (β) between the covariate and the DBH data. The phenotypic values for
[10]
RESULTS AND DISCUSSION
The major cause of the interference found in the four progeny tests was due to experiment failures, which caused absence of competition and the favoring of isolated
individuals. At test site A the favoring was intensifi ed by
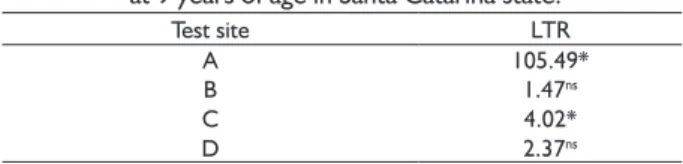
the presence of three families that had much inferior performance to the others throughout the test. Mortality had genetic control for the tests at site A and C (TABLE 2). However, the competition effect was random in all tests, showing no tendency for either family.
TABLE 2 Deviance analysis for survival of P. taeda progenies at 9 years of age in Santa Catarina state.
Test site LTR
A 105.49*
B 1.47ns
C 4.02*
D 2.37ns
Where: LTR: likelihood ratio test; * And ns: signifi cant and not signifi cant at 5% by the chi-square test with 1 degree of freedom, respectively.
Assumptions for analysis of covariates
The residual regression coeffi cients (β) for the covariates alo competition mean (MAL) and number of neighboring plants (NV) showed no interaction between covariate and DBH in any of the sites. The covariate
self-competition mean (MAT) showed signifi cant interaction
between covariate x treatment for sites A, B and D. The same occurred for Hegyi competition index (IC) for site
B. There was signifi cance of the β coeffi cients for all covariates, and these were negative for the covariates tested (TABLE 3).
As in Leonardecz-Neto et al. (2003) and Pavan et al. (2012), for the covariates calculated based on the performance of neighboring trees, the assumptions for
analysis of covariance are not satisfi ed in full, since they do not fully meet the fi rst condition of the analysis of
covariance. To minimize this implication, for covariates
where residual regression coeffi cients that were not signifi cant or showed no signifi cant interaction with the
choice of the site for the allocation of the experiments, the reduction of the variance of the experimental and blocks errors are as or more important than the error associated with the covariate.
Phenotypic models of competition for sites A and D
For DBH data without adjustment, the coeffi cient
of autocorrelation between residues following the direction of the columns (ρc) was negative, signifi cant and the statistic value d was higher than two for sites A and D. The same trend happened for the direction of the lines (ρL) (TABLE 4). Negative and signifi cant values of ρc and
ρL are indicative of the presence of competition in the progeny tests studied, since competition effects between neighboring plants cause negative autocorrelation and d
statistic values greater than two. Spatial heterogeneity causes positive correlations (RESENDE et al., 2005; CAPPA et al., 2016).
The sites showed the same trend in progeny behavior after the covariate analysis. The coeffi cients
ρc and ρL were negative and signifi cant for sites A and D when the data were adjusted via NV covariate. This covariant practically did not alter the components of variance and genetic parameters when compared with the original data (TABLE 4). The adjustment using the
covariate MAL presented negative and signifi cant ρc, increase in σ²e, reduction in σ²f and in c²parc. The value of this covariate considers only the competition among plots, thus not correcting intra-genotypic competition. The ρL indicated absence of inter-genotypic competition, indicating that this covariate corrected the data between plots for the tests of sites A and D, which can also be
verifi ed by the reduction in σ²parc (TABLE4).
The covariate IC resulted in ρc not signifi cant and ρL signifi cant and positive, indicating absence of competition between lines and environmental heterogeneity between columns, respectively. Ye and Jayawickrama (2008) obtained average autocorrelation
coeffi cients of 0.75, indicating strong environmental
variation, with environmental heterogeneity being the major source of interference in the progeny tests evaluated by the authors.
This environmental heterogeneity refl ects changes in the variance components after the adjustment when compared to the original data, where there was a small increase in environmental variance between plots (σ²parc) and a large reduction in individual phenotypic variance (σ²f), resulting in an increase in the coeffi cient of determination of plot effects (c²parc) at both sites. The absence of correlation between the lines corresponds to an expressive reduction in the residual variance within the plot (σ²e) (TABLE 4). The reduction of σ²parc and
σ²e leads to an environmental improvement providing more reliable data for the selection process (PAVAN et al., 2012). There was also a reduction in the additive genetic variance (σ2
a), that is, the adjusted data presented lower amplitude between the best and worst genetic material (TABLE 4). As in the work of Pavan et al. (2012), the IC was the covariate that mostly altered the components of variance at sites A, C and D, indicating great environmental infl uence on progeny tests due to competition between and within families.
Martinez et al. (2012) obtained an individual heritability average (h2
a) of close to 0.3 and c²parc considered as low magnitude. As mentioned in the work of Sturion and Resende (2005) it is considered as low c²parc values lower than 0.10 for heritability values close to 0.30. The test at site A, the adjusted IC data, presented a high value of h2
a (0.42) and c 2
parc of 0.15 and a coeffi cient of residual variation (CVe%) of 6%, and site
B showed moderate h2
a (0.24) and c²parc of 0.23 and a residual coeffi cient of variation (CVe%) of 5.5% (TABLE
4). Although c²parc is slightly above recommended, the improvement in CVe% and absence of competition effects justify the use of IC covariate in the selection for the two sites.
TABLE 3 Residual regression coeffi cient (β) between covariate and DBH data and mean value of covariate ( ) in P. taeda progeny test in four test sites in the state of Santa Catarina.
Covariate IC MAT MAL NV
Test site β β β β
A -4.15* 2.72 - - -0.31* 17.18 -0.11* 7.22
B - - - - -0.05* 16.99 -0.19* 7.58
C -3.91* 2.87 -0.11* 17.57 -0.29* 17.52 -0.46* 7.47
D -3.99* 2.86 - - -0.19* 17.84 -0.39* 7.58
PARAMETERS ESTIMATION
Phenotypic models of competition for sites B and C
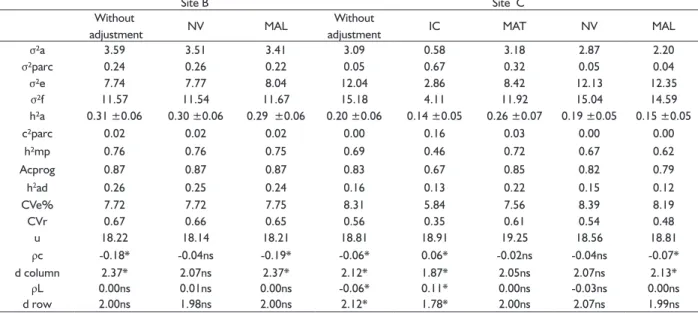
For the DBH data without adjustment, ρc was
negative, significant and statistic value d higher than two for sites B and C. The local B presented ρL null, that is,
absence of correlation and the negative and significant C
site (TABLE 5).
For the tests installed at these sites, the NV covariate corrected the data for the competition effects,
presenting non-significant ρc and ρL and the genetic parameters were similar to the data set parameters without adjustment. The covariate MAL exhibited ρL
not significant and ρc negative and significant, and that according to what occurred in sites A and D, increase in σ²e and reduction in σ²parc. The same occurred with the use of this covariate at site C (TABLE 5).
The MAT covariate also corrected the data for the competition effects for site C, provided increase in σ²parc, reduction in σ²e, σ²fand a slight increase in c²parc. For this location, two covariates corrected the data for competition effects with similar variance components, so the choice of the covariate to be used in the selection can be made based on the one that offers greater individual heritability (h²a), in the data set adjusted by MAT (TABLE 5).
The CVe% remained the same or reduced in
the tests in which the non-competition condition was
met, showing that the data adjustment provided good experimental accuracy. As in the works of Leonardecz-Neto et al. (2003), Ye and Jayawickrama (2008) and Pavan
et al. (2012), in general, coefficients of experimental
variation were reduced with the use of covariates. The values of individual heritability (h²a), mean heritability of progenies (h²mp), and additive heritability within plot (h2
ad), were not significantly changed by analysis without adjustment or with adjustment by covariates (TABLE 5). Similar results were seen by Resende et al. (2005) testing several models of competition in experiment with
Eucalyptus maculata. The author did not obtain reductions in the estimates of heritability between the traditional analysis and several models of competition tested, because in the dataset studied the competition was purely environmental.
Individual selection results
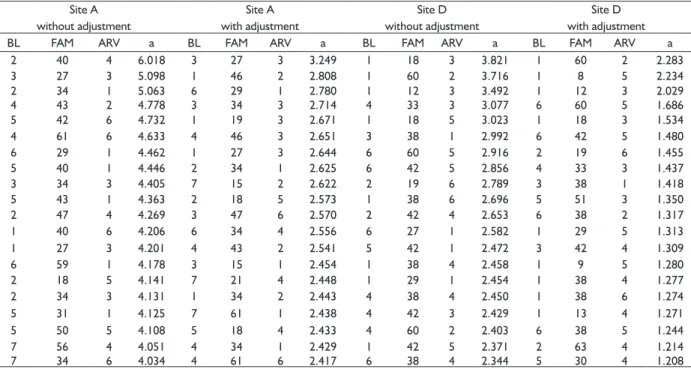
The genetic effects predicted for DBH using adjusted data suffered an intense reduction in site A and a slightly smaller reduction for site D, that is, gains on selection would be overestimated for these sites. For these sites, only eight individuals in the ranking of the twenty with the highest genetic values are present in both sets of data (TABLE 6). Some individuals which would be selected without data adjustment, mainly the closest to the gaps, were no longer selected after data adjustment. However,
TABLE 4 Variance components and genetic parameters, autocorrelation coefficients between residues in the directions of the lines (ρl), columns (ρc) and value of the statistic d for rows and columns; with and without the use of covariates for DBH in a progeny test of P. taeda planted in two different sites in the state of Santa Catarina.
Site A Site A
Without
adjustment IC NV MAL
Without
adjustment IC NV MAL
σ²a 7.34 2.28 7.30 4.10 3.00 0.79 3.01 2.71
σ²parc 0.76 0.78 0.78 0.10 0.46 0.74 0.43 0.38
σ²e 9.26 2.23 9.27 10.35 6.71 1.67 6.67 6.79
σ²f 17.36 5.29 17.35 14.55 10.17 3.20 10.11 9.89
h²a 0.42± 0.07 0.43± 0.08 0.42± 0.08 0.28± 0.08 0.29 ±0.07 0.25 ±0.06 0.30 ±0.07 0.27 ±0.07
c²parc 0.04 0.15 0.04 0.01 0.05 0.23 0.04 0.04
h²mp 0.80 0.74 0.80 0.75 0.70 0.51 0.70 0.69
Acprog 0.89 0.86 0.89 0.87 0.83 0.72 0.84 0.83
h2ad 0.37 0.43 0.37 0.23 0.25 0.26 0.25 0.23
CVgi% 13.63 7.65 13.67 10.08 8.91 4.57 9.00 8.47
CVe% 9.04 6.06 9.10 7.61 7.19 5.45 7.19 7.01
CVr 0.75 0.63 0.75 0.66 0.60 0.42 0.63 0.60
u 19.87 19.73 19.77 20.09 19.43 19.40 19.27 19.43
ρc -0.15* 0.00ns -0.15* -0.14* -0.09* 0.02ns -0.07* -0.11*
d column 2.30* 2.00ns 2.30* 2.28* 2.18* 1.95ns 2.15* 2.21*
ρL -0.04* 0.09* -0.04* 0.02ns -0.06* 0.09* -0.05* -0.03ns
d row 2.07* 1.81* 2.07* 1.96ns 2.13* 1.82* 2.11* 2.06ns
some individuals which were selected previously the adjustment of data and that were not close to the gaps, remained in the selection (FIGURE 1).
For site B there was a small reduction in the genetic effect and in site C the adjustment for the effects of competition increased the value of the predicted
genetic effect. At site B only 5% of individuals are not
the same for the set and unadjusted data sets and at site
C 30% (TABLE 7). In this way, genetic materials have
different responses to bioclimatic conditions, and may have different aptitudes, with some presenting or not increased growth, due to the lack of competition caused by the failure of neighboring plants (PAVAN et al., 2012).
Correlation among sites
The variance components and genetic parameters for joint analysis, considering all four sites, were estimated for DBH data with and without adjustment (TABLE 8). The value of h²a for the unadjusted data set was higher than for the adjusted data (TABLE 8), since the estimation of the average individual heritability in the
restricted sense in the environment is influenced by the
genotype x environment interaction.
Genetic correlation between progeny performance in the four environments was high (0.80) for unadjusted DBH data, the same value found in P. taeda tests at four sites
(distributed in the cities Otacílio Costa / SC And Telêmaco
Borba / PR) in the research presented by Martinez et al. (2012). As in the above, the variance of the genotype x environment interaction was of low magnitude (0.21),
which resulted in a low coefficient of determination for the
effects of genotype x environment interaction (0.03). For the adjusted DBH data, the correlation between the four sites was low (0.52), indicating loss in gain from performing selection at one site for use in distinct locations, as the best individuals in the environment may not be in another one (RESENDE, 2007b) (TABLE 8).
TABLE 5 Parameters estimates of the omnidirectional and cross semivariograms Vol = volume, Exp = Exponential.
Site B Site C
Without
adjustment NV MAL
Without
adjustment IC MAT NV MAL
σ²a 3.59 3.51 3.41 3.09 0.58 3.18 2.87 2.20
σ²parc 0.24 0.26 0.22 0.05 0.67 0.32 0.05 0.04
σ²e 7.74 7.77 8.04 12.04 2.86 8.42 12.13 12.35
σ²f 11.57 11.54 11.67 15.18 4.11 11.92 15.04 14.59
h²a 0.31 ±0.06 0.30 ±0.06 0.29 ±0.06 0.20 ±0.06 0.14 ±0.05 0.26 ±0.07 0.19 ±0.05 0.15 ±0.05
c²parc 0.02 0.02 0.02 0.00 0.16 0.03 0.00 0.00
h²mp 0.76 0.76 0.75 0.69 0.46 0.72 0.67 0.62
Acprog 0.87 0.87 0.87 0.83 0.67 0.85 0.82 0.79
h2ad 0.26 0.25 0.24 0.16 0.13 0.22 0.15 0.12
CVe% 7.72 7.72 7.75 8.31 5.84 7.56 8.39 8.19
CVr 0.67 0.66 0.65 0.56 0.35 0.61 0.54 0.48
u 18.22 18.14 18.21 18.81 18.91 19.25 18.56 18.81
ρc -0.18* -0.04ns -0.19* -0.06* 0.06* -0.02ns -0.04ns -0.07*
d column 2.37* 2.07ns 2.37* 2.12* 1.87* 2.05ns 2.07ns 2.13*
ρL 0.00ns 0.01ns 0.00ns -0.06* 0.11* 0.00ns -0.03ns 0.00ns
d row 2.00ns 1.98ns 2.00ns 2.12* 1.78* 2.00ns 2.07ns 1.99ns
* And ns: significant and non-significant values at 5% probability, respectively, by the Durbin-Watson test. Where: IC: Hegyi competition index; MAL: mean of the alo competition; NV: number of neighboring plants; σ²a: additive genetic variance; σ²parc: environmental variance between plots; σ²e: residual variance within the plot (environmental + non-additive genetics); σ²f: individual phenotypic variance; h²a: individual heritability in the restricted sense; c²parc: coefficient of determination of plot effects; h²mp: average progeny heritability; Acprog: accuracy of progeny selection; h2ad: additive heritability within plot; CVe%: coefficient of residual variation; CVr: relative coefficient of variation; u = Average of the experiment.
PARAMETERS ESTIMATION
TABLE 6 Classification of the twenty best individuals by genetic effects for DBH in a progeny test of P. taeda planted at two sites in the state of Santa Catarina.
Site A without adjustment
Site A with adjustment
Site D without adjustment
Site D with adjustment
BL FAM ARV a BL FAM ARV a BL FAM ARV a BL FAM ARV a
2 40 4 6.018 3 27 3 3.249 1 18 3 3.821 1 60 2 2.283
3 27 3 5.098 1 46 2 2.808 1 60 2 3.716 1 8 5 2.234
2 34 1 5.063 6 29 1 2.780 1 12 3 3.492 1 12 3 2.029
4 43 2 4.778 3 34 3 2.714 4 33 3 3.077 6 60 5 1.686
5 42 6 4.732 1 19 3 2.671 1 18 5 3.023 1 18 3 1.534
4 61 6 4.633 4 46 3 2.651 3 38 1 2.992 6 42 5 1.480
6 29 1 4.462 1 27 3 2.644 6 60 5 2.916 2 19 6 1.455
5 40 1 4.446 2 34 1 2.625 6 42 5 2.856 4 33 3 1.437
3 34 3 4.405 7 15 2 2.622 2 19 6 2.789 3 38 1 1.418
5 43 1 4.363 2 18 5 2.573 1 38 6 2.696 5 51 3 1.350
2 47 4 4.269 3 47 6 2.570 2 42 4 2.653 6 38 2 1.317
1 40 6 4.206 6 34 4 2.556 6 27 1 2.582 1 29 5 1.313
1 27 3 4.201 4 43 2 2.541 5 42 1 2.472 3 42 4 1.309
6 59 1 4.178 3 15 1 2.454 1 38 4 2.458 1 9 5 1.280
2 18 5 4.141 7 21 4 2.448 1 29 1 2.454 1 38 4 1.277
2 34 3 4.131 1 34 2 2.443 4 38 4 2.450 1 38 6 1.274
5 31 1 4.125 7 61 1 2.438 4 42 3 2.429 1 13 4 1.271
5 50 5 4.108 5 18 4 2.433 4 60 2 2.403 6 38 5 1.244
7 56 4 4.051 4 34 1 2.429 1 42 5 2.371 2 63 4 1.214
7 34 6 4.034 4 61 6 2.417 6 38 4 2.344 5 30 4 1.208
Where: BL: block; FAM: family; ARV: tree; A: predicted genetic effect.
TABLE 7 Classification of the twenty best individuals by genetic effects for DBH in a progeny test of P. taeda planted in two sites in the state of Santa Catarina.
Site B without adjustment
Site B with adjustment
Site C without adjustment
Site C with adjustment
BL FAM ARV a BL FAM ARV a BL FAM ARV a BL FAM ARV a
7 38 4 3.926 7 38 4 3.874 4 42 3 3.190 1 52 6 3.508
5 17 6 3.565 6 38 3 3.540 7 42 1 2.992 4 42 3 3.339
6 38 3 3.550 5 17 6 3.480 1 42 3 2.990 1 42 3 3.191
4 59 5 3.442 4 59 5 3.278 3 42 4 2.890 7 27 6 3.152
6 60 6 3.427 6 60 6 3.270 2 42 6 2.857 3 42 4 3.091
6 38 2 3.305 6 38 2 3.261 6 42 4 2.832 7 42 1 3.061
6 39 3 3.297 6 39 3 3.236 2 42 2 2.805 2 42 2 3.021
5 38 3 3.250 6 38 5 3.211 1 52 6 2.758 7 35 1 3.007
6 38 5 3.222 5 38 3 3.190 7 35 1 2.746 6 42 4 2.983
5 43 1 3.159 2 38 6 3.150 7 35 6 2.694 7 35 6 2.963
2 38 6 3.140 5 43 1 3.100 6 42 6 2.677 4 45 5 2.893
3 38 4 2.972 3 38 4 2.991 7 42 3 2.631 1 48 1 2.863
4 38 2 2.965 4 38 2 2.975 4 45 5 2.616 6 42 6 2.762
1 42 1 2.938 6 26 6 2.919 7 27 6 2.577 2 27 3 2.756
6 26 6 2.906 7 42 6 2.890 1 48 1 2.506 7 42 3 2.663
7 42 6 2.899 1 42 1 2.878 6 42 2 2.420 2 52 6 2.592
5 42 4 2.898 2 38 3 2.820 5 42 5 2.405 2 42 6 2.580
5 33 2 2.827 5 33 2 2.809 7 42 6 2.374 6 27 5 2.569
7 29 4 2.813 7 29 4 2.800 1 42 1 2.271 7 27 3 2.555
2 38 3 2.812 1 38 4 2.760 3 42 3 2.221 5 27 6 2.540
Where: BL: block; FAM: family; ARV: tree; A: predicted genetic effect
It is emphasized that if the data were not corrected for the competition effect, only one breeding zone for the tested sites would erroneously be established. When correcting the data for competition
effects, for better efficiency of indirect gains, two
breeding areas should be established, ne for test sites B and C and another for sites A and D (TABLE 9).
CONCLUSION
The phenotype models of competition using
covariates are efficient for correcting the data for competition effects. The covariate IC was more efficient
is, there is not a single model that fits all locations, making
it necessary to examine individually which covariate best
fits the data set based on autocorrelation coefficients and
variance components.
The residual autocorrelation coefficient and Durbin-Watson test can be used to identify
the presence or absence of competition in P. taeda
progeny tests and the effectiveness of the covariate used in the model.
The use of these two tools is of great importance in the analysis of data in P.taeda progeny tests, since
there is a great discrepancy in the individual classification
of the progenies, in the genotypic effects and in the
definition of breeding areas between the unadjusted data
and the adjusted for the effects of competition.
ACKNOWLEDGMENT
We thank CAPES / CNPQ for the financial
support, Mobasa Reforestation S / A and the Laboratory of Genetics and Forest Improvement of UFPR.
REFERENCES
ALVARES, C. A.; STAPE, J. L.; SENTELHAS, P. C.; de MORAES, G.; LEONARDO, J.; SPAROVEK, G. Köppen’s
climate classification map for Brazil. Meteorologische
Zeitschrift , v. 22, n. 6, p. 711-728, 2013.
CAPPA, E. P.; CANTET, R. J. Direct and competition additive effects in tree breeding: Bayesian estimation from an individual tree mixed model. Silvae Genetica, v. 57, n. 2, p. 45-55, 2008.
CAPPA, E. P., STOEHR, M. U., XIE, C. Y., & YANCHUK, A.
D. Identification and joint modeling of competition effects and environmental heterogeneity in three Douglas-fir
(Pseudotsuga menziesii var. menziesii) trials. Tree Genetics & Genomes, v. 12, n. 6, p. 102, 2016.
COSTA, J. S.; KERR, R. Accounting for competition in genetic analysis, with particular emphasis on forest genetic trials. Tree Genetics & Genomes, v. 9, n. , p. 1-17, 2013.
LEONARDECZ-NETO, E.; VENCOVSKY, R.; SEBBENN, A.
M. Ajuste para a competição entre plantas em teste de
progênies e procedências de essências florestais. Scientia
Forestalis, n. 63, p. 136-149, 2003.
MARTINEZ, D.T.; RESENDE, M. D. V.; COSTA, R. B. da; HIGA, A. R.; SANTOS, G. A. dos; FIER, I. S. N. Estudo da
interação genótipo x ambiente em progênies de Pinus taeda
por meio da análise de parâmetros genéticos. Floresta, v.
42, n. 3, p. 539 - 552, 2012.
PALLANT, J. SPSS survival manual: A step by step guide to data analysis using SPSS. Maidenhead, 2010. 354 p.
PAVAN, B. E.; DE PAULA, R. C.; PERECIN, D.; CANDIDO, L. S.; SCARPINATI, E. A. Efeito competicional em testes de
progênies de eucalipto. Ciência Florestal, v. 22, n. 3, p.
433-443, 2012.
RAMALHO, M. A. P.; FERREIRA, D. F.; OLIVEIRA, A. C. Experimentação em genética e melhoramento de plantas. 3ª Ed. Lavras: Editora UFLA, 2012. 305 p.
RESENDE, M. D. V. Genética biométrica e estatística no melhoramento de plantas perenes. Brasília: Embrapa.
Informação Tecnológica, 2002. 975p.
RESENDE, M. D. V. Selegen-Reml/Blup: Sistema Estatístico e Seleção Genética Computadorizada via Modelos Lineares Mistos. Colombo: Embrapa Florestas, 2007a. 361 p.
RESENDE, M.D. V. Matemática e estatística na análise de experimentos e no melhoramento genético. Colombo: Embrapa Florestas, 2007b. 362p.
RESENDE, M.D. V.; STRINGER, J.; CULLIS, B.; THOMPSON, R. joint modelling of competition and spatial variability in
forest field trials. Revista Matemática e Estatística, v.23,
n.2, p.7-22, 2005. TABLE 8 Variance components and genetic parameters
estimated by joint analysis for DBH in a progeny test of P. taeda planted in four sites in the state of Santa Catarina.
Parameter/Var.
component. Ajusted joint analysis
Joint analysis without adjustment
σ²a 4.26 0.93
σ²parc 0.32 0.44
σ²e 8.27 6.34
σ²f 13.11 7.92
h²a 0.32 0.12
c²parc 0.02 0.06
h²mp 0.87 0.66
Acprog 0.93 0.82
h2ad 0.28 0.10
u 19.07 19.16
Where: σ2a: additive genetic variance; σ²parc: environmental variance between plots; σ²e: residual variance within the plot (environmental + non-additive genetics); σ²f: individual phenotypic variance; h²a: individual heritability in the restricted sense; c²parc: coefficient of determination of plot effects; h²mp: average progeny heritability; h2ad: additive heritability within plot; u = average of
the experiment; Acprog: accuracy of progeny selection.
TABLE 9 Genetic correlation between sites and heritabilities estimated by means of joint analysis for DBH in a progeny test of P. taeda in the state of Santa Catarina. Site Genetic correlation h²a
A e D 0.81 0.13
B e C 0.75 0.19
A, B e C 0.61 0.14
B, C e D 0.53 0.12
A e B 0.51 0.11
A e C 0.50 0.12
A, C e D 0.48 0.10
C e D 0.33 0.08
B e D 0.24 0.05
PARAMETERS ESTIMATION
RESENDE, R. T.; MARCATTI, G. E.; PINTO, D. S.; TAKAHASHI, E. K.; CRUZ, C.D.; RESENDE, M. D. V. Intra-genotypic competition of Eucalyptus clones generated by environmental heterogeneity can optimize productivity in forest stands. Forest Ecology and Management, v. 380, p. 50-58, 2016.
STOEHR, M.; BIRD, K.; NIGH, G.; WOODS, J.; YANCHUK,
A. Realized genetic gains in coastal Douglas-fir in British
Columbia: implications for growth and yield projections. Silvae Genetica, v. 59, n. 5, p. 223-233, 2010.
STURION, J. A. e RESENDE, M. D. V. Eficiência do delineamento
experimental e capacidade de teste no melhoramento
genético da erva-mate (Ilex paraguariensis St. Hil). Pesquisa
Florestal Brasileira, n. 50, p. 3-10, 2005.
YE, T. Z.; JAYAWICKRAMA, K. J. S. Efficiency of using spatial analysis in first-generation coastal Douglas-fir progeny tests
in the US Pacific Northwest. Tree Genetics & Genomes,