ACPD
7, 11091–11121, 2007Effects of temperature on NOy
partitioning
R. C. Cohen et al.
Title Page
Abstract Introduction
Conclusions References
Tables Figures
◭ ◮
◭ ◮
Back Close
Full Screen / Esc
Printer-friendly Version
Interactive Discussion
EGU
Atmos. Chem. Phys. Discuss., 7, 11091–11121, 2007 www.atmos-chem-phys-discuss.net/7/11091/2007/ © Author(s) 2007. This work is licensed
under a Creative Commons License.
Atmospheric Chemistry and Physics Discussions
Observations of the e
ff
ects of
temperature on atmospheric HNO
3
,
Σ
ANs,
Σ
PNs, and NO
x
: evidence for a
temperature dependent HO
x
source
D. A. Day1, P. J. Wooldridge1, and R. C. Cohen1,2,3
1
Department of Chemistry, UC Berkeley, USA
2
Department of Earth and Planetary Science, UC Berkeley, USA
3
Energy and Environment Technologies Division, Lawrence Berkeley National Laboratory, USA
Received: 5 July 2007 – Accepted: 18 July 2007 – Published: 26 July 2007
ACPD
7, 11091–11121, 2007Effects of temperature on NOy
partitioning
R. C. Cohen et al.
Title Page
Abstract Introduction
Conclusions References
Tables Figures
◭ ◮
◭ ◮
Back Close
Full Screen / Esc
Printer-friendly Version
Interactive Discussion
EGU
Abstract
We describe observations of atmospheric reactive nitrogen compounds including NO, NO2, total peroxy nitrates, total alkyl nitrates, and HNO3and their correlation with tem-perature. The measurements were made at a rural location 1315 m a.s.l. on the west-ern slope of the Sierra Nevada Mountains in California during summer of 2001. The
5
ratio of HNO3 to its source molecule, NO2, and the ratio of HNO3 to all other higher oxides of nitrogen (NOz) all increase with increasing temperature. Analysis of these increases suggests they are due to a steep increase in OH of between a factor of 2 and 3 over the range 18–32◦C. Total peroxy nitrates decrease and total alkyl nitrates increase over the same temperature range. The decrease in the total peroxy nitrates
10
is shown to be much less than expected if the rate of thermal decomposition were the sole important factor and to be consistent with the increase in OH inferred from the temperature trends in the HNO3/NO2ratio.
1 Introduction
Observations and models show surface concentrations of ozone generally increase
15
with temperature (e.g., Cardelino and Chameides, 1990; Olszyna et al., 1997; 1995). Since predictions are that global temperatures and regional heatwaves will occur with increasing frequency as greenhouse gases accumulate in the atmosphere, under-standing the mechanisms responsible for the temperature dependence of O3 is re-ceiving renewed attention (e.g., Hogrefe et al., 2004; Leung and Gustafson, 2005;
20
Murazaki and Hess, 2006; Steiner et al., 2006; Stevenson et al., 2005). High tem-peratures are known to be correlated with stagnation events which are one factor re-sponsible for the ozone temperature correlations. Observations and models also show that the anthropogenic (Rubin et al., 2006; Stump et al., 1992; Welstand et al., 2003) and biogenic (Lamb et al., 1987; Wiedinmyer et al., 2005) VOC emissions that are
25
ACPD
7, 11091–11121, 2007Effects of temperature on NOy
partitioning
R. C. Cohen et al.
Title Page
Abstract Introduction
Conclusions References
Tables Figures
◭ ◮
◭ ◮
Back Close
Full Screen / Esc
Printer-friendly Version
Interactive Discussion
EGU
temperature ozone correlations. However, the temperature response of NOx, the other major precursor to ozone and of more oxidized nitrogen oxides (peroxy nitrates, alkyl and multifunctional nitrates and HNO3) which are co-products of ozone production, is much less well established.
In a comprehensive modeling study, Sillman and Sampson (1995) described
cal-5
culations of NOy partitioning as a function of temperature for several locations. They discussed the role of the steep temperature dependence of the thermal decomposition rate for PAN on the response of ozone to temperature concluding, that “PAN chemistry appears to have an equal or greater impact than the more obvious causes of the tem-peratures dependence, i.e., insolation, H2O, or increased emission of isoprene.” The
10
only corresponding experimental study of the relationship of temperature to nitrogen oxides is the study by Olszyna et al. (1997) who describe summertime observations of PAN/NOy for a range of temperature and the contribution of NOx, PAN, HNO3, partic-ulate nitrate, and total NOz to NOy for two different temperatures at a rural site. They observe that, as a fraction of NOy, PAN and NOxdecrease with temperature, HNO3and
15
particulate nitrate change very little, while NOzand an unidentified contribution to NOy (that they attribute as likely due to alkyl nitrates) increase with temperature. They sug-gest that the shift from PAN to the unidentified NOzcomponent at higher temperatures may be the result of the change in the PAN thermal equilibrium providing increased NOxand RO2for alkyl and multifunctional nitrate production.
20
In this manuscript, we describe observations of atmospheric reactive nitrogen com-pounds including NO, NO2, total peroxy nitrates (ΣPNs), total alkyl nitrates (ΣANs), and HNO3 and their correlation with temperature. The measurements were made at a rural location 1315 m a.s.l. on the western slope of the Sierra Nevada Mountains in California during summer of 2001. The site has an extremely regular meteorology
25
Re-ACPD
7, 11091–11121, 2007Effects of temperature on NOy
partitioning
R. C. Cohen et al.
Title Page
Abstract Introduction
Conclusions References
Tables Figures
◭ ◮
◭ ◮
Back Close
Full Screen / Esc
Printer-friendly Version
Interactive Discussion
EGU
search Station almost every day with little variation in transit time. As a consequence of this regularity, all of the observations we present are from a single source region and observations within a single season provide sufficient statistics to examine the correlations between temperature and the abundance of the various nitrogen oxides.
2 Measurements and site description
5
Measurements described in this paper were made from June–September, 2001 near the University of California – Blodgett Forest Research Station (UC-BFRS) (1315 m a.s.l., 38.9◦N, 120.6◦W). The site is a managed ponderosa pine
planta-tion located in the mid Sierra Nevada Mountains 75 km northeast of Sacramento, CA (pop. 410 000, Greater Sacramento Area∼=2 million) in a sparsely populated region.
10
The climate at this site is discussed in detail in Dillon et al. (2002) and Kurpius et al. (2002). Briefly, the climate of the western Sierras has a wet and a dry season. The dry season (May through September) is characterized by warmer temperatures, low rainfall, clear skies, and steady, regular east/west, upslope/downslope winds. The wet season (October-April) is characterized by cooler temperatures, moderate rainfall or
15
snowfall, and less regular wind patterns. Temperatures peak in summer (June-August) and are lowest in late-fall through winter. During the dry season, upslope winds of 2– 3 m/s from the southwest prevail during the day, switching at the hours of 18–19 (local time) to downslope winds of 0.5–2 m/s from the northeast with a return to southwest-erlies at 7–8 in the morning. Very few days during the dry season are an exception
20
to this pattern. Summer measurements described in this paper were characterized by almost no precipitation (<3 cm total), consistently warm temperatures (average daily peak (±1σ)=24.4±3.7◦C). Temperatures warmed by 3–5 degrees ◦C from early June reaching a peak in August. During summer, synoptic timescale temperature shifts occur on timescales of 2–7 days and can have magnitudes of as much as 10◦C
tem-25
ACPD
7, 11091–11121, 2007Effects of temperature on NOy
partitioning
R. C. Cohen et al.
Title Page
Abstract Introduction
Conclusions References
Tables Figures
◭ ◮
◭ ◮
Back Close
Full Screen / Esc
Printer-friendly Version
Interactive Discussion
EGU
bringing with it the urban plume from Sacramento, CA and it suburbs on more than 9 out of 10 days.
The role of transport and anthropogenic emissions in the summertime Sacramento plume as observed at the UC-BFRS are described by Dillon et al. (2002) and Murphy et al. (2006a, b, c). Briefly, the upslope/downslope flow pattern that characterizes
trans-5
port in the western Sierras imposes a regular pattern on concentrations of chemicals that have their source in the Greater Sacramento Area. The concentrations of these compounds increase throughout the day during the upslope flow from the southwest (245 degrees). Downslope flow from the northeast (50 degrees) returns cleaner air to the site with minimum concentrations observed in the early to mid morning.
Concen-10
trations of long-lived species (e.g. acetylene) typically begin to increase at noon and reach their peak at 22 h, 2–3 h after the shift to downslope flow suggesting the center of the plume is slightly to the north of the UC-BFRS. Concentrations drop gradually after the 22 h peak reaching a minimum in mid-morning (10:00 a.m. local time). The concentrations of reactive species also exhibit strong variations with day-of-the-week
15
due to variations in urban NOxemissions and the resulting day-of-the-week patterns in OH concentrations (Murphy et al., 2006b, c).
A 10 m walk-up tower was used as a sampling platform in order to sample air above the tree canopy. Gas inlets and supporting equipment were mounted on the tower and accompanying analytical instrumentation was housed in a small wooden shed and a
20
modified refrigerated shipping container with temperature control at the base of the tower.
Thermal dissociation – laser induced fluorescence (TD-LIF) was used to measure NO2, total peroxy nitrates (ΣPNs), total alkyl nitrates (ΣANs), and HNO3 at the UC-BFRS. The TD-LIF technique is described in detail in Day et al. (2002), application
25
ACPD
7, 11091–11121, 2007Effects of temperature on NOy
partitioning
R. C. Cohen et al.
Title Page
Abstract Introduction
Conclusions References
Tables Figures
◭ ◮
◭ ◮
Back Close
Full Screen / Esc
Printer-friendly Version
Interactive Discussion
EGU
TD-LIF (Thornton et al., 2000). For the UC-BFRS TD-LIF instrument as set up from 2001–2005, an ambient sample flows rapidly through an inlet and is immediately split into four channels. The first one is used to observe NO2; the second is heated to 180◦C causing thermal dissociation (TD) ofΣPNs, the third to 350◦C for additional TD ofΣANs, and the fourth to 550◦C to include TD of HNO
3. The dissociation of all of these
5
species produces NO2with unit efficiency. The NO2signal in each channel is the sum of the NO2contained in all of the compounds that dissociate at the inlet temperature or below. Differences between the NO2 signals observed simultaneously from channels heated to adjacent set-points are used to derive absolute abundances of each of these four classes of NOy. The technique has the advantage that it measures the total
contri-10
bution to NOyin each class. For example,ΣPNs are expected to be predominantly PAN (peroxyacetyl nitrate), PPN (peroxypropionyl nitrate), and MPAN (peroxymethacryloyl nitrate). The measurement includes these three and all other peroxy and acyl peroxy nitrates and N2O5. However, we do not expect non-acyl peroxy nitrates or N2O5 to be present in significant concentrations in the summer, daytime boundary layer that is the
15
focus of in this paper. Laboratory experiments show that the HNO3channel measures the sum of gas phase HNO3and thermally labile HNO3aerosols such as NH4NO3with near unit efficiency. Confirmation of this laboratory result with field data is available from comparisons of TD-LIF measurements and PILS aerosol nitrate measurements under conditions where NH3was sufficiently high that nearly 100% of the HNO3was
20
aerosol NO−
3 (Fountoukis et al., 2007). Salts such as NaNO3are not detected (Bertram and Cohen, 2003). Similarly,ΣANs are calculated to consist of all alkyl and multifunc-tional nitrates present in the gas or aerosol phase. Inorganic nitrate aerosols were reported to contribute 25% to measured inorganic nitrate (HNO3gas + NO−
3 particulate) in the mid-Sierras during summer (Zhang et al., 2002). Measurements of NH3at the
25
ACPD
7, 11091–11121, 2007Effects of temperature on NOy
partitioning
R. C. Cohen et al.
Title Page
Abstract Introduction
Conclusions References
Tables Figures
◭ ◮
◭ ◮
Back Close
Full Screen / Esc
Printer-friendly Version
Interactive Discussion
EGU
(ΣNOyi≡NO (measured by chemiluminescence)+NO2+ ΣPNs+ ΣANs+HNO3) and total NOy (measured by catalysis – chemiluminescence) shows that these two values are usually within 10% of each other (Day et al., 2003; Dillon, 2002). Measurements of NO were made at the UC-BFRS using NO-O3 chemiluminescence (Thermo Envi-ronmental Co. model 42CTL). Wind speed, wind direction, humidity, temperature, CO2
5
and O3concentrations, net radiation, photosynthetically-active radiation, and pressure were measured as described in Goldstein et al. (2000) and Bauer et al. (2000).
3 Results and analysis
During the summer, anthropogenic emissions in the region of the study are dominated by those from motor vehicles and have a strong weekday vs. weekend variation. To
10
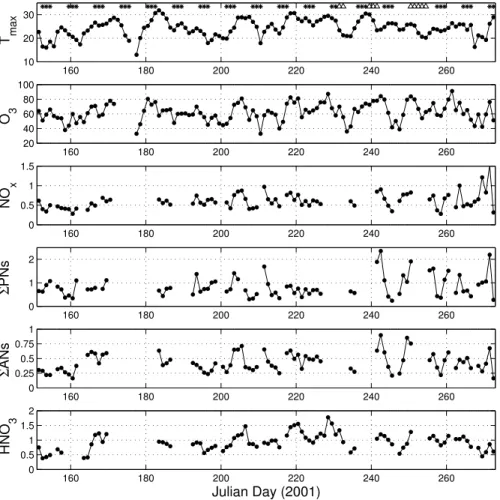
eliminate this variable from our analysis, we present data from Tuesday through Friday. Observations on Saturday through Monday are consistent with our conclusions but have lower overall NOy because of reduced weekend emissions in Sacramento and because of the approximately two-day memory for emissions within the region (Murphy et al., 2006b, c). Figure 1 shows the afternoon (12–16 h) medians of O3 and the
15
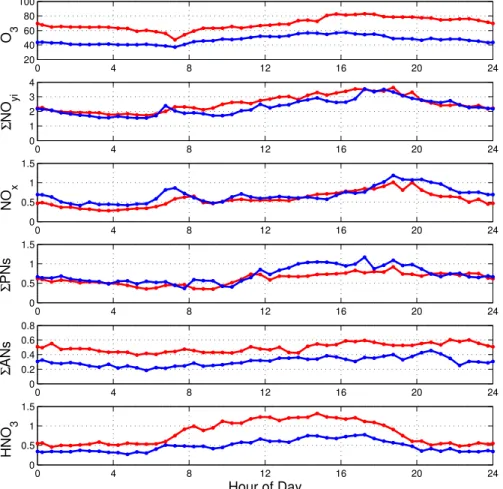
reactive nitrogen species for each day of the summer 2001. Figure 2 shows the diurnal cycles of O3,ΣNOyi, NOx,ΣPNs,ΣANs, and HNO3 with half-hour time resolution. We represent the effects of temperature throughout each day by a single variable, the maximum daily temperature observed at UC-BFRS during the afternoon. We define a day as starting at 05:00 a.m. just prior to change of direction in the airflow from
20
downslope to upslope. The daily upslope/downslope behavior observed at this site is apparent in the diurnal cycles of ΣNOyi, NOx, ΣPNs, and O3. HNO3 is much more strongly affected by local photochemistry than any of these species and its diurnal cycle more closely tracks the solar zenith angle than it does the transport patterns. This effect has been observed at many other surface sites (e.g. Brown et al., 2004;
25
ACPD
7, 11091–11121, 2007Effects of temperature on NOy
partitioning
R. C. Cohen et al.
Title Page
Abstract Introduction
Conclusions References
Tables Figures
◭ ◮
◭ ◮
Back Close
Full Screen / Esc
Printer-friendly Version
Interactive Discussion
EGU
local photochemistry.
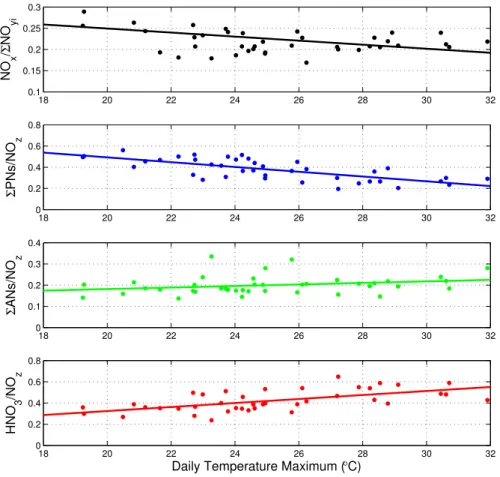
The clearest signatures of the effects of temperature can be seen in the mixing ratios of ozone,ΣANs and HNO3all of which have higher mixing ratios at high temperatures. The blue (colder) and red (warmer) lines in Fig. 2 represent the 17th and 83rd per-centile of the measurements as ordered by the associated Tmax. Figure 3 shows the
5
median afternoon (12–16 h) NOx/ΣNOyi,ΣPNs/NOz,ΣANs/NOz, and HNO3/NOzratios vs. Tmax, where NOz≡ΣPNs+ ΣANs+HNO3. Lines representing a least-squares fit to the data are shown. The correlations ofΣPNs/NOz(slope=-0.023 ppb/ ˚ C, R2=0.52) and HNO3/NOz (slope = 0.019 ppb/◦C, R2
= 0.37) with temperature are strong with opposite signs. Both NOx/ΣNOyi (slope=–0.0048 ppb/◦C, R2=0.14) and ΣANs/NOz
10
(slope=0.0036 ppb/◦C, R2=0.069) exhibit weaker correlations with temperature. De-spite the low R2 values, one can see that the lines shown do capture the major pat-terns present in the data. Figure 4 shows absolute concentrations of NOx,ΣNOyi, NOz, and O3 vs. temperature. NOx concentrations show no significant increase or correla-tion,ΣNOyi and NOz exhibit weak positive correlations and increases of approximately
15
25%, and O3shows a strong positive correlation with an increase of more than 30 ppbv. The timing of the diurnal cycles of the individual species or classes of reactive nitro-gen (Fig. 2) are similar for the two temperature ranges indicating that contributions of the major processes affecting their mixing ratios remain similar, independent of tem-perature. The most notable effects of temperature on the concentrations are the large
20
increases in the HNO3, ΣANs and O3 with increasing temperature. In contrast, as a fraction of NOz, the decreases in ΣPNs and the increases in HNO3 stand out more strongly than the change in the fraction of NOzrepresented byΣANs. Despite the near doubling ofΣANs mixing ratios for much of the day (Fig. 2) the ratio of ΣANs to NOz during afternoon increases by only ∼30% with a weak correlation with temperature.
25
ACPD
7, 11091–11121, 2007Effects of temperature on NOy
partitioning
R. C. Cohen et al.
Title Page
Abstract Introduction
Conclusions References
Tables Figures
◭ ◮
◭ ◮
Back Close
Full Screen / Esc
Printer-friendly Version
Interactive Discussion
EGU
coefficient of R2=0.14 and slope of 0.0048◦C−1. This correlation and slope are much smaller than reported by Olszyna et al. (1997) who describe the NOz/NOy correlation with temperature and indicate it has a correlation coefficient of R2=0.81 and slope 0.042◦C−1. However, at higher temperatures, where Olszyna et al. (1997) observe a larger degree of processing of the plume (NOz/NOy >0.7) the correlation and
magni-5
tude of slope diminishes dramatically. All but one of the observations shown in Fig. 3 have NOz/NOy >0.7, thus a direct comparison of the two data sets can be misleading as the range in NOx/NOydoes not overlap.
3.1 Transport
Observations of local wind speeds and duration do not support any correlation
be-10
tween warmer temperatures and increased flow from the Sacramento Valley. Winds are very consistent during the summer. There was a slight, but weak anti-correlation between wind speeds and temperature which would be expected to slow the arrival of the anthropogenic plume from Sacramento and result in lower CO, NOy and other chemicals which are predominantly emitted in Sacramento and then transported to the
15
site. Nevertheless, we observe a weak correlation of CO with temperature (R2=0.10) that corresponds to a 35% increase from 18–32◦C. In addition, VOC’s measured at the UC-BFRS for 2 months during summer 2001 (with lifetime>4.5 h for OH=1×10⁷: butane, i-butane, hexane, methanol, propyne, toluene, pentane, and acetone) all had correlation coefficients of 0.10 or less with some increasing and others decreasing with
20
temperature. While the evidence is at best equivocal, it can support no more than a 35% increase in the concentration of CO and VOC species carried by the urban plume. Based on the observed slope of the CO vs.ΣNOyi correlation this can amount to no more than 20% increase in NO2. It is likely that much of the CO increase is biogenic and that therefore the NOxincrease is much smaller than even this upper limit.
ACPD
7, 11091–11121, 2007Effects of temperature on NOy
partitioning
R. C. Cohen et al.
Title Page
Abstract Introduction
Conclusions References
Tables Figures
◭ ◮
◭ ◮
Back Close
Full Screen / Esc
Printer-friendly Version
Interactive Discussion
EGU
3.2 HNO3
Each of the different classes of NOy provides some insight into the mechanisms that are responding to changes in temperature. The relationship of HNO3mixing ratios with temperature for the data set is approximately linear increasing from 0.46 ppb at 18◦C
to 1.4 ppb at 32◦C with a slope 0.067 ppb/◦C and an R2=0.50. During the daytime,
5
the concentration of the HNO3 can be approximately described as a stationary state between chemical production and losses to deposition and dilution:
kOH+NO2[OH] [NO2]= Vdep
Hml
HNO3
+Kdil HNO3
−HNO3
bg
(1)
whereVdep is the deposition velocity (0.034 m/s, Farmer and Cohen, 2007),Hml is the mixed layer height (∼800 m, Carroll and Dixon, 1998; Dillon et al., 2002; Seaman et al.,
10
1995), Kd i l is the dilution rate constant including both vertical venting and horizontal diffusion of the plume into the background air (∼0.23 h−1, Dillon et al., 2002), and
[HNO3]bg is the background nitric acid concentration into which the plume is diluted. We estimate that the free-tropospheric [HNO3]bgfor this region is roughly 200 ppt which is the intercept of the plot of [HNO3] vs. [H2O] for observations discussed in Murphy et
15
al. (2006a) at a site at higher elevation in the Sierras which was often effected by free tropospheric air. Rearranging,
HNO3 [NO2] =
kOH+NO2[OH] +Kdil[HNO3]bg[NO 2] Vdep
HML +Kdil
(2)
For NO2=0.6 ppb, OH=1×10⁷ molecules/cm3 and kOH+NO2=9.90×10⁻¹²cm3 molecules−1 s−1 (Sander et al., 2006), the lifetime of 1 ppb of HNO
3 with respect
20
ACPD
7, 11091–11121, 2007Effects of temperature on NOy
partitioning
R. C. Cohen et al.
Title Page
Abstract Introduction
Conclusions References
Tables Figures
◭ ◮
◭ ◮
Back Close
Full Screen / Esc
Printer-friendly Version
Interactive Discussion
EGU
upwind where the NO2and probably the OH concentrations are higher (Murphy et al., 2006c) and thus, at the UC-BFRS, HNO3concentrations are likely slightly higher than would be achieved in steady-state because the transport source of HNO3is significant. Nonetheless, the steady-state expression above provides a reasonable approximation for thinking about HNO3. Similar equations relating HNO3, NO2, and OH,, without
5
the dilution term, have been presented previously (Brown et al., 2004; Parrish et al., 1986).
NO2concentrations, the rate constant for the OH+NO2 reaction, the boundary layer height, the deposition velocity and the dilution rate do not vary strongly with tempera-ture. Thus, the only variable in Eqs. (1) and (2) that can explain the increase in HNO3
10
with temperature is OH. We calculate afternoon OH concentrations using the relation-ship shown in Eqs. (1) and (2) (and the values for other parameters discussed above). We estimate the average temperature within the 800 m mixed layer (Tml) using surface temperatures and the environmental lapse rate (6.5◦C/km), resulting in temperatures
approximately 3 ˚ C lower than surface temperatures. A linear fit to the correlation plot
15
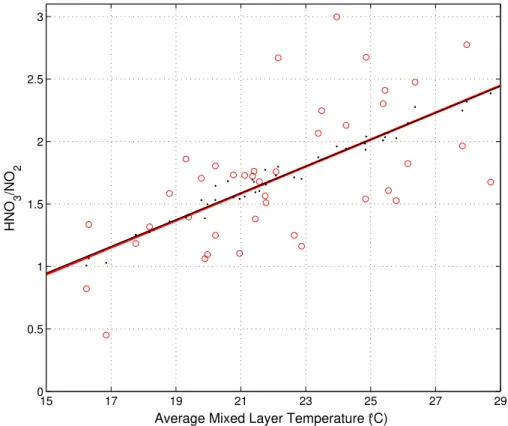
of OH vs. Tml yields an increase in OH from 8 x 10⁶ molecules/cm3 at Tml=15◦C to 2.4×10⁷ molecules/cm3 at Tml=29×C, a 3-fold increase. Figure 5 shows the median afternoon (12–16 h) HNO3/NO2 data vs. Tml (red circles). Also shown are modeled values for the HNO3/NO2ratio calculated using the linear best fit line of the OH vs. Tml correlation plot and Eq. (2). The coincident best fit lines are also shown. The scatter
20
in the modeled data is due solely to the HNO3and NO2data since the other variables are either constant or vary linearly with temperature. The linear fit captures the general trend in the HNO3/NO2data suggesting that a linear relationship between OH and T is reasonable.
The more rapid conversion of NO2 to HNO3 implied by this higher OH must also
25
ACPD
7, 11091–11121, 2007Effects of temperature on NOy
partitioning
R. C. Cohen et al.
Title Page
Abstract Introduction
Conclusions References
Tables Figures
◭ ◮
◭ ◮
Back Close
Full Screen / Esc
Printer-friendly Version
Interactive Discussion
EGU
NOy. Likely temperature dependent sources of NO2include the thermal decomposition of PNs, a decrease in the dilution rate, and an increase in soil NOx emissions. These factors are discussed further in the sections below.
As discussed above, we expect that the OH concentrations predicted using the steady state calculation and concentrations at the UC-BFRS is an overestimate of
5
the OH responsible for producing the observed HNO3 since NO2 conditions are ele-vated upwind. Without a more detailed model, estimating the effective NO2for use in Eqs. (1) and (2) is difficult. To bracket the amount of NO2and thus the absolute value of OH we compare an estimate using a 3 times larger value of NO2and calculate OH of 2.7×10⁶and 8×10⁶ molecules/cm3for the two temperature extremes. This is a factor
10
of three lower OH but the trend with temperature is still large, an increase of about a factor of 3. Both calculations produce OH estimates in the range of the average OH concentration (1.1±0.5×10⁷ molecules/cm3) in the Sacramento plume for the 5-hour transect from Folsom, CA to the UC-BFRS that Dillon et al. (2002) calculated using a Lagrangian model and VOC measurements. That model represented a single average
15
daily maximium temperature of 25◦C.
3.3 ΣPNs
ΣPNs are approximately in thermal equilibrium with peroxyacyl radicals and NO2under warm boundary layer conditions (Cleary et al., 2007):
KPNi(T)= [PNi]
[PAi][NO2] (3)
20
Where KP Ni(T) is the equilibrium constant, for each respective PN. This equilibrium is established through the reactions:
PAi +NO2→PNi (R1)
ACPD
7, 11091–11121, 2007Effects of temperature on NOy
partitioning
R. C. Cohen et al.
Title Page
Abstract Introduction
Conclusions References
Tables Figures
◭ ◮
◭ ◮
Back Close
Full Screen / Esc
Printer-friendly Version
Interactive Discussion
EGU
which determine the partitioning of the PN reservoir between the stable PNi and its radical partner PAi. In, addition, peroxyacyl radicals are also approximately in photo-chemical steady state with their sources and sinks (Cleary et al., 2007). Consider the case for the most common peroxyacyl nitrate, peroxyacetyl nitrate (PAN) and the per-oxyacetyl radical (PA). The primary reactions that contribute to net formation and loss
5
of the sum of PA and PAN include:
acetaldehydeormethyglyoxal+OH(+O2)→PA+H2O (R3)
PA+NO→Products (R4)
PA+HO2→Products (R5)
PA+RO2→Products. (R6)
10
Solving for the steady-state concentration of PA+PAN we derive:
[PA+PAN]ss= k3[acetaldehyde(methyglyoxal)] [OH]
k4[NO]+k5[HO2]+k6[RO2]
(1+KPAN[NO2]) (4)
We estimate the average temperature within the boundary layer using surface tempera-tures and the environmental lapse rate as discussed above in the HNO3section. From 15 to 29◦C the equilibrium constant controlling the ratio of PA
i to PNi decreases by a
15
factor of 9 for PAN and PPN (Sander et al., 2006) respectively. Using the observedΣPN and NO2 concentrations and the equilibrium constant for PAN, we calculate the sum of all peroxyacyl radicals during mid-afternoon in the boundary layer finding a 5-6-fold increase from∼0.7 ppt to 3.7 ppt for the 15–29◦C range of boundary layer average tem-perature. Trainer et al. (1991) examined observations at Scotia, PA in the summertime
20
and calculated an increase in peroxyacyl radicals from 8–14 ppt over the temperature range from 26–32◦C.
ACPD
7, 11091–11121, 2007Effects of temperature on NOy
partitioning
R. C. Cohen et al.
Title Page
Abstract Introduction
Conclusions References
Tables Figures
◭ ◮
◭ ◮
Back Close
Full Screen / Esc
Printer-friendly Version
Interactive Discussion
EGU
fold increase in the loss rate ofΣPNs during transport to UC-BFRS. The decrease we observe is much smaller, only about 30%, a fact that implies a nearly 5–6 fold increase in the source ofΣPNs. Two factors are primarily responsible:
1. A doubling of acetaldehyde and an implied increase in methylglyoxal associated with isoprene emissions and oxidation and a 10-fold increase of methacrolein
5
with temperature. Both of these represent increases sources of two of the major peroxyacyl radicals.
2. A large increase in OH.
If we assume a 3-fold increase in OH and a 2-fold increase inΣPN source aldehydes then the product is equal to the 6-fold increase in sources that we calculate and is
10
consistent with the increase in OH estimate from the HNO3/NO2ratio.
The net ΣPN decrease with T that we observe at Blodgett Forest corresponds to a release of about 500 ppt of NO2 at the site. However, at UC-BFRS we observe a negligible change in NOxwith temperature implying almost all of this 500 ppt has gone to increases in the HNO3(andΣAN) production during the transit of the plume to
UC-15
BFRS. If we assume that this increased NOx was present upwind of Blodgett Forest, where most of the HNO3we observe at UC-BFRS is produced, then the increase in OH needed to reproduce the changes in HNO3/NO2 is calculated to be smaller than the ∼3-fold increase calculated using constant NO2. Since PNs are only about 20% of NO2 at Granite Bay (Murphy et al., 2006a), the effective increase in NO2 with T integrated
20
over the transect is likely no more than 20% and the OH required to produce HNO3is then calculated to be only 20% smaller than when we neglect this effect.
3.4 ΣANs
ΣANs increase by 250 ppt, 75% with temperature (Fig. 2) and by+45% and+30% as a fraction of NOy and NOz (Fig. 3), respectively. Quantitative interpretation of these
25
ACPD
7, 11091–11121, 2007Effects of temperature on NOy
partitioning
R. C. Cohen et al.
Title Page
Abstract Introduction
Conclusions References
Tables Figures
◭ ◮
◭ ◮
Back Close
Full Screen / Esc
Printer-friendly Version
Interactive Discussion
EGU
increasing. In addition, the lifetime ofΣANs with respect to OH and O3 is highly un-certain because it is not known what fraction of reactions of OH withΣANs produce multifunctional ΣAN products and what fraction produce NO2 or HNO3. (See Farmer and Cohen (2007) for additional discussion of this issue). Inspection of the diurnal cy-cle of ΣANs in Fig. 2 suggests that ΣAN increases may be, in part, due to nighttime
5
chemical production. Evaluation of the effects of temperature on nighttime chemistry are interesting, but beyond the scope of this manuscript.
3.5 NOxand NOy
In addition to the effects ofΣPNs discussed above, an increase in the source of NOx with temperature may be explained by increased NOx soil emissions. Herman et al.
10
reported that NOx soil emissions in an oak forest in the Sierra Nevada foothills had fluxes of 5.8–15 ppt m s−1 (under canopy/open area with mean soil temperatures of
∼24/28◦C) (2003). Farmer and Cohen use an observationally constrained model to calculate a NOx flux from UC-BFRS of 27 ppt m s−1 (Farmer and Cohen, 2007). That NOx flux was estimated to be no more than 1/3 due to soil emissions with the balance
15
likely HONO emissions or due to an unknown source. Soil NOx emissions have been shown to exhibit an exponential relationship with temperature (van Dijk et al., 2002; Williams et al., 1992). The estimated soil term of 9 ppt m s−1, diluted into an 800 m
boundary layer it represents∼40 ppt/h. Over a 5 h transit time, these emissions could account for a large fraction of the source that maintains near constant NOx and of the
20
approximately 700 ppt increase in NOy that we observe, if they follow the exponential temperature pattern.
The ratio of NO/NO2during mid-afternoon showed a weak correlation with tempera-ture (slope=–0.0020◦C−1, R2=0.063, and increasing by about+17% from 18–32◦C)). This ratio is controlled by the photolysis of NO2 and oxidation of NO by oxidants such
25
ACPD
7, 11091–11121, 2007Effects of temperature on NOy
partitioning
R. C. Cohen et al.
Title Page
Abstract Introduction
Conclusions References
Tables Figures
◭ ◮
◭ ◮
Back Close
Full Screen / Esc
Printer-friendly Version
Interactive Discussion
EGU
removed from large NOxsources that can be represented as:
jNO2[NO2]=kNO+O3[NO][O3]+kNO+RO2[NO][HO2+RO2] (5)
where jNO2 is the rate constant of the photolysis reaction NO2+hν → NO+O (UCAR/NCAR/ACD), kNO+O3 the rate constant for the reaction of NO+O3→NO2+O2 (Sander et al., 2006), and kNO+ROx the average rate constant for the reaction of
5
NO+RO2 and NO+HO2 →NO2+RO, OH which we approximate as the rate constant for reaction of HO2with NO. Rate constants are taken from Sander et al. (2006).
For days that we have simultaneous measurements of NO, NO2and O3we estimate the HO2+RO2 concentrations using Eq. (5). The afternoon averages were 200 ppt with a 100 ppt variance. However, the HO2+RO2 values derived from the NO/NO2
10
ratio is quite noisy and affected substantially by uncertainty in the NO instrument’s measurement of zero. Within the envelope of the noise and our estimates of the effects of the uncertainty in the NO instrument zero, we estimate the maximum trend in peroxy radicals that would be consistent with the data is+47% and the minimum is –25%. This is a weaker temperature-dependence than suggested by our interpretation of the HNO3
15
andΣPN data as implying increases in OH of a factor of 2–3. OH increases that are this large would normally be accompanied by HO2+RO2 increases of 40–200% assuming the peroxy radicals increase with OH concentration with a dependence between linear and as the square root. This implies that most of the increase in OH occurred upwind, perhaps in closer proximity to the isoprene emissions, or that a chemical process that
20
alters the HO2+RO2to OH ratio is active.
3.6 O3
The strong correlation of O3with temperature shown in Fig. 4 is typical for a rural site. This slope of 2.2 ppb/◦C is similar to that reported for other rural sites at a similar
tem-perature range (3±1,∼3–5, respectively) (Olszyna et al., 1997; Sillman and Samson,
25
ACPD
7, 11091–11121, 2007Effects of temperature on NOy
partitioning
R. C. Cohen et al.
Title Page
Abstract Introduction
Conclusions References
Tables Figures
◭ ◮
◭ ◮
Back Close
Full Screen / Esc
Printer-friendly Version
Interactive Discussion
EGU
average is used (as was used in the calculations, Sillman and Sampson, 1995). In-spection of the diurnal cycles of O3, shown in Fig. 2, suggests that this relationship with temperature is due both to increases in production rates for single days but also to accumulation during multi-day events where carryover from the previous day is im-portant.
5
4 Discussion
Our results bear some similarities to the results of Olszyna et al. (1997), who report that the ratio PAN/NOy decreased with increasing temperature with a slope of –0.015◦C−1,
that NOz increased from 55 to 75% of NOy, that NOx/NOy decreased from 45 to 25%, that PAN/NOy decreased from 35 to 20%, that [HNO3 + particulate nitrate] was
un-10
changed, and that the “missing NOy” increased from 0 to 20% over an ambient tem-perature range of 25◦C to 30◦C. We observe a slope forΣPNs/ΣNO
yi of –0.015◦C−1, identical to the PAN/NOyslope reported by Olyszna et al. In contrast to Olszyna et al.’s observation, we see a much larger increase in HNO3/NOyand equating their “missing NOy” with ourΣANs we observe a much smaller increase ofΣANs/NOy. Other reports
15
of correlations of reactive nitrogen species with temperature include positive correla-tions of HNO3 and negative correlations of PAN for three different seasons (summer, spring, and winter) (Bottenheim and Sirois, 1996), a negative correlation of PAN and temperatures for a yearlong dataset (Gaffney and Marley, 1993), and increases of PAN with temperature during summer (Schrimpf et al., 1998). In addition, several models
20
discussing effects of climate change predict decreases in ΣPN concentrations (e.g., Steiner et al., 2006; Stevenson et al., 2005).
Since the model discussed in Sillman and Sampson (1995) is the most complete and comparable discussion in the literature of the relationship of temperature and reactive nitrogen partitioning in a rural environment, it is valuable to discuss in some more length
25
ACPD
7, 11091–11121, 2007Effects of temperature on NOy
partitioning
R. C. Cohen et al.
Title Page
Abstract Introduction
Conclusions References
Tables Figures
◭ ◮
◭ ◮
Back Close
Full Screen / Esc
Printer-friendly Version
Interactive Discussion
EGU
midday OH, HO2, O3, HNO3,ΣPNs andΣANs, and NOx concentrations vs. the daily maximum temperature. For these two sites, over the temperature range we consider in this paper (18–32◦C), they show relative changes inΣPNs of –50%, ΣANs of+50% to as much+150%, and little to no change in NOxor HNO3. Although our observations of
ΣPNs and NOx closely match those predictions, this is likely fortuitous because of the
5
large differences between the predictions of HNO3andΣANs and our observations. In the Sillman and Sampson calculations most of the additional NOx available from decreasing ΣPNs forms ΣANs, making ΣANs the dominant contribution to NOz at higher temperatures. They attribute this large rise inΣANs to increasing isoprene emis-sions producing isoprene nitrates. They used a yield of 10% for alkyl nitrate formation
10
from reaction of NO with isoprene peroxy radicals, and a slow deposition velocity for isoprene nitrates. Comparison of our observations of ΣANs on the DC-8 to a global model show that parameters that are more consistent with theΣAN measurements are a yield of 4% and a rapid deposition rate, one that is similar to that of HNO3(Horowitz et al., 2006). These adjustments to the model would also free up NOxthat would partially
15
be converted to HNO3resulting in increased HNO3at higher temperatures.
Nevertheless, it is surprising that Sillman and Sampson (1995) predict nearly con-stant HNO3 since they show predicted changes in OH (for the Michigan site) in which OH nearly doubles over the relevant temperature range. Since no significant increase in HNO3 accompanies this OH increase, the formation rate of ANs, consuming the
20
available NOx, must increase much faster in the model – preesumably because iso-prene is a more effective NOxsink in the model than at our site. Also in contrast to our observations, other researchers have predicted that with increased isoprene, PNs (and ANs) will increase at the expense of HNO3 (Lopez et al., 1989; Trainer et al., 1991). Further research is needed to understand if these differences between models and our
25
ACPD
7, 11091–11121, 2007Effects of temperature on NOy
partitioning
R. C. Cohen et al.
Title Page
Abstract Introduction
Conclusions References
Tables Figures
◭ ◮
◭ ◮
Back Close
Full Screen / Esc
Printer-friendly Version
Interactive Discussion
EGU
O3 increases by 65% from 18–32◦C (Fig. 4) and if only considering the e
ffect of the primary production rate of OH (O3+hν→2OH) this would account for 65% of the OH increase. A likely more important factor is the increase in upwind sources of isoprene and its oxidation products which are exponentially related to temperature, increasing by approximately a factor of 15 from 18 to 32◦C (Dreyfus et al., 2002). CH
2O, which is
5
calculated to be nearly equal in importance to O3as an HOxsource at the UC-BFRS, is a major product of isoprene oxidation, and a direct HOx source. Also, there are now several direct observations of OH and indirect measures of the influence of OH showing that OH is increased above model predictions in environments rich in biogenic VOC (Farmer and Cohen, 2007; Kuhn et al., 2007).
10
5 Conclusions
We have presented measurements of the effects of ambient temperature (18–32◦C)
on the atmospheric mixing ratios of a nearly complete suite of speciated reactive ni-trogen. We observe that there is a small decrease in NOx/NOy, a large increase in HNO3/NO2, a decrease in ΣPNs and an increase in ΣANs with increasing
tempera-15
ture. Analysis of the results show small changes in NOx and ΣNOyi indicating a near balance in temperature-dependant NOxsources, NOx oxidation rates, and permanent NOz losses in relatively aged air. However, large changes in the ratios of the different oxides suggests a large temperature dependent increase in OH. This increase cannot be explained by temperature dependent increases in O3 or H2O.Increases in H2CO
20
are also likely too small, leading us to suggest that there are chemical processes as-sociated with isoprene emissions (and thus indirectly with temperature) that are not accurately represented in current chemical mechanisms. This conjecture is consistent with the analysis of Thornton et al. (2002) and more recent laboratory and field data (Hasson et al., 2004; Kuhn et al., 2007; Ren et al., 20071; Stickler et al., 2007).
25
1
ACPD
7, 11091–11121, 2007Effects of temperature on NOy
partitioning
R. C. Cohen et al.
Title Page
Abstract Introduction
Conclusions References
Tables Figures
◭ ◮
◭ ◮
Back Close
Full Screen / Esc
Printer-friendly Version
Interactive Discussion
EGU
There are few measurements of the effects of temperature on NOyspeciation where there were sufficient observations to track the nitrogen budget. The one prior measure-ment that was nearly as comprehensive as the one described here, was much closer to the source region, and thus there is little overlap of the NOx/NOy ratio (or approxi-mate photochemical age) of the two data sets. Still, the results are similar in the region
5
of overlap suggesting that our results might be representative of many locations and not special because of their location in the foothills of the Sierra Nevada downwind of Sacramento. Our results are quite different than prior model calculations. We observe a larger increase in the contribution of HNO3to NOz and to NOy with temperature and a smaller increase in alkyl nitrates than predicted by in Sillman and Sampson (1995).
10
The latter of these is probably in part due to the high yield (10%) and low deposition velocity used in that model, whereas there is growing evidence suggesting that smaller yields and more rapid deposition velocities for isoprene nitrates are what is occurring in the atmosphere.
In light of these and other improvements in our understanding of atmospheric
chem-15
istry, it would be valuable to revisit the temperature dependence of precursors to ozone more systematically in current models to assess whether they are consistent with the observations of NOyi and inferences about OH presented herein and to assess our current understanding of the likely effects of climate change on air quality.
Acknowledgements. We gratefully acknowledge support for the observations by the NASA
In-20
strument Incubator Program under Contract #NAS1-99053 and support for the analysis by the U.S. Environmental Protection Agency through grant RD-83096401-0 to the University of Cali-fornia, Berkeley. “Although the research described in this article has been funded wholly or in part by the U.S. Environmental Protection Agency through grant RD-83096401-0 to the Univer-sity of California, Berkeley, it has not been subjected to the Agency’s required peer and policy
25
review and therefore does not necessarily reflect the views of the Agency and no official en-dorsement should be inferred.” We also thank the staffof UC-BFRS for their support and SPI for access to the research site.
Wennberg, P. O., Singh, H. B., Blake, D. R., and Shetter, R. E.: HOxobservations and model
ACPD
7, 11091–11121, 2007Effects of temperature on NOy
partitioning
R. C. Cohen et al.
Title Page
Abstract Introduction
Conclusions References
Tables Figures
◭ ◮
◭ ◮
Back Close
Full Screen / Esc
Printer-friendly Version
Interactive Discussion
EGU
References
Bauer, M. R., Hultman, N. E., Panek, J. A., and Goldstein, A. H.: Ozone deposition to a pon-derosa pine plantation in the Sierra Nevada Mountains (CA): a comparison of two different climatic years, J. Geophys. Res.-A., 105, 22 123–22 136, 2000.
Bertram, T. H. and Cohen, R. C.: A Prototype Instrument for the Real Time Detection of
Semi-5
Volatile Organic and Inorganic Nitrate Aerosol, Eos Trans. AGU, 84(46), Fall Meet. Suppl., Abstract A51F-0740, 2003.
Bottenheim, J. W. and Sirois, A.: Long-Term Daily Mean Mixing Ratios of O-3, Pan, Hno3, and Particle Nitrate At a Rural Location in Eastern Canada - Relationships and Implied Ozone Production Efficiency, J. Geophys. Res.-A., 101, 4189–4204, 1996.
10
Brown, S. S., Dibb, J. E., Stark, H., Aldener, M., Vozella, M., Whitlow, S., Williams, E. J., Lerner, B. M., Jakoubek, R., Middlebrook, A. M., DeGouw, J. A., Warneke, C., Goldan, P. D., Kuster, W. C., Angevine, W. M., Sueper, D. T., Quinn, P. K., Bates, T. S., Meagher, J. F., Fehsenfeld, F. C., and Ravishankara, A. R.: Nighttime removal of NOx in the summer marine boundary layer, J. Geophys. Res.-A., 31, L07108, doi:10.1029/2004GL019412, 2004.
15
Cardelino, C. A. and Chameides, W. L.: Natural Hydrocarbons, Urbanization, And Urban Ozone, J. Geophys. Res.-A., 95, 13 971–13 979, 1990.
Carroll, J. J. and Dixon, A. J.: Tracking the Sacramento pollutant plume over the western Sierra Nevada. Final Report to California Air Resources board under Interagency Agreement #94-334. 26 pages plus appendicies.,http://www.arb.ca.gov/research/apr/past/atmospheric.htm,
20
1998.
Cleary, P. A., Wooldridge, P. J., Millet, D. B., McKay, M., Goldstein, A. H., and Cohen, R. C.: Observations of total peroxy nitrates and aldehydes: measurement interpretation and inference of OH radical concentrations, Atmos. Chem. Phys., 7, 1947–1960, 2007,
http://www.atmos-chem-phys.net/7/1947/2007/.
25
Day, D. A.: Observations of NO2, Total Peroxy Nitrates, Total Alkyl Nitrates, and HNO3 in the
Mid-Sierras and Sacramento Plume Using Thermal Dissociation – Laser Induced Fluores-cence, Ph. D. thesis, 207 pp, University of California at Berkeley, Berkeley, Ca, 2003. Day, D. A., Dillon, M. B., Wooldridge, P. J., Thornton, J. A., Rosen, R. S., Wood, E. C., and
Cohen, R. C.: On Alkyl Nitrates, O3, and the “Missing NOy”, J. Geophys. Res.-A., 108, 4501, 30
doi:10.1029/2003JD003685, 2003.
dissoci-ACPD
7, 11091–11121, 2007Effects of temperature on NOy
partitioning
R. C. Cohen et al.
Title Page
Abstract Introduction
Conclusions References
Tables Figures
◭ ◮
◭ ◮
Back Close
Full Screen / Esc
Printer-friendly Version
Interactive Discussion
EGU
ation laser-induced fluorescence instrument forin situdetection of NO2, peroxy nitrates, alkyl
nitrates, and HNO3, J. Geophys. Res.-A., 107, 4046, doi:10.1029/2001JD000779, 2002.
Dillon, M. B.: The Chemical Evolution of the Sacramento Urban Plume, Ph. D. thesis, 206 pp, University of California, Berkeley, 2002.
Dillon, M. B., Lamanna, M. S., Schade, G. W., Goldstein, A. H., and Cohen, R. C.: Chemical
5
evolution of the Sacramento urban plume: Transport and oxidation, J. Geophys. Res.-A., 107, 4045, 10.1029/2001JD000969, 2002.
Dreyfus, G. B., Schade, G. W., and Goldstein, A. H.: Observational constraints on the contri-bution of isoprene oxidation to ozone production on the western slope of the Sierra Nevada, CA, J. Geophys. Res.-A., 107, 4365, doi:10.1029/2001JD001490, 2002.
10
Farmer, D. K. and Cohen, R. C.: Observations of HNO3,ΣAN anΣPN and NO2fluxes: Evidence
for rapid HOxchemistry within a pine forest canopy, Atmos. Chem. Phys. Discuss., 7, 7087–
7136, 2007,
http://www.atmos-chem-phys-discuss.net/7/7087/2007/.
Fountoukis, C., Sullivan, A., Weber, R., Vanreken, T., Fischer, M., Matias, E., Moya, M., Farmer,
15
D. K., and Cohen, R. C.: Thermodynamic characterization of Mexico City Aerosol during MILAGRO 2006, Atmos. Chem. Phys. Discuss., 7, 9203–9233, 2007,
http://www.atmos-chem-phys-discuss.net/7/9203/2007/.
Gaffney, J. S. and Marley, N. A.: Measurements of Peroxyacetyl Nitrate at a Remote site in the Southwestern United States: Tropopheric Implications, Environ. Sci. Technol., 27, 1905–
20
1910, 1993.
Goldstein, A. H., Hultman, N. E., Fracheboud, J. M., Bauer, M. R., Panek, J. A., Xu, M., Qi, Y., Guenther, A. B., and Baugh, W.: Effects of climate variability on the carbon dioxide, water, and sensible heat fluxes above a ponderosa pine plantation in the Sierra Nevada (CA), Agric. Forest Meteorol., 101, 113–129, 2000.
25
Hasson, A. S., Tyndall, G. S., and Orlando, J. J.: A product yield study of the reaction of HO2 radicals with ethyl peroxy (C2H5O2), acetyl peroxy (CH3C(O)O-2), and acetonyl peroxy (CH3C(O)CH2O2) radicals, J. Phys. Chem. A, 108, 5979–5989, 2004.
Herman, D. J., Halverson, L. J., and Firestone, M. K.: Nitrogen dynamics in an annual grass-land: oak canopy, climate, and microbial population effects, Ecol. Appl., 13, 593–604, 2003.
30
ACPD
7, 11091–11121, 2007Effects of temperature on NOy
partitioning
R. C. Cohen et al.
Title Page
Abstract Introduction
Conclusions References
Tables Figures
◭ ◮
◭ ◮
Back Close
Full Screen / Esc
Printer-friendly Version
Interactive Discussion
EGU
Horowitz, L. W., Fiore, A. M., Milly, G. P., Cohen, R. C., Perring, A., Wooldridge, P. J., Hess, P. G., Emmons, L. K., and Lamarque, J.-F.: Observational constraints on the chemistry of iso-prene over the Eastern U.S., J. Geophys. Res., 112, D12S08, doi:10.1029/2006JD007747, 2007.
Kleinman, L., Lee, Y. N., Springston, S. R., Nunnermacker, L., Zhou, X. L., Brown, R., Hallock,
5
K., Klotz, P., Leahy, D., Lee, J. H., and Newman, L.: Ozone Formation At a Rural Site in the Southeastern United-States, J. Geophys. Res.-A., 99, 3469–3482, 1994.
Kuhn, U., Andreae, M. O., Ammann, C., Ara ´ujo, A. C., Brancaleoni, E., Ciccioli, P., Dindorf, T., Frattoni, M., Gatti, L. V., Ganzeveld, L., Kruijt, B., Lelieveld, J., Lloyd, J., Meixner, F. X., Nobre, A. D., P ¨oschl, U., Spirig, C., Stefani, P., Thielmann, A., Valentini, R., and Kesselmeier,
10
J.: Isoprene and monoterpene fluxes from Central Amazonian rainforest inferred from tower-based and airborne measurements, and implications on the atmospheric chemistry and the local carbon budget, Atmos. Chem. Phys., 7, 2855–2879, 2007,
http://www.atmos-chem-phys.net/7/2855/2007/.
Kurpius, M. R., McKay, M., and Goldstein, A. H.: Annual ozone deposition to a Sierra Nevada
15
ponderosa pine plantation, Atmos. Environ., 36, 4503–4515, 2002.
Lamb, B., Guenther, A., Gay, D., and Westberg, H.: A National Inventory Of Biogenic Hydro-carbon Emissions, Atmos. Environ., 21, 1695–1705, 1987.
Lefer, B. L., Talbot, R. W., and Munger, J. W.: Nitric acid and ammonia at a rural northeastern U.S. site, J. Geophys. Res.-A., 104, 1645–1661, 1999.
20
Leung, L. R. and Gustafson, W. I.: Potential regional climate change and implications to US air quality, Geophys. Res. Lett., 32, L16711, doi:10.1029/2005GL022911, 2005.
Lopez, A., Barthomeuf, M. O., and Huertas, M. L.: Simulation of chemical processess occur-ring in an atmopheric boundary layer. Influence of light and biogenic hydrocarbons on the formation of oxidants., Atmos. Environ., 23, 1465–1478, 1989
25
Murazaki, K. and Hess, P.: How does climate change contribute to surface ozone change over the United States?, J. Geophys. Res.-A, 111, D05301, doi:10.1029/2005JD005873, 2006. Murphy, J. G., Day, A., Cleary, P. A., Wooldridge, P. J., and Cohen, R. C.: Observations of the
diurnal and seasonal trends in nitrogen oxides in the western Sierra Nevada, Atmos Chem. Phys., 6, 5321–5338, 2006a
30
ACPD
7, 11091–11121, 2007Effects of temperature on NOy
partitioning
R. C. Cohen et al.
Title Page
Abstract Introduction
Conclusions References
Tables Figures
◭ ◮
◭ ◮
Back Close
Full Screen / Esc
Printer-friendly Version
Interactive Discussion
EGU
11 464, 2006b.
Murphy, J. G., Day, D. A., Cleary, P. A., Wooldridge, P. J., Millet, D. B., Goldstein, A. H., and Cohen, R. C.: The weekend effect within and downwind of Sacramento: Part 2. Observa-tional evidence for chemical and dynamical contributions, Atmos. Chem. Phys. Discuss., 6, 11 971–12 019, 2006c.
5
Olszyna, K. J., Bailey, E. M., Simonaitis, R., and Meagher, J. F.: O3 And Noy Relationships At A Rural Site, Geophys. Res. Lett., 99, 14 557–14 563, 1994.
Olszyna, K. J., Luria, M., and Meagher, J. F.: The correlation of temperature and rural ozone levels in southeastern USA, Atmos. Environ., 31, 3011–3022, 1997.
Parrish, D. D., Norton, R. B., Bollinger, M. J., Liu, S. C., Murphy, P. C., Albritoon, D. L.,
Fehsen-10
feld, F. C., and Heubert, B. J.: Measurements of HNO3 and NO3 pariculates at a rural site in the Colorado mountains, J. Geophys. Res.-A., 91, 5379–5393, 1986.
Rosen, R. S., Wood, E., Wooldridge, P. J., Thornton, J. A., D.A., D., Kuster, B., Williams, E. J., Jobson, B. T., and Cohen, R. C.: Observations of total alkyl nitrates during TEXAQS-2000Observations of total alkyl nitrates during Texas Air Quality Study 2000:
Im-15
plications for O-3 and alkyl nitrate photochemistry, J. Geophys. Res.-A., 107, D07303, doi:10.1029/2003JD004227, 2004.
Rubin, J. I., Kean, A. J., Harley, R. A., Millet, D. B., and Goldstein, A. H.: Temperature depen-dence of volatile organic compound evaporative emissions from motor vehicles, J. Geophys. Res.-A., 111, D03305, doi:10.1029/2005JD006458, 2006.
20
Sander, ..., and ... (2006), Chemical kinetics and photochemical data for use in atmospheric studies, Evaluation number 15; NASA Panel for Data Evaluation, edited, National Aeronau-tics and Space Administration; Jet Propulsion Laboratory California Institute of Technology, Pasadena, California.
Schrimpf, W., Linaerts, K., Muller, K. P., Koppmann, R., and Rudolph, J.: Peroxyacetyl
ni-25
trate (PAN) measurements during the POPCORN campaign, J. Atmos. Chem., 31, 139–159, 1998.
Seaman, N. L., Stauffer, D. R., and Lariogibbs, A. M.: A Multiscale 4-Dimensional Data Assim-ilation System Applied in the San-Joaquin Valley During Sarmap .1. Modeling Design and Basic Performance-Characteristics, J. Appl. Meteorol., 34, 1739–1761, 1995.
30
ACPD
7, 11091–11121, 2007Effects of temperature on NOy
partitioning
R. C. Cohen et al.
Title Page
Abstract Introduction
Conclusions References
Tables Figures
◭ ◮
◭ ◮
Back Close
Full Screen / Esc
Printer-friendly Version
Interactive Discussion
EGU
climate and emissions on regional air quality in California, J. Geophys. Res.-A., 111, D18303, doi:10.1029/2005JD006935, 2006.
Stevenson, D., Doherty, R., Sanderson, M., Johnson, C., Collins, B., and Derwent, D.: Im-pacts of climate change and variability on tropospheric ozone and its precursors, Faraday Discussions, 130, 41–57, 2005.
5
Stickler, A., Fischer, H., Bozem, H., Gurk, C., Schiller, C., Martinez-Harder, M., Kubistin, D., Harder, H., Williams, J., Eerdekens, G., Yassaa, N., Ganzeveld, L., Sander, R., and Lelieveld, J.: Chemistry, transport and dry deposition of trace gases in the boundary layer over the tropical Atlantic Ocean and the Guyanas during the GABRIEL field campaign, Atmos Chem. Phys. Discus., 7, 4781–4855, 2007.
10
Stump, F. D., Knapp, K. T., Ray, W. D., Snow, R., and Burton, C.: The Composition Of Motor-Vehicle Organic Emissions Under Elevated-Temperature Summer Driving Conditions (75-Degrees-F To 105-(75-Degrees-F), Journal Of The Air & Waste Management Association, 42, 152–158, 1992.
Thornton, J. A., Wooldridge, P. J., and Cohen, R. C.: Atmospheric NO2: In situ laser-induced 15
fluorescence detection at parts per trillion mixing ratios, Anal. Chem., 72, 528–539, 2000. Thornton, J. A., Wooldridge, P. J., Cohen, R. C., Martinez, M., Harder, H., Brune, W. H.,
Williams, E. J., Fehsenfeld, F. C., Hall, S. R., Shetter, R. E., Wert, B. P., and Fried, A.: Obser-vations of ozone production rates as a function of NO2abundances and HOxproduction rates
in the Nashville urban plume, J. Geophys. Res., 107, 4146, doi:10.1029/2001JD000932,
20
2002.
Trainer, M., Buhr, M. P., Curran, C. M., Fehsenfeld, F. C., Hsie, E. Y., Liu, S. C., Norton, R. B., Parrish, D. D., Williams, E. J., Gandrud, B. W., Ridley, B. A., Shetter, J. D., Allwine, E. J., and Westberg, H. H.: Observations and Modeling of the Reactive Nitrogen Photochemistry At a Rural Site, J. Geophys. Res.-A., 96, 3045–3063, 1991.
25
UCAR/NCAR/ACD: Tropospheric Ultraviolet and Visible (TUV) Radiation Model, http://cprm. acd.ucar.edu/Models/TUV/, 2006.
van Dijk, S. M., Gut, A., Kirkman, G. A., Meixner, F. X., Andreae, M. O., and Gomes, B. M.: Biogenic NO emissions from forest and pasture soils: Relating laboratory studies to field measurements, J. Geophys. Res.-A., 107, 8058, doi:10.1029/2001JD000358, 2002.
30
ACPD
7, 11091–11121, 2007Effects of temperature on NOy
partitioning
R. C. Cohen et al.
Title Page
Abstract Introduction
Conclusions References
Tables Figures
◭ ◮
◭ ◮
Back Close
Full Screen / Esc
Printer-friendly Version
Interactive Discussion
EGU
Wiedinmyer, C., Greenberg, J., Guenther, A., Hopkins, B., Baker, K., Geron, C., Palmer, P. I., Long, B. P., Turner, J. R., Petron, G., Harley, P., Pierce, T. E., Lamb, B., Westberg, H., Baugh, W., Koerber, M., and Janssen, M.: Ozarks Isoprene Experiment (OZIE): Mea-surements and modeling of the ”isoprene volcano”, J. Geophys. Res.-A., 110, D18307, doi:10.1029/2005JD005800, 2005.
5
Williams, E. J., Guenther, A., and Fehsenfeld, F. C.: An Inventory of Nitric-Oxide Emissions from Soils in the United-States, J. Geophys. Res.-A., 97, 7511–7519, 1992.
Williams, E. J., Roberts, J. M., Baumann, K., Bertman, S. B., Buhr, S., Norton, R. B., and Fehsenfeld, F. C.: Variations in NOycomposition at Idaho Hill, Colorado, J. Geophys. Res.-A., 102, 6297–6314, 1997.
10
ACPD
7, 11091–11121, 2007Effects of temperature on NOy
partitioning
R. C. Cohen et al.
Title Page
Abstract Introduction
Conclusions References
Tables Figures
◭ ◮
◭ ◮
Back Close
Full Screen / Esc
Printer-friendly Version
Interactive Discussion
EGU
160 180 200 220 240 260
10 20 30
T ma
x
160 180 200 220 240 260
20 40 60 80 100
O 3
160 180 200 220 240 260
0 0.5 1 1.5
NO
x
160 180 200 220 240 260
0 1 2
Σ
PNs
160 180 200 220 240 260
0 0.25 0.5 0.75 1
Σ
ANs
160 180 200 220 240 260
0 0.5 1 1.5 2
HNO
3
Julian Day (2001)
Fig. 1. Daily temperature maxima (Tmax) and daily averages (medians) of O3, ΣNOyi, NOx,
ACPD
7, 11091–11121, 2007Effects of temperature on NOy
partitioning
R. C. Cohen et al.
Title Page
Abstract Introduction
Conclusions References
Tables Figures
◭ ◮
◭ ◮
Back Close
Full Screen / Esc
Printer-friendly Version
Interactive Discussion
EGU
0 4 8 12 16 20 24
0 1 2 3 4
Σ
NO
yi
0 4 8 12 16 20 24
0 0.5 1 1.5
NO
x
0 4 8 12 16 20 24
0 0.5 1 1.5
Σ
PNs
0 4 8 12 16 20 24
0 0.2 0.4 0.6 0.8
Σ
ANs
0 4 8 12 16 20 24
0 0.5 1 1.5
HNO
3
Hour of Day
0 4 8 12 16 20 24
20 40 60 80 100
O 3
Fig. 2.Diurnal cycles of O3,ΣNOyi, NOx,ΣPNs,ΣANs, and HNO3shown for half-hour intervals
of the 17th and 83rd percentile of the measurements as ordered by the associated daily tem-perature maximum (Tmax); Tmax 17th percentile=20.8◦C (blue), Tmax 83rd percentile 28.4◦C
ACPD
7, 11091–11121, 2007Effects of temperature on NOy
partitioning
R. C. Cohen et al.
Title Page
Abstract Introduction
Conclusions References
Tables Figures
◭ ◮
◭ ◮
Back Close
Full Screen / Esc
Printer-friendly Version
Interactive Discussion
EGU
18 20 22 24 26 28 30 32
0.1 0.15 0.2 0.25 0.3
NO
x
/
Σ
NO
yi
18 20 22 24 26 28 30 32
0 0.2 0.4 0.6 0.8
Σ
PNs/NO
z
18 20 22 24 26 28 30 32
0 0.1 0.2 0.3 0.4
Σ
ANs/NO
z
18 20 22 24 26 28 30 32
0 0.2 0.4 0.6 0.8
Daily Temperature Maximum (°C)
HNO
3
/NO
z
Fig. 3. NOx/ΣNOyiΣPNs/NOz,ΣANs/NOz, and HNO3/NOz averaged (median) for single daily
values during hours 12-16 vs. daily temperature maximum. Least-squares fit lines shown from top to bottom have parameters: slopes =–0.0048, –0.023, 0.0036, 0.019 and R2 values =
ACPD
7, 11091–11121, 2007Effects of temperature on NOy
partitioning
R. C. Cohen et al.
Title Page
Abstract Introduction
Conclusions References
Tables Figures
◭ ◮
◭ ◮
Back Close
Full Screen / Esc
Printer-friendly Version
Interactive Discussion
EGU
18 20 22 24 26 28 30 32
0 1 2 3 4 5 6 7 8 9 10
Daily Temperature Maximum (°C)
Mixing Ratio (ppb)
O
3/10 ΣNOyi NO
z
NOx
Fig. 4.O3,ΣNOyi, NOz, and NOxaveraged (median) for single daily values during hours 12–16
ACPD
7, 11091–11121, 2007Effects of temperature on NOy
partitioning
R. C. Cohen et al.
Title Page
Abstract Introduction
Conclusions References
Tables Figures
◭ ◮
◭ ◮
Back Close
Full Screen / Esc
Printer-friendly Version
Interactive Discussion
EGU
15 17 19 21 23 25 27 29
0 0.5 1 1.5 2 2.5 3
Average Mixed Layer Temperature (°C)
HNO
3
/NO
2
Fig. 5. HNO3/NO2 averaged (median) for single daily values during hours 12–16 vs. average