Vol. 52, Special Number: pp. 17-28, November 2009
ISSN 1516-8913 Printed in Brazil BRAZILIAN ARCHIVES OF
BIOLOGY AND TECHNOLOGY
A N I N T E R N A T I O N A L J O U R N A L
Characterization of Corn Landraces Planted Grown in the
Campos Gerais Region (Paraná, Brazil) for Industrial
Utilization
Alessandra Teixeira Barbosa Pinto
1, Joyce Pereira
2, Tatiana Roselena de Oliveira
1,
Rosilene Aparecida Prestes
1, Rodrigo Rodrigues Mattielo
3and Ivo Mottin Demiate
1*1Universidade Estadual de Ponta Grossa; Avenida Carlos Cavalcanti, 4748; 84030-900; Ponta Grossa – PR –
Brasil. 2 Curso de Engenharia de Alimentos, 3 Pós-Graduação em Agronomia.
ABSTRACT
This work has the objective of characterizing twenty corn landraces grown in the Campos Gerais region (Paraná State) in relation to its chemical composition (moisture, ash, protein, ether extract, dietary fiber and starch) and physical properties (weight of 1000 grains, real density, flotation index, granulometry and color). In addition, also the lab scale processing of the kernels from the varieties was carried out for producing starch; starch purity was evaluated by measuring its protein contamination. Amylose contents and viscoamylograph profile were also evaluated. The results showed that the evaluated landraces have differences in chemical composition as well as in pericarp/endosperm/germ proportions and consequently it should have different industrial applications and interest for plant breeding.
Key words: maize landraces, chemical composition, starch, physical properties, rapid viscoanalyzer
*Author for correspondence:[email protected]
INTRODUCTION
Corn (Zea mays, L.) is one of the main cultivated
cereals all around the world. Its economic importance is due to many different ways of utilization from animal feeding to high technology
industry (Cruz et al., 2006). Although corn kernels
have not an expressive importance in direct human diet, several corn products are relevant for people of low income regions.
The main parts of corn kernel are the endosperm, pericarp and the germen. Each fraction presents distinct chemical composition and the quality is dependent from the genetic material as well as from the environment conditions.
occur among the different geographical regions, including technical, economical, cultural and social aspects (Schmildt; Krause & Cruz, 2006). In this way, it is essential that plant breeders be very aware to select the correct materials for the distinct national conditions.
In this corn breeding process the landraces are of
great interest (Miranda et al., 2007) for identifying
the needs of the farmers and exploiting their genetic variability. The landraces have potential in contributing with desired characteristics of cultivated plants including resistance to diseases and agricultural pests, improving crops and food safety (Fowler & Hodgkin, 2004, Birol; Villalba & Smale, 2007).
Several evidences show the importance of rescuing landraces for knowing their variability in terms of chemical composition of their edible parts and other economical interesting characteristics for industrial utilization as well as for breeding programs.
MATERIALS AND METHODS
Material
Representative samples of 20 corn landraces (Table 1) were grown in randomized blocks with four repetitions. The experiment was conducted at
the School Farm of Universidade Estadual de
Ponta Grossa, in Ponta Grossa, Paraná. The
sowing was made in November/2006 and the harvest in March/2007. The sowing fertilization
was made with 300 kg ha-1 of the 5-25-25 (NPK)
formulation. A complimentary fertilization was made 45 days after germination with urea (100 kg
ha-1 of nitrogen). The corn kernels were milled in a
rotor mill (Tecnal model TE-633, Piracicaba, SP, Brazil) adjusted for fine milling and the granulometry of the milled product was evaluated with a Bertel (Caieiras, SP, Brazil) system of vibrating sieves.
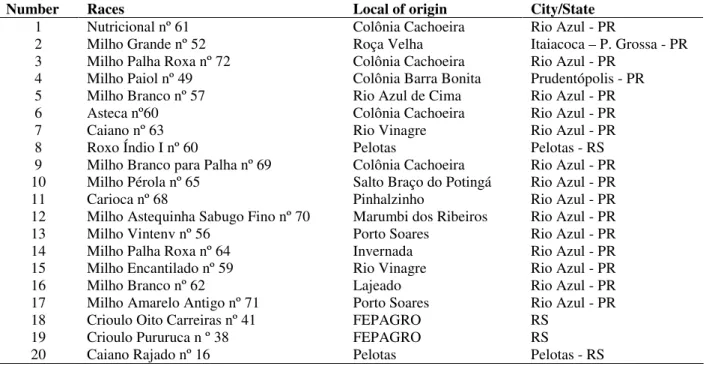
Table 1 – Identification, common denomination, local of origin, city/state where the landraces were collected or
bought.
Number Races Local of origin City/State
1 Nutricional nº 61 Colônia Cachoeira Rio Azul - PR
2 Milho Grande nº 52 Roça Velha Itaiacoca – P. Grossa - PR
3 Milho Palha Roxa nº 72 Colônia Cachoeira Rio Azul - PR 4 Milho Paiol nº 49 Colônia Barra Bonita Prudentópolis - PR
5 Milho Branco nº 57 Rio Azul de Cima Rio Azul - PR
6 Asteca nº60 Colônia Cachoeira Rio Azul - PR
7 Caiano nº 63 Rio Vinagre Rio Azul - PR
8 Roxo Índio I nº 60 Pelotas Pelotas - RS
9 Milho Branco para Palha nº 69 Colônia Cachoeira Rio Azul - PR 10 Milho Pérola nº 65 Salto Braço do Potingá Rio Azul - PR
11 Carioca nº 68 Pinhalzinho Rio Azul - PR
12 Milho Astequinha Sabugo Fino nº 70 Marumbi dos Ribeiros Rio Azul - PR
13 Milho Vintenv nº 56 Porto Soares Rio Azul - PR
14 Milho Palha Roxa nº 64 Invernada Rio Azul - PR
15 Milho Encantilado nº 59 Rio Vinagre Rio Azul - PR
16 Milho Branco nº 62 Lajeado Rio Azul - PR
17 Milho Amarelo Antigo nº 71 Porto Soares Rio Azul - PR
18 Crioulo Oito Carreiras nº 41 FEPAGRO RS
19 Crioulo Pururuca n º 38 FEPAGRO RS
20 Caiano Rajado nº 16 Pelotas Pelotas - RS
Chemical composition
The chemical characterization of corn kernels included the following analyses: moisture content (AOAC, 2000, 925.10), protein (AOAC, 2000, 920.87), ash (AOAC, 2000, 923.03), lipids (IAL, 1985), starch (Demiate et al., 2001) and dietary fiber (AOAC, 2000, 985.29).
Physical properties
The weight of 1000 kernels of each sample was
made as described by Mauricio et al., 2004).
corn kernel weight was put into the pycnometer and xylene was used for completely filling the empty spaces among the kernels. The total weight was registered and used for calculations.
The flotation index was evaluated (Lojano-Alejo et al., 2007) by using a sodium nitrate solution (41 g in 100 mL of water) with a known density of
1.25 g dm-3 at 23 °C. The kernels were put in this
solution that was stirred. After resting for one minute, the floating kernels were counted. The hardness classification was based on a scale proposed by Salinas; Bustos & Gómez (1992), with floating index (FI) between 0 and 12 % for very hard, 13 to 37% for hard, 38 to 62% for intermediary hard, 63 to 87 % for soft and higher than 87 % for very soft kernels.
Starch extraction
The starch extraction was made following the method of Ji, Seetharaman & White (2004), with some adaptations. For extracting starch, 100 kernels were used, being 25 of each block. There was removal of impurities and damaged kernels. Steeping started when the kernels were put into 40 mL of a 1 % sodium metabisulphite solution at 45°C for 72 h, followed by manual pericarp and germen removal. The endosperm fraction was put into 30 mL of distilled water and finely ground. This suspension was centrifuged for 10 min at 3,200 rpm for accelerating starch separation. The pellet was recovered and mixed with excess of a 0.1 % NaOH solution, in graduated cylinders for making precipitation fast. These cylinders were cooled to around 4 ºC for 24 h. The sediment was passed through a 325 mesh sieve, washing with distilled water. For neutralizing the sediment starch, addition of a 0.1 % HCl solution was made followed by distilled water washings until pH reached 6.0 - 7.0. The purified starch was then recovered by using a vacuum filtration system. The starch was dried for 24 h in a circulating oven at 45 °C until constant weight.
Starch characterization
All starch samples extracted from the corn kernels were stored in a dessicator for moisture stabilization. The analyses were made with two repetitions.
Properties of the starch pastes
The starch pastes of the 20 different starch samples were made by employing a Rapid Viscoanalyzer (RVA 4, Newport Scientific,
Warriewood, Australia) using the STD1 profile of the software Thermocline. The data shown in the results are average of two repetitions. Starch slurries at 8.0 % (14.0 % moisture basis) were analyzed, considering a final slurry weight of 28 g.
Statistical analysis
The results were analyzed by the ANOVA followed by the Tukey test at 95 % confidence level. These analyses were made using the ASSISTAT version 7.1 beta software (Silva, 2004). A correlation matrix was also built up in order to better discuss the results, employing the Statistica version 5.0 software, considering 95 % confidence level. The principal component analysis (PCA) was employed in order to extract information from the results, using the Pirouette version 4.11 software (Infometrix). The auto scaling processing of the data was used for producing better results.
RESULTS AND DISCUSSION
The raw results are presented in the Table 2. The results showed that for moisture and ash contents, there were no significant differences at 95 % of confidence. The average values of moisture ranged
from 10.29 % (Milho Grande nº52) to 11.45 %
(Milho Encantilado nº 59). Other published papers (Luchin; Barcaccia and Parrini, 2003; Gonçalves et al., 2003) revealed results of ash of 1.56 % and 1.27 % in corn landraces and hybrids, respectively. The ANOVA showed significant difference for the protein levels among the varieties. The variety Crioulo Oito Carreiras nº 41 had the higher protein level (12.41%), whereas the variety Caiano Rajado nº16 had the lower (10.26 %). In the literature some authors reported that the protein contents for corn landraces were between 10.47 to 12.17 % (Câmara, 2005), and in hybrids from 7.77 to 13.84 % (Jiang et al., 2007). The average value found for dietary fiber was of 13.0 % and for starch this value was of 60.54 %. Other reports stated that starch contents in corn landraces were from 67.2 % (Câmara, 2005) to more than
70.0 % (Seetharaman et al., 2001).
Starch extraction
other reports where commercial corn hybrids were evaluated the germ percentages were of 5.75 %
(Dowd, 2003), 6.20 % (Fox et al., 1992) and 6.97
% (Lopes-Filho, 1997). The Milho Paiol nº49 had
the higher endosperm percentage (86.97 %) and
high starch extraction yield (39.87 %). On the other hand, the Asteca nº60 had the lower value (81.50 %) and one of the lowest starch extraction yield (20.22 %).
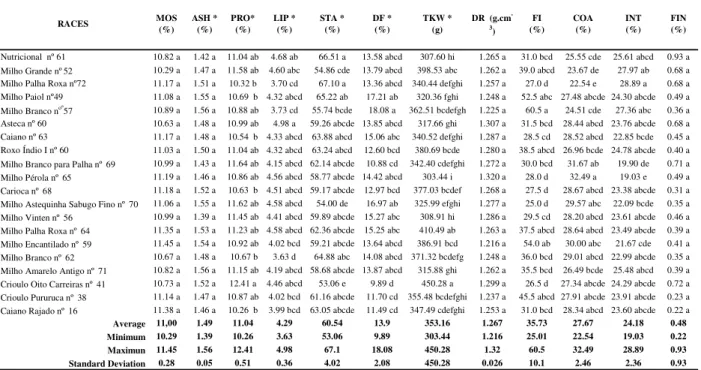
Table 2 – Physicochemical composition and physical properties of corn landrace kernels.
RACES MOS
(%) ASH *
(%) PRO*
(%) LIP *
(%)
STA * (%)
DF * (%)
TKW * (g)
DR (g.cm
-3)
FI (%)
COA (%)
INT (%)
FIN (%)
Nutricional nº 61 10.82 a 1.42 a 11.04 ab 4.68 ab 66.51 a 13.58 abcd 307.60 hi 1.265 a 31.0 bcd 25.55 cde 25.61 abcd 0.93 a Milho Grande nº52 10.29 a 1.47 a 11.58 ab 4.60 abc 54.86 cde 13.79 abcd 398.53 abc 1.262 a 39.0 abcd 23.67 de 27.97 ab 0.68 a Milho Palha Roxa nº72 11.17 a 1.51 a 10.32 b 3.70 cd 67.10 a 13.36 abcd 340.44 defghi 1.257 a 27.0 d 22.54 e 28.89 a 0.68 a Milho Paiol nº49 11.08 a 1.55 a 10.69 b 4.32 abcd 65.22 ab 17.21 ab 320.36 fghi 1.248 a 52.5 abc 27.48 abcde 24.30 abcde 0.49 a Milho Branco noº57 10.89 a 1.56 a 10.88 ab 3.73 cd 55.74 bcde 18.08 a 362.51 bcdefgh 1.225 a 60.5 a 24.51 cde 27.36 abc 0.36 a Asteca nº 60 10.63 a 1.48 a 10.99 ab 4.98 a 59.26 abcde 13.85 abcd 317.66 ghi 1.307 a 31.5 bcd 28.44 abcd 23.76 abcde 0.68 a Caiano nº 63 11.17 a 1.48 a 10.54 b 4.33 abcd 63.88 abcd 15.06 abc 340.52 defghi 1.287 a 28.5 cd 28.52 abcd 22.85 bcde 0.45 a Roxo Índio I nº 60 11.03 a 1.50 a 11.04 ab 4.32 abcd 63.24 abcd 12.60 bcd 380.69 bcde 1.280 a 38.5 abcd 26.96 bcde 24.78 abcde 0.40 a Milho Branco para Palha nº 69 10.99 a 1.43 a 11.64 ab 4.15 abcd 62.14 abcde 10.88 cd 342.40 cdefghi 1.272 a 30.0 bcd 31.67 ab 19.90 de 0.71 a Milho Pérola nº 65 11.19 a 1.46 a 10.86 ab 4.56 abcd 58.77 abcde 14.42 abcd 303.44 i 1.320 a 28.0 d 32.49 a 19.03 e 0.49 a Carioca nº 68 11.18 a 1.52 a 10.63 b 4.51 abcd 59.17 abcde 12.97 bcd 377.03 bcdef 1.268 a 27.5 d 28.67 abcd 23.38 abcde 0.31 a Milho Astequinha Sabugo Fino nº 70 11.06 a 1.55 a 11.62 ab 4.58 abcd 54.00 de 16.97 ab 325.99 efghi 1.277 a 25.0 d 29.57 abc 22.09 bcde 0.35 a Milho Vinten nº 56 10.99 a 1.39 a 11.45 ab 4.41 abcd 59.89 abcde 15.27 abc 308.91 hi 1.286 a 29.5 cd 28.20 abcd 23.61 abcde 0.46 a Milho Palha Roxa nº 64 11.35 a 1.53 a 11.23 ab 4.58 abcd 62.36 abcde 15.25 abc 410.49 ab 1.263 a 37.5 abcd 28.64 abcd 23.49 abcde 0.39 a Milho Encantilado nº 59 11.45 a 1.54 a 10.92 ab 4.02 bcd 59.21 abcde 13.64 abcd 386.91 bcd 1.216 a 54.0 ab 30.00 abc 21.67 cde 0.41 a Milho Branco nº 62 10.67 a 1.48 a 10.67 b 3.63 d 64.88 abc 14.08 abcd 371.32 bcdefg 1.248 a 36.0 bcd 29.01 abcd 22.99 abcde 0.35 a Milho Amarelo Antigo nº 71 10.82 a 1.56 a 11.15 ab 4.19 abcd 58.68 abcde 13.87 abcd 315.88 ghi 1.262 a 35.5 bcd 26.49 bcde 25.48 abcd 0.39 a Crioulo Oito Carreiras nº 41 10.73 a 1.52 a 12.41 a 4.46 abcd 53.06 e 9.89 d 450.28 a 1.299 a 26.5 d 27.34 abcde 24.29 abcde 0.72 a Crioulo Pururuca nº 38 11.14 a 1.47 a 10.87 ab 4.02 bcd 61.16 abcde 11.70 cd 355.48 bcdefghi 1.237 a 45.5 abcd 27.91 abcde 23.91 abcde 0.23 a Caiano Rajado nº 16 11.38 a 1.46 a 10.26 b 3.99 bcd 63.05 abcde 11.49 cd 347.49 cdefghi 1.253 a 31.0 bcd 28.34 abcd 23.60 abcde 0.22 a
Average 11,00 1.49 11.04 4.29 60.54 13.9 353.16 1.267 35.73 27.67 24.18 0.48
Minimum 10.29 1.39 10.26 3.63 53.06 9.89 303.44 1.216 25.01 22.54 19.03 0.22
Maximun 11.45 1.56 12.41 4.98 67.1 18.08 450.28 1.32 60.5 32.49 28.89 0.93
Standard Deviation 0.28 0.05 0.51 0.36 4.02 2.08 450.28 0.026 10.1 2.46 2.36 0.93
MOS: Moisture, ASH: Ash, PRO: Protein, LIP: Lipids, DF: Dietary Fiber, STA: Starch, TKW: 1.000 kernel weight, RD: Real density, FI: Flotation Index, COA: Coarse
MOS: Moisture, ASH: Ash, PRO: Protein, LIP: Lipids, DF: Dietary Fiber, STA: Starch, TKW: 1.000 kernel weight, RD: Real density, FI: Flotation Index, COA: Coarse particles (850 µm and 600 µm), INT: Intermediate particles (250 µm and 180 µm), FIN: Fine particles (125 µm and bottom).
* Dry weight bases
Values with similar letters in the same column do not differ significantly (p<0,05).
Table 3 – Fractions of the kernels and starch extraction yields.
Races Pericarp (%) Germ (%) Endosperm (%) Yield (%)
Nutricional no 61 5.27 10.16 84.57 31.15
Milho Grande no 52 6.18 11.10 82.72 33.02
Milho Palha Roxa no 72 6.74 7.91 85.35 24.43
Milho Paiol no49 5.98 7.05 86.97 39.87
Milho Branco no 57 5.62 10.36 84.02 27.27
Asteca no 60 5.57 12.92 81.50 20.22
Caiano no 63 5.46 9.99 84.55 35.00
Roxo Índio I no 60 6.35 11.74 81.91 19.05
Milho Branco para Palha no 69 6.53 9.39 84.07 29.75
Milho Pérola no 65 5.39 8.96 85.65 33.01
Carioca no 68 6.76 11.17 82.07 27.96
Milho Astequinha Sabugo Fino no 70 6.73 11.69 81.59 32.44
Milho Vinten no 56 5.39 10.97 83.64 25.61
Milho Palha Roxa no 64 5.67 10.16 84.17 35.22
Milho Encantilado no 59 5.33 9.93 84.74 23.56
Milho Branco no 62 6.20 9.38 84.43 30.21
Milho Amarelo Antigo no 71 3.73 9.69 86.57 31.37
Crioulo Oito Carreiras no 41 4.70 10.34 84.96 28.43
Crioulo Pururuca no 38 5.73 10.22 84.05 35.95
Caiano Rajado no 16 7.38 10.26 82.37 24.78
Average 5.84 10.17 83.99 29.42
Minimum 3.73 7.05 81.50 19.05
Maximum 7.38 12.92 86.97 39.87
Starch characterization
In the Table 4 are shown the results of the analyses of extracted starch. The average protein content for the extracted starches was of 1.0 %, with a
minimum of 0.52 % (Milho Palha Roxa nº 72) and
a maximum of 1.42 % (Milho Amarelo Antigo nº
71). Ji; Seetharaman, White (2004) found protein values for corn starches extracted in laboratory in the range of 2.82 to 3.65 % and it should explain the higher extraction yields related in their report.
The apparent amylose contents of corn landrace starches did not differ at 95 % confidence level and the average value was of 17.66 %, in a range
from 13.14 % (Milho Paiol no 49) to 21.51 %
(Milho Astequinha Sabugo Fino no 70). In the case of total amylose, there was statistical difference among the starches. The average amylose content
was of 25.59 %, in a range of 19.10 % (Roxo Índio
I nº 60) to 33.86 % (Milho Palha Roxa nº 72).
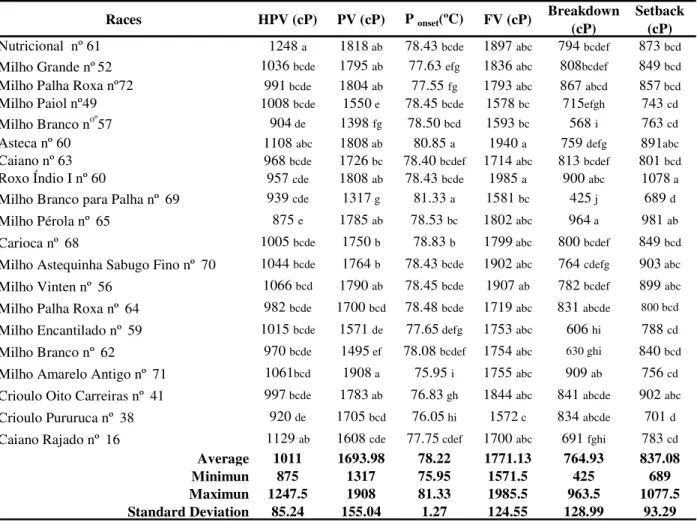
Table 4 – Hot paste viscosity, Peak viscosity, gelatinization temperature, final viscosity, breakdown and setback.
Races HPV (cP) PV (cP) P onset(ºC) FV (cP)
Breakdown (cP)
Setback (cP)
Nutricional nº 61 1248 a 1818 ab 78.43 bcde 1897 abc 794 bcdef 873 bcd Milho Grande nº52 1036 bcde 1795 ab 77.63 efg 1836 abc 808bcdef 849 bcd Milho Palha Roxa nº72 991 bcde 1804 ab 77.55 fg 1793 abc 867 abcd 857 bcd Milho Paiol nº49 1008 bcde 1550 e 78.45 bcde 1578 bc 715efgh 743 cd Milho Branco noº57 904 de 1398 fg 78.50 bcd 1593 bc 568 i 763 cd
Asteca nº 60 1108 abc 1808 ab 80.85 a 1940 a 759 defg 891abc
Caiano nº 63 968 bcde 1726 bc 78.40 bcdef 1714 abc 813 bcdef 801 bcd Roxo Índio I nº 60 957 cde 1808 ab 78.43 bcde 1985 a 900 abc 1078 a Milho Branco para Palha nº 69 939 cde 1317 g 81.33 a 1581 bc 425 j 689 d Milho Pérola nº 65 875 e 1785 ab 78.53 bc 1802 abc 964 a 981 ab Carioca nº 68 1005 bcde 1750 b 78.83 b 1799 abc 800 bcdef 849 bcd Milho Astequinha Sabugo Fino nº 70 1044 bcde 1764 b 78.43 bcde 1902 abc 764 cdefg 903 abc Milho Vinten nº 56 1066 bcd 1790 ab 78.45 bcde 1907 ab 782 bcdef 899 abc Milho Palha Roxa nº 64 982 bcde 1700 bcd 78.48 bcde 1719 abc 831 abcde 800 bcd Milho Encantilado nº 59 1015 bcde 1571 de 77.65 defg 1753 abc 606 hi 788 cd Milho Branco nº 62 970 bcde 1495 ef 78.08 bcdef 1754 abc 630 ghi 840 bcd Milho Amarelo Antigo nº 71 1061bcd 1908 a 75.95 i 1755 abc 909 ab 756 cd Crioulo Oito Carreiras nº 41 997 bcde 1783 ab 76.83 gh 1844 abc 841 abcde 902 abc Crioulo Pururuca nº 38 920 de 1705 bcd 76.05 hi 1572 c 834 abcde 701 d Caiano Rajado nº 16 1129 ab 1608 cde 77.75 cdef 1700 abc 691 fghi 783 cd
Average 1011 1693.98 78.22 1771.13 764.93 837.08
Minimun 875 1317 75.95 1571.5 425 689
Maximun 1247.5 1908 81.33 1985.5 963.5 1077.5
Standard Deviation 85.24 155.04 1.27 124.55 128.99 93.29
P gelatinization temperature; HPV: hot paste viscosity, PV: pasting viscosity, FV: final viscosity
Ponset: gelatinization temperature; HPV: hot paste viscosity, PV: peak viscosity, FV: final viscosity
Values are average of duplicate runs
Values with similar letters in the same column do not differ significantly (p<0,05).
The viscoamylographic pattern is presented in Table 4 with the main points of the analysis (viscosity peak, hot paste viscosity, final viscosity,
breakdown, setback and gelatinization
temperature). The profile is typical for most of the starch samples, the final viscosity is high due to retrogradation and the paste is relatively stable to stirred cooking, when comparing with cassava
starch (Schoch & Maywald, 1968; Cereda et al., 2001), for example.
For some samples there were lower values of final viscosities when compared to viscosity peaks. The samples that had this viscoamylographic pattern
were Milho Palha Roxa nº 72, Caiano nº 63, Milho
Amarelo Antigo nº 71 and Crioulo Pururuca nº 38.
For the Amarelo Antigo nº 71 and Crioulo
associated with the low levels of total amylose (23.85 and 21.91 %, respectively) that reduce final viscosity (Salgo & Juhász, 2008; Blazek, 2008). The Milho Palha Roxa nº 72 and Caiano nº 63 varieties had high lipid complexed amylose levels (13.18 and 10.14 %, respectively), what have direct influence on viscosity. As written by Nelles et al., (2000), a small amount of lipids or phospholipids in starch affects the paste properties. Starch has free fatty acids and phospholipids in amounts directly related with amylose, distributed asymmetrically in the granules.
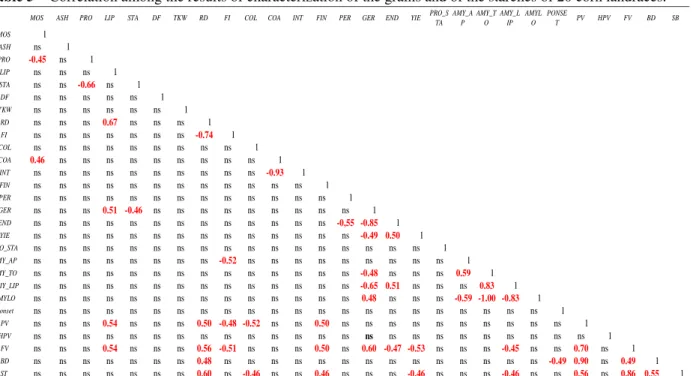
Correlation analysis
In the Table 5 the correlations among results are shown. The protein content had a negative correlation with starch content (r= -0.66, at 95 % confidence level), in the same way as reported by
Chander et al. (2008). Fox et al. (1992) also found
this correlation for corn hybrids (r= -0.63; p<0.01). The hardness, as estimated by the flotation index, did not have correlation with the protein content, although some authors found positive correlation
(Narváez-González et al., 2006), attributed to
strong association between starch granules and protein with absence of empty intergranular spaces in the endosperm (Gibbon; Wang & Larkins, 2003, Gibbon & Larkins, 2005). Pereira et al. (2008) reported that corn kernels with hard or dent endosperms have abundance of organized protein bodies what explain the compact of these endosperms.
A positive correlation was observed between lipid content and kernel real density (r = 0.67, at 95 % of confidence). Although not expected this could be explained by a study for wheat of Scott (1951) cited by Posner (1985). The author reported that wheat germen had a real density of 1.34 g cm-3,
very close to that of the whole grain, of 1.36 g cm
-3. In the germ, beyond lipids, there are important
levels of protein and sugars, which explain the data reported by Posner (1985). Furthermore the studied corn landraces presented high percentage of germ from 7.0 to 12.0 %. As expected the germ percentage and lipid content were positively correlated (r= 0.51, 95 % of confidence).
An expected negative correlation was found between flotation index and real density (r= -0.74, at 95 % of confidence); this fact was already reported by Salinas; Bustos & Gómez (1992), that found r= -0.94, at 95 % of confidence.
The granulometric profile evaluated by the percentage of coarse, intermediary and fine
particles produced by corn kernels milling, revealed a negative correlation between coarse and intermediary particles (r= -0.93, at 95 % of confidence). The hardness classification of the grains allows understanding of this correlation. The hard endosperm kernels had higher percentage of coarse particles (retained in the 850 µm and 600 µm sieves) (Milho Pérola nº 65) and the kernels classified as intermediary that had particles
between 250 µm and 180 µm of diameter (Milho
Grande nº 52). In this way, we expected to have a significant correlation between hardness and the particle size distribution, but this fact did not happen.
In the processing of corn grains for starch extraction, the correlations confirmed the expected results. There were negative correlations between germ and endosperm percentages and endosperm and pericarp percentages (r= -0.85 and r= -0.55, respectively, at 95 % of confidence).
Starch extraction yield had a positive correlation with endosperm percentage (r= 0.50, at 95 % of confidence) and negative with germ percentage (r= -0.49, at 95 % of confidence).
The apparent viscosity profile (viscoamylography) of the starches was influenced by some of the studied parameters. The flotation index correlated negatively with peak viscosity (r= -0.48, at 95 % of confidence) and also with the final viscosity (r= -0.51, at 95 % of confidence). Corn varieties with low flotation index, classified in this work as hard corn (Salinas, Bustos & Gómez, 1992), presented higher average values of final viscosity (1799 cP), breakdown (772 cP) and peak viscosity (1719 cP).
Seetharaman et al. (2001) when comparing starch
(1997) reported that hard endosperm particles need more time for hydration and starch gelatinization for resulting in viscous pastes.
In relation to complexed amylose, negative correlations were found with final viscosity (r= -0.45) and setback (r= -0.46). This is discussed in other papers (Ribeiro & Seravalli, 2004) that mention that lipids affect the setback as they form complexes with helicoidal amylose and make difficult water absorption in the granules. Jane et
al. (1999) reported that the reduction in the
viscosity peak is due to lipids and phospholipids complexation with amylose.
Wickramasinghe et al. (2009) studying starches
from tuberous crops observed the influence of the granular swelling on peak viscosity and breakdown. These authors correlated positively breakdown with granular swelling and viscosity peak and stated that the bigger granules swollen more intensively. During stirred cooking, on the other hand, apparent viscosity dropped drastically. The corn starches from landraces of our study also presented a positive correlation between viscosity peak and breakdown (r= 0.90), similar to the correlation found by Hou et al. (2008) (r= 0.89; P<0.01).
Other points of the viscoamylograms were correlated as peak and final viscosities (r= 0.70, at 95 % of confidence). This was expected as these points are interdependent.
The viscosity peak and the setback were positively correlated (r= 0.56, at 95 % of confidence) due to amylose liberation during the starch granules swelling. Also the setback and the breakdown and the breakdown and the final viscosity were positively correlated (r= 0.55 and r= 0.49, respectively). Breakdown is an indicative of granular disruption related with amylose liberation. High concentrations of free amylose become available in the polymer solution and re-associate increasing the final viscosity (setback). The gelatinization temperature and the breakdown presented a negative correlation (r= -0.49, at 95 % of confidence), what could be due to the energetic demand for complete swelling of the granules. As the gelatinization temperature rises the granular swelling becomes difficult and limited and then the breakdown is lower. It is important to clarify that in this work we used the STD1 RVA profile and analysis is very short, taking only 13 min to be completed.
Table 5 – Correlation among the results of characterization of the grains and of the starches of 20 corn landraces. MOS ASH PRO LIP STA DF TKW RD FI COL COA INT FIN PER GER END YIE PRO_STA AMY_AP AMY_TO AMY_LIP AMYLO PONSET PV HPV FV BD SB
MOS 1 ASH ns 1 PRO -0.45 ns 1
LIP ns ns ns 1
STA ns ns -0.66 ns 1
DF ns ns ns ns ns 1
TKW ns ns ns ns ns ns 1
RD ns ns ns 0.67 ns ns ns 1
FI ns ns ns ns ns ns ns -0.74 1
COL ns ns ns ns ns ns ns ns ns 1
COA 0.46 ns ns ns ns ns ns ns ns ns 1
INT ns ns ns ns ns ns ns ns ns ns -0.93 1
FIN ns ns ns ns ns ns ns ns ns ns ns ns 1
PER ns ns ns ns ns ns ns ns ns ns ns ns ns 1
GER ns ns ns 0.51 -0.46 ns ns ns ns ns ns ns ns ns 1
END ns ns ns ns ns ns ns ns ns ns ns ns ns -0,55 -0.85 1
YIE ns ns ns ns ns ns ns ns ns ns ns ns ns ns -0.49 0.50 1
PRO_STA ns ns ns ns ns ns ns ns ns ns ns ns ns ns ns ns ns 1
AMY_AP ns ns ns ns ns ns ns ns -0.52 ns ns ns ns ns ns ns ns ns 1
AMY_TO ns ns ns ns ns ns ns ns ns ns ns ns ns ns -0.48 ns ns ns 0.59 1
AMIY_LIP ns ns ns ns ns ns ns ns ns ns ns ns ns ns -0.65 0.51 ns ns ns 0.83 1
AMYLO ns ns ns ns ns ns ns ns ns ns ns ns ns ns 0.48 ns ns ns -0.59 -1.00 -0.83 1
Ponset ns ns ns ns ns ns ns ns ns ns ns ns ns ns ns ns ns ns ns ns ns ns 1
PV ns ns ns 0.54 ns ns ns 0.50 -0.48 -0.52 ns ns 0.50 ns ns ns ns ns ns ns ns ns ns 1
HPV ns ns ns ns ns ns ns ns ns ns ns ns ns ns ns ns ns ns ns ns ns ns ns ns 1
FV ns ns ns 0.54 ns ns ns 0.56 -0.51 ns ns ns 0.50 ns 0.60 -0.47 -0.53 ns ns ns -0.45 ns ns 0.70 ns 1
BD ns ns ns ns ns ns ns 0.48 ns ns ns ns ns ns ns ns ns ns ns ns ns ns -0.49 0.90 ns 0.49 1
ST ns ns ns ns ns ns ns 0.60 ns -0.46 ns ns 0.46 ns ns ns -0.46 ns ns ns -0.46 ns ns 0.56 ns 0.86 0.55 1
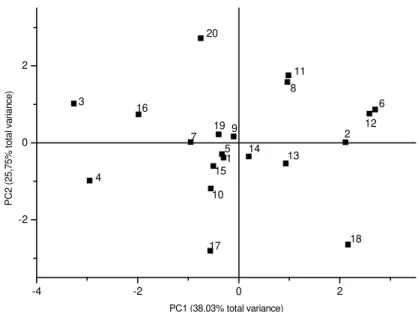
Principal component analysis (PCA)
The PCA was used to explore the variability of samples considering the selected physicochemical and physical aspects of the grains and of their starches. For an initial analysis, all the variables were considered to check the degree of explained variance. By using ten factors the explained variance reached 92.29 %. The two first PC were responsible for explaining 36.06 % (PC1 = 22.42 % and PC2 = 13.66 %) of total variance of the original data. For improving the variance explanation of the model, some variables were excluded: moisture, thousand kernels weight, color, total amylose, fine particles percentage and setback. With this next data the PCA with ten factors explained 96.22 % of the total variance. The two first PCs explained 41.52 % (PC1 = 25.58 % and PC2 = 16.84 %) of total variance of the original data. The samples were grouped in the same manner as in the first PCA, with all variables.
The positive PC1, in the right side (Fig 1), is associated with the percentage of germ, lipids, real density, protein, intermediary size particles, breakdown, peak and hot paste viscosities and gelatinization temperature. In the left side of the PC1 are the variables starch, ash, dietary fiber, percentage of endosperm and of pericarp, starch yield and flotation index. This PC should be considered a dimension of endosperm density and hardness as the samples presenting higher real densities and lower flotation indexes are located in the positive side of the component. On the other hand, the less dense kernels presenting higher flotation indexes are located in the negative side of the PC1.
The PC2 was characterized by the particle size distribution, staying in one side that of coarse and in the other of intermediary granulometry. The grains that after milling produced higher amounts of coarse particles are located in the negative side of PC2 and the samples with higher amounts of intermediary size particles are in the positive side. As a consequence, these two variables allow a separation among grains with different hardness, as the varieties with proportionally more coarse
particles have their endosperms classified as hard. In this way, the interaction of flotation index, real density, coarse and intermediary particles were responsible for the separation of the varieties in four groups (Fig 1) identified with numbers from 1 to 4, in decreasing order of endosperm hardness. The group 1 is classified as low-intermediary hardness, as the samples presented higher flotation indexes, lower densities and higher percentage of intermediary particles. The group 4, on the other hand, includes grains with higher densities, lower flotation indexes and higher percentage of coarse particles, being classified as hard.
-4 -2 0 2 4 -6
-4 -2 0 2 4 6
15
12 13 8
18
6 10
11 1 2
7
20
9 16 5
4 19 14
3 17
P
C
2
(
1
6
,8
4
%
t
o
ta
l v
a
ri
a
n
c
e
)
PC1 (25,58% total variance)
Figure 1 – Grouping of corn landracesaccording to their physicochemical and physical properties and their starches.
-0,6 -0,4 -0,2 0,0 0,2 0,4 0,6
-0,6 -0,4 -0,2 0,0 0,2 0,4 0,6 0,8
Proteína Extrato Etéreo
Germén
Fibra Alimentar
Endosperma
Pericarpo
Amido
P
C
2
(
2
5
,7
5
%
t
o
ta
l v
a
ri
a
n
c
e
)
PC1 (39,03% total variance)
-4 -2 0 2 -2
0 2
11 8
6
13 14 1
9 19 20
12 2
18 7
15
10 5 16
3
4
17
P
C
2
(
2
5
,7
5
%
t
o
ta
l v
a
ri
a
n
c
e
)
PC1 (38,03% total variance)
Figure 3 - Grouping of corn landraces by selected physicochemical characteristics and
morphological fractions.
CONCLUSION
The corn landraces presented relatively high germ percentage and consequently high lipid contents. The physical properties of corn grains like flotation index, real density and particle size distribution are important parameters for classifying endosperm hardness that was correlated with physicochemical characteristics. Grains with hard endosperms tend to present higher real density, lower flotation index and higher percentage of coarse particles after milling. The opposite pattern was met for intermediary hard kernels.
AKNOWLEDGMENTS
The financial resources for the conduction of this study were supported by the project BioAgroPar financed by FINEP, SETI/PR, and Fundação Araucária/PR; and by CNPq/Brazil.The authors
thank to the Coordenação de Aperfeiçoamento de
Pessoal de Nível Superior (CAPES) for
scholarships.
RESUMO
Esse trabalho teve o objetivo de caracterizar vinte variedades de milho crioulo cultivadas na região dos Campos Gerais (Estado do Paraná) em relação a sua composição química (umidade, cinzas, proteína, extrato etéreo, fibra alimentar e amido) e propriedades físicas (peso de 1000 grãos, densidade real, índice de flotação, granulometria e cor) Além disso, foi feito o processamento dos grãos em escala de laboratório para a extração do amido, sendo mensurado o teor de proteína. Foram avaliados os conteúdos de amilose e o perfil viscoamilográfico. Os resultados mostraram que os milhos apresentaram diferentes composições químicas e proporções pericarpo/endosperma/ gérmen e consequentemente podem ter diferentes aplicações industriais e interesse ao melhoramento de plantas.
REFERENCES
AOAC (2000), Official methods of analysis of AOAC international. 17th.ed. Washington.
Birol, E.; Villalba, E. R.; Smale, M. (2007), Farmer Preferences for Milpa Diversity and Genetically Modified Maize in Mexico. Washington: International Food Policy Research Institute, pp. 44. Blazek, J. (2008), Role of amylose in structure-function
relationship in starches from Australian wheat varieties. Doctor of Philosophy, Thesis, University of Sydney, Sidney.
Câmara, R. J. (2005), Cultivares crioulas de milho (Zea mays, L.) em sistema de produção orgânico – Desempenho agronômico das plantas e composição química das sementes. Mestrado em Agronomia Dissertação, Universidade do Oeste do Paraná, Marechal Cândido Rondon, Paraná.
Cereda, M. C. et al. (2001), Propriedades gerais do amido. ed. Fundação Cargill, CAMPINAS, pp. 50-60. cruz, j. c.; konzen, e. a.; pereira filho, i. a.; marriel, i. e.; cruz. i.; duarte, j. o.; oliveira. m. f.; alvarenga, r. c. (2006), Produção de Milho Orgânico da Agricultura Familiar. In-Ministério da Agricultura e
Abastecimento.Circular Técnica, pp. 1-17.
Demiate, I. M.; Konkel, F. E.; Pedroso, R. A. (2001), Enzymatic determination of starch in doce de leite
using dialysis. Ciência e Tecnologia de Alimentos,
21, 339-342.
Dowd, M. K. (2003), Improvements to laboratory-scale maize wet-milling procedures. Industrial Crops and Products, 18, 67-76.
Fowler, C.; Hodgkin, T. (2004), Plant genetic resources for food and agriculture: Assessing global availability. Annual Review of Environmental Resources, 29, 143-179.
Fox, S. R.; Johnson, L. A.; Hurburgh, C.R.; Dorsey-Redding C.; Bailey T. B. (1992), Relation of grain proximate composition of physical properties to wet-milling characteristics of maize. Cereal Chemistry,
69, 191-197.
Gibbon, B. C.; Larkins, B. A. (2005), Molecular genetic approaches to developing quality protein maize.
Trends in Genetics,21, 227-233.
Gibbon, B. C.; Wang, X.; Larkins, B. A. (2003), Altered starch structure is associated with endosperm modification in Quality Protein Maize. Proceedings of the National Academy of Science of United States
of America, 100, 15329–15334.
Gonçalves, R. A.; Santos, J. P.; Tomé, P. H. F.; Pereira, R. G. F. A.; Ascheri, J. L. R.; Abreu, C. M. P. (2003), Rendimento e composição química de cultivares de milho em moagem a seco e produção de grits.
Ciência e Agrotecnologia, 27, 643-650.
Hou, H. X.; Dong, H. Z.; Lui, C. F.; Zhang H. (2008), Relationships Between Some Physicochemical Properties of Starches from Maize Cultivars Grown in East China. Starch/Stärke, 60, 305–314.
IAL (1985) – Normas Analíticas do Instituto Adolfo Lutz: Métodos Químicos e Físicos para Análise de Alimentos. São Paulo: 3ª ed, pp.302-30.
Ji, Y.; Seetharaman, Y. J. K., White, P. J.(2004), Optimizing a small-scale corn starch extraction method for use in the laboratory. Cereal Chemistry,
81, p. 55-58.
Jiang, H. Y.; Zhu, Y. J.; Wei, L. M.; Dai, J. R.; Song, T. M.; Yan, Y. L. Chen, S. J. (2007), Analysis of protein, starch and oil content of single intact kernels by near infrared reflectance spectroscopy (NIRS) in maize (Zea mays L.). Plant Breeding. 126, 492-497. Lojano-Alejo, N.; Carrillo, G. V.; Pixley, K..;
Palacios-Rojas, N.(2007), Physical properties and carotenoid content of maize kernels and its nixtamalized snacks.
Innovative Food Science and Emerging Technologies,
8, 385-389.
Lopes-Filho, J. F. (1997), Moagem úmida do milho para produção de amidos e subprodutos. Boletim SBCTA, 31, 42-47.
Lucchin, M; Barcaccia, G; Parrini, P. (2003a), Characterization of a flint maize (Zea mays L. convar. Mays) Italian landrace: I. Morpho-phenological and agronomic traits. Genetic Resources
and Crop Evolution,50, 315-327.
Mauricio, R. A. S.; Figueroa, J. D. C.; Taba, S.; Reyes, M. L. V.; Rincón, F. S.; Mendoza, A. G. (2004), Characterization of maize accessions by grain and tortilla quality traits. Rev. Fitotec. Mexico, 27, 213-222.
Miranda, G. V.; Souza, L. V. De; Santos, I. C. Dos; Mendes, F. F. (2007), Resgate de variedade crioulas de milho na região de Viçosa-MG. Revista Brasileira Agroecologia, 2, 1145-1148.
Mizuma, T; Kiyokawa, Y.; Wakai, Y. (2008), Water Absorption Characteristics and Structural Properties of Rice for Sake Breweering. Journal of Bioscience and Bioengineering, 106, 258–262.
Narvaéz-González, E. D.; Figueroa-Cárdenas, J De D.; Taba, S.; Tostado, E. C.; Peniche, R. A. M.; Sánchez, F. R. (2006), Relationships between the microstructure, physical features and chemical composition of different maize accessions from Latin América. Cereal Chemistry, 83, 595-604.
Nelles, E. M.; Dewar, J.; Bason, M. L.; Taylor, J. R. N. (2000), Maize Starch Biphasic Pasting Curves.
Journal of Cereal Science, 31, 287-294.
Pereira, R. C.; Davide, L. C.; Pedrozo, C. A.; Carneiros, N. P.; Souza, L. R. P.; Paiva, E. (2008), Relationship between structural and biochemical characteristics and texture of corn grains. Genetics of Molecular Research, 7, 498-508.
Posner, E. S. (1985), The technology of wheat germ separation in flour Mills. Association of Operative Millers. 4577-4592.
Ribeiro, E. P.; Seravalli, E. A. G. (2004), Química dos Alimentos. 1. ed. São Paulo: Edgard Blücher, pp. 184.
Salgo, A.; Juhasz, R. (2008), Pasting Behavior of Amylose, Amylopectin and Their Mixtures as Determined by RVA Curves and First Derivatives.
Stärke, 60, 70-78.
Salinas, M. Y.; Bustos, F.; Gomez J. H. (1992), Comparación de métodos para medir la dureza del maíz (Zea mays L.). Archivos Latinoamericanos de Nutrición, 42, 59−63.
Schmildt, E. R; Krause, W; Cruz, C. D. (2006), Melhoria da eficiência dos experimentos de indicação de cultivares de milho. Ciência e Agrotecnologia. 30, 72-80.
Schoch, T. J.; Maywald, E. C. (1968), Preparation and properties of various legume starches. Cereal Chemistry, 45, 564-573.
Seetharaman, K.; Tziotis, A.; Borras, F.; White, P. J.; Ferrer, M.; Robutti, J. (2001), Thermal and functional characterization of starch from Argentinean corn.
Cereal Chemistry, 8, 379-386..
SILVA, F. de A. E. (2004), Assistat versão 7.1 beta. Departamento de Engenharia agrícola do CCT-UFGC, Campina Grande – PB.
Trindade, C. C. (2006), Sementes crioulas e transgênicos. Uma reflexão sobre sua relação com as comunidades tradicionais. Trabalho apresentado no XV Congresso Nacional do Conpedi, 15-18 Nov, Manaus, Amazonas.
Wickramasinghe, H. A. M.; Takigawa, S.; Endo, C. M.; Yamauchi, H.; Noda, T.(2009), Comparative analysis of starch properties of different root and tuber crops of Sri Lanka. Food Chemistry, 112, 98–