MESTRADO EM MARKETING
THE INFLUENCE OF SERVICE QUALITY AND
SATISFACTION IN CONSUMER BEHAVIOUR
INTENTION: AN EMPIRICAL STUDY OF A CHARTER
AIRLINE
MARTA INÊS DE CASTRO DIAS
Orientação:
Prof. Doutor José Manuel Cristóvão Veríssimo
Júri Presidente:
Prof. Doutora Helena do Carmo Milagre Martins Gonçalves,
Professora Auxiliar do Instituto Superior de Economia e Gestão
da Universidade Técnica de Lisboa
Vogais:
Prof. Doutor José Manuel Cristóvão Veríssimo, Professor
Auxiliar do Instituto Superior de Economia e Gestão da
Universidade Técnica de Lisboa
Prof. Patrícia Isabel Ramos Pego Nunes Tavares, Professora
Auxiliar do Instituto Superior de Economia e Gestão da
Universidade Técnica de Lisboa
2
RESUMO
Do ponto de vista teórico-empírico, a qualidade de serviço e a satisfação têm sido apontadas como fortes influenciadores das intenções comportamentais do consumidor. Estas dinâmicas já foram estudadas ao nível das companhias aéreas regulares e low-cost mas não foram encontrados registos de investigações no âmbito das companhias charter. Assim, o objetivo principal deste trabalho de investigação é analisar o impacto que a qualidade de serviço e a satisfação têm ao nível das intenções comportamentais dos passageiros duma companhia charter. Para o efeito, foi realizado um inquérito aos passageiros duma companhia charter portuguesa no período entre 24 de Julho e 20 de Agosto de 2010. Foram recolhidos 1283 questionários a passageiros de longo curso e 4507 a passageiros do médio curso.
De acordo com a literatura, constataram-se relações positivas entre a qualidade de serviço e as intenções comportamentais, sendo a satisfação, a variável que mais influi nas intenções dos passageiros.
Surpreendentemente, a dimensão da qualidade de serviço que mais influencia a satisfação e as intenções comportamentais são os tangíveis e não foi encontrada qualquer relação com significado entre o entretenimento a bordo dos aviões do médio curso e as intenções comportamentais dos passageiros. Estes resultados constituem conhecimento diretamente proveniente da voz dos passageiros que pode ser utilizado pelos investigadores de forma a desenvolverem a pesquisa no âmbito charter. Além disso, os gestores podem concluir acerca das dimensões do serviço mais valorizadas como diferenciadoras da concorrência e adjuvantes de intenções favoráveis dos passageiros para com a empresa.
Palavras-Chave: qualidade de serviço, satisfação, intenções comportamentais do consumidor, companhias aéreas charter.
JEL: M31, L93
ABSTRACT
From the theoretical and empirical points of view, quality of service and satisfaction have been identified as strong predictors of consumer behavioural intentions.
These dynamics have already been studied on the airline context, mainly in regular airlines and low-costs but investigations in the context of charter companies were not found. Thus, this study aims to explore the impact of service quality and satisfaction in behavioural intentions, considering passengers of a charter company. A survey was conducted during the period between 24 July and August 20, 2010. Consequently, we have collected 1283 questionnaires of long haul passengers and 4507 questionnaires of medium haul passengers.
According to literature review, service quality positively affects passenger behavioural intentions but satisfaction has the strongest effect in.
3 differentiate the firm from the competitors and as adjuvant factors to increase passengers favourable intentions to the company.
Keywords: service quality, satisfaction, consumer behavioural intentions, charter airline industry.
4 TABLE OF CONTENTS
CHAPTER 1. INTRODUCTION ... 9
1.1 STATE OF THE ART ... 9
1.2 THE RELEVANCE OF THE AIRLINE INDUSTRY CONTEXT ... 10
1.3 RESEARCH OBJECTIVES ... 11
1.4 STRUCTURE OF THE STUDY ... 11
CHAPTER 2. LITERATURE REVIEW ... 12
2.1 INTRODUCTION ... 12
2.2 SERVICE QUALITY: THE CONCEPT ... 12
2.3 SERVICE QUALITY: THE CONTEXT ... 12
2.4 MEASUREMENT OF SERVICE QUALITY ... 13
2.4.1 SERVQUAL MODEL ... 14
2.4.2 SERVPERF MODEL ... 14
2.4.3 IMPORTANCE OF DIMENSIONS IN SERVQUAL AND SERVPERF ... 14
2.4.4 QUALITY MEASUREMENT MODELS LIMITATIONS ... 14
2.5 SATISFACTION IN A SERVICE CONTEXT ... 15
2.5.1 SATISFACTION MEASUREMENT ... 16
2.6 CUSTOMER BEHAVIOURAL INTENTIONS ... 16
2.7 SERVICE QUALITY, SATISFACTION AND CONSUMER BEHAVIOURAL INTENTIONS ... 16
2.8 CONCLUSION ... 17
CHAPTER 3. RESEARCH OBJECTIVES AND HYPOTHESES ... 18
3.1 INTRODUCTION ... 18
5
3.3 AIRLINE SERVICE KEY DIMENSIONS IMPORTANCE ... 19
3.4 SERVICE QUALITY AND SATISFACTION ... 20
3.5 SERVICE QUALITY AND BEHAVIOURAL INTENTIONS ... 21
3.6 SATISFACTION AND BEHAVIOURAL INTENTIONS ... 21
CHAPTER 4 - METHODOLOGY ... 22
4.1 TYPE OF RESEARCH AND DESIGN ... 22
4.2 SAMPLING ... 22
4.3 SURVEY DEVELOPMENT ... 22
4.4 MEASUREMENT AND SCALING ... 22
4.5 VARIABLE’S ANALYSIS AND IMPROVEMENT ... 23
CHAPTER 5 – EMPYRICAL ANALYSIS OF DATA ... 25
5.1 SAMPLE CHARACTERIZATION ... 25
5.2 DESCRIPTIVE ANALYSIS ... 26
5.2.1 SERVICE QUALITY AND IMPORTANCE OF DIMENSIONS ... 26
5.3 ANALYSIS OF RELATIONSHIPS BETWEEN VARIABLES ... 28
CHAPTER 6: CONCLUSION ... 31
6.1 DISCUSSION ... 31
6.2 CONTRIBUTION OF THE STUDY ... 35
6.2.1 THEORETICAL CONTRIBUTIONS ... 35
6.2.2 MANAGERIAL IMPLICATIONS ... 35
6.3 LIMITATIONS AND FUTURE RESEARCH ... 36
REFERENCES ... 37
6 LIST OF TABLES
Table 2.1 – Examples of Definitions of Service Quality...14
Table 2.2 - Examples of Measurement Models of Service Quality... 15
Table 3.1- Summary of the variables under study... 21
Table 4.1 - Total Sample... 24
Table 4.2 - Factor Analysis applied to Service Quality... 25
Table 4.3 - Factor Analysis applied to Costumer Behavioural Intentions... 25
Table 4.4 - Principal Component Analysis applied to Service Quality... 26
Table 4.5 - Principal Component Analysis applied to Customer Behavioural Intentions... 27
Table 4.6 - Cronbach’s Coefficents Alphas... 27
Table 5.1 - Socio-Demographics sample characterization respecting total of passengers, medium haul passengers and long haul passengers ... 28
Table 5.2 - Service quality in a charter airline (means and standard deviations) to model dimensions considering the type of flight... 29
Table 5.3 - Rankings and Means of Importance between service quality dimensions depending on type of flight (total, medium haul and long haul)...29
Table 5.4 - Satisfaction Determinant Factors on Charter Airlines...30
Table 5.5 - Service Quality prediction on Customer Behavioural Intentions...32
Table 5.6- The impact of Satisfaction on Customer Behavioural Intentions...36
LIST OF FIGURES Figure 3.1 - Proposed Conceptual Model based on the frameworks of Zinc (2001), Park et al. (2006b), Saha and Theingi (2009)...20
LIST OF APPENDICES Appendix 1 : Self- Completion Questionnaire...41
Appendix 2 : Items and Scales...47
Appendix 3 : Descriptive Analysis based on Items...48
Appendix 4 : Correlation Analysis Table 1a Total Flights...49
Table 1b Long Haul...49
7 ACKNOWLEDGEMENTS
Firstly, I would like to thank all professors of the Master Program in Marketing who inspired me with new ideas, for all their devotion, developing in me the logic of things, debating new issues and developing expertise.
Also, my thanks go to my supervisor, Professor Doctor José Veríssimo, for encouraging me to start this research in the summer holidays 2010/2011, all his support. Many ideas and analysis were discussed and I am very grateful to him, mainly for enlightening me with his focused logic, schematic explanations and patience with my doubts.
I am also very thankful to Professor Rui Brites who was extremely kind and always ready to give me new ideas, suggestions and opening my mind to other possible directions.
My greatest thanks go to my mother, father and sister who are pillars in my life and understood my rarely appearances in Oporto. They gave me educational basis, confidence and willingness to learn more and more. A special word goes to my sister Mafalda who gave me an excellent support and motivation.
8 Important Quotes
“Every day, the airline industry propels the economic takeoff of our nation. It is the great enabler, knitting together all corners of the country, facilitating the movement of people and goods that is the backbone of economic growth. It also firmly embeds us in that awesome process of globalization that is defining the 21st century.”
Daniel Yergin, Pulitzer Prize (Summer 2005)
“The Wrights* created one of the greatest cultural forces since the development of writing, for their invention effectively became the World Wide Web of that era, bringing people, languages, ideas and values together. It also ushered in an age of globalization, as the world's flight paths became the superhighways of an emerging international economy. Those superhighways of the sky not only revolutionized international business; they also opened up isolated economies, carried the cause of democracy around the world and broke down every kind of political barrier. And they set travelers on a path that would eventually lead beyond Earth's atmosphere.”
Bill Gates, Microsoft Chairman (Time Magazine, March 29, 1999)
* ( Orville (August 19, 1871 – January 30, 1948) and Wilbur (April 16, 1867 – May 30, 1912), were two American brothers that developed the first effective airplane, and made the historic first airplane flight on 17 December 1903).
“Aviation is the glue that keeps the global economy together. Without widely accessible and well-priced air travel, the global economy will quickly become less global.”
Mark Zandi, Moody’s Economy.com chief economist, August 2008
"Aviation is the physical Internet — it lets people and products physically connect over long distances quickly... It enables the real connectivity. We're talking about what enables the world to be flat."
9
CHAPTER 1. INTRODUCTION
1.1 STATE OF THE ART
Service quality and consumer satisfaction and their effects on the formation of consumer’s behavioural intentions were topics which captured the attention of several authors (Parasuraman, Zeithaml and Berry, 1988, 1990; Bitner, 1990; Bolton and Drew, 1991 a, b; Cronin and Taylor, 1992; Jones and Suh, 2000 and Park, Robertson and Wu, 2006 a, b).
Firms, which constantly dedicate themselves to delivering value and quality, ensure profit and competitive advantage (Reichheld and Sasser, 1990 and Anderson et al., 1994). Airline industry is not an exception, as seen with Singapore Airline, awarded as best service airline and one of the most lucrative companies in the world. Therefore, at management level, it is crucial to assess how customers perceive quality (Parasuraman, Zeithaml and Berry, 1985, 1988 and Chang and Yeh, 2001) and to understand the distinguishable features that consumers use to differentiate between airline companies (Zeithaml et al., 1996; Chang and Yeh, 2001 and Solomon, 2011:351).
The evaluation of airline service quality urges, mainly due to uncontrollable airline quality determinants which are important to passengers, as passengers bad performance evaluations related to punctuality, affected by the weather in 70% of cases (Truit and Haynes, 1994). On the other hand, perceiving differences between airline seats, cabins or meals within the same route is difficult to passengers. For that reason, the main factors of differentiation among airline companies are the process of quality deliver on service encounter and the outcomes of all service quality dimensions which customers give value to within the context of airline industry (Parasuraman, Zeithaml and Berry, 1985, 1988; Chang and Yeh, 2001 and Park, Robertson and Wu, 2006 b).
10 Although the issue has been studied by several authors, the applicability to charter airlines as a specific context could not be found in the reviewed literature and it represents a new outcome as far as airline quality studies are concerned.
1.2 THE RELEVANCE OF THE AIRLINE INDUSTRY CONTEXT
The international airline industry provides service to virtually every corner of the globe and is a true adjuvant, determinant to global economy (Global Airline Industry Program,2011). According to Giovanni Bisignani, International Air Transport Association - IATA’s Director General and CEO, “since 1950 the world’s economy grew six fold, but word trade is 22 times bigger”; therefore the “global village” that airline industry helped to build is the engine of one of the largest sectors of economy success (Truit and Haynes, 1994).
Until 1978, the Airline Industry dealt with major technical innovation and airlines were heavily regulated throughout the world. Only after the US Airline Deregulation Act in 1978, profitability and competition became dominant (Tiernan et al., 2008). In the post deliberation period, “cash is the king” (Bisignani, 2009) and the need of cutting costs is mandatory, influencing service quality (Global Airline Industry Program, 2011). Also, the increase of labour costs and fuel price since 2001 led to the deterioration of labour/management relations, to aviation infrastructure constraints and to increased flight delays. These factors together with the increased congestion around large hubs also caused erosion in the quality of the service offered (Antoniou, 1998).
Analysing the specific charter context gains interest due to the “enigmatic ability” of charter airlines to sell seats at one-half or even one third of the price charged by scheduled airlines and still make a profit (Doganis, 1991). According to Giovanni Bisignani, International Air Transport Association’s (IATA) Director General and CEO, the only survivors of this “unprecedent and the most difficult ever time” will be the airlines that “are paranoid about cutting operating costs and conserving cash in order to run profitable operations” (Murali, 2009).
11 1.3 RESEARCH OBJECTIVES
In light of the previous considerations, this project aims to explore the impact of service quality and satisfaction on passenger behavioural intentions in charter airlines.
So, generally the objectives are:
To identify key items and dimensions considered in airline service quality evaluation, regarding charter context.
To evaluate the impact of service quality in satisfaction.
To determine the relation between service quality and passenger behavioural intentions.
To determine the impact of satisfaction on passenger behavioural intentions.
1.4 STRUCTURE OF THE STUDY
The dissertation will be divided in six chapters: 1. Introduction; 2. Literature Review; 3. Theoretical Model; 4. Methodology; 5. Results; and 6. Conclusion.
Chapter one provides a general view of this study, illustrating the importance of the framework and theme, the focus of the research and its objectives.
Literature Review will focus on the analysis of the underlying concepts concerning theories and previous studies found in scientific literature relating to the areas of interest.
On the third chapter, the structural model will be defined as well as the conceptual framework that establishes the hypotheses to be tested.
Along the fourth chapter, the research methodology is described, explaining the type of investigation, the dimensions considered, sample, instruments and data collection.
On the fifth chapter, the sample is going to be characterized and the hypotheses will be tested, through means comparison and multiple linear regression.
12
CHAPTER 2. LITERATURE REVIEW
2.1 INTRODUCTION
In order to meet the objectives of this investigation, it is our intention to reflect upon some concepts that are interconnected with service quality, satisfaction, airline industry, and factors that influence customer behavioural intentions, taking into account the literature on the topic.
2.2 SERVICE QUALITY: THE CONCEPT
Quality has been defined in different ways by several authors (Table 2.1). It is interesting to notice that all definitions take into account the customer’s point of view.
Table 2.1- Examples of definitions of Service Quality
Definition Author(s)/Date
Service quality is a comparative function between customer’s
expectations and actual performance.
Parasuraman, Zeithaml and Berry (1985)
Service quality is composed by three components: the technical one, the functional one, and the reputational, based on the corporate image.
Grooroos (1982)
Perceived quality service is evaluated by the actual performance of service in terms of particular service attributes in the specific
context, the “attribute experience”.
Oliver (1993)
Service quality should be conceptualized and measured as an attitude and performance based scale is the best way to measure it.
Cronin and Taylor (1992)
A customer’s assessment of overall service quality is directly
affected by the perception of performance levels.
Bolton and Drew (1991 b)
Thus, service quality can be defined as the customers’ evaluation of service performance attributes, based on personal perceptions, emotional aspects, or simply as a product of the difference between wants and outcomes. This entire process affects every aspects of the world and differs all the time.
2.3 SERVICE QUALITY: THE CONTEXT
13 In a service encounter, the client and the contact person interact involving a delivery of value in which production and consumption is inseparable (Carman and Langeard, 1980; Parasuraman, Zeithaml and Berry, 1985; and Grönroos, 2006). If we happen to associate this fact with the heterogeneity of the people involved, the difficulty increases. The major risk is that what the firms intend to deliver may be different from what the consumers receive and the key challenge is to guarantee the consistency of staff performance (Carman and Langeard, 1980; Booms and Bitner, 1981; and Parasuraman, Zeithaml and Berry, 1985). Bearing in mind the type of value delivered in a service encounter that cannot be counted, measured, inventoried, tested and verified in advance of sale it is obvious that the task of measuring quality is arduous. Furthermore, due to this mentioned intangibility, firms find it difficult to understand how consumers evaluate service quality.
2.4 MEASUREMENT OF SERVICE QUALITY
In the literature, there are several proposals to measure service quality, from which we have selected the ones that math our research theme the most (Table 2.2).
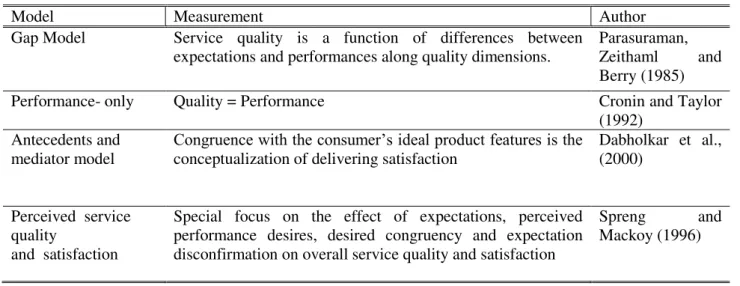
Table 2.2 – Examples of Measurement Models of Service Quality
Model Measurement Author
Gap Model Service quality is a function of differences between expectations and performances along quality dimensions.
Parasuraman, Zeithaml and Berry (1985)
Performance- only Quality = Performance Cronin and Taylor
(1992) Antecedents and
mediator model Congruence with the consumer’s ideal product features is the conceptualization of delivering satisfaction
Dabholkar et al., (2000)
Perceived service quality
and satisfaction
Special focus on the effect of expectations, perceived performance desires, desired congruency and expectation disconfirmation on overall service quality and satisfaction
Spreng and Mackoy (1996)
Source : Seht et al. (2005, p. 915-927)
Therefore, all contributions seem to agree that customers and producers may view quality differently but the main effort is on management. Managers should be aware of what customers want to receive.
14 2.4.1 SERVQUAL MODEL
Parasuraman et al. (1985) have proposed one of the first models to analyse service quality dimensions, helping firms to manage quality (Tiernan et al, 2008). Servqual is a measure of
service quality based on the difference between performances and expectations related to ten components of service quality (D1: reliability; D2: responsiveness; D3: competence; D4: access; D5: courtesy; D6: communication; D7: credibility; D8: security; D9: knowing the customers; D10: tangibles). Parasuraman, Zeithaml and Berry (1988) refined this scale, obtaining only five dimensions out of ten, with twenty-two items spread among five dimensions. They maintained D1, D2, D10, joined D4 and D9, coupled together D5 e D6 and excluded D3, D7 e D8
2.4.2 SERVPERF MODEL
Cronin and Taylor (1992) developed Servperf, originally proposed by Grönroos (1990), a
performance based scale that focuses on conceptualizing and measuring quality as an attitude, a perception of performance.
In their empirical work, Cronin and Taylor (1992) considered the twenty-two items defined by Parasuraman et al. (1988) to assess performance. The results of their study show that unweighted Servperf (service quality = performance) scale is the best model to capture more of the variation in
service quality.
2.4.3 IMPORTANCE OF DIMENSIONS IN SERVQUAL AND SERVPERF
Both Parasuraman, Zeithaml and Berry (1985, 1988) and Cronin and Taylor (1992) focus the quality measurement as indivisible of ideals or perceptions of excellence based on the importance of the attribute level (Oliva, Oliver and MacMillan, 1992). According to Carman (1990), there are two types of perceptions of excellence. The pre- purchase ones which could be described as the aspects of the service that customers defined as important indicators of quality; and post- purchase ones, far more knowledgeable, assessing quality clearly and possibly in a different way.
2.4.4 QUALITY MEASUREMENT MODELS LIMITATIONS
Both models, Servqual and Servperf, were analysed in respect to limitations and afterwards we
choose the one that had the fewer constraints.
Although most authors recognize the value of Servqual in service quality measurement, several
critics were put forward in literature review relating to theoretical and operational limitations of the model. Even though Cronin and Taylor (1992), Teas (1993), Butler (1996), and Seht et al, (2005) have presented a series of limitations, it is our intention to focus solely on the ones relevant to this study. The theoretical limitations relevant to this study are firstly Servqual process
15 five dimensions used are not universal. At the operational level, the most pertinent limitations are the polysemy of expectations and the incapacity of the five items to capture the variability within each service quality dimension. Carman (1990) added questions of face validity as some empirical evidences suggested that a cross sectional analysis does not confirm the consistency of employed measurement procedures.
In opposition to the previous amount of Servqual disadvantages, there are few limitations as far
the Servperf model is concerned. According to Seht et al. (2005, pg. 935), Servperf has two
limitations only, “the need to be generalized for all types of service settings and a quantitative relation between service quality and satisfaction need to be established”. Thus, we have adopted
Servperf model.
2.5 SATISFACTION IN A SERVICE CONTEXT
According to Jones and Suh (2000), the importance of satisfaction is recognized since 1970. As far as satisfaction is concerned, three main subjects are discussed in literature: the distinction between transaction specific and overall satisfaction; the role of customers in satisfaction evaluation; and the interaction between these two concepts and attitude, expectations and disconfirmation (Parasuraman et al. 1988; Bitner, 1990; Bolton and Drew, 1991a). Only the first is actually relevant to this study since the voice of customer is intrinsic to this investigation.
The concept of satisfaction combines the idea of evaluation and judgment (Söderlund, 2003 a), the comparison between desires and outcomes versus rewards and costs (Oliver, 1981) and depends upon the improving of attributes and dimensions which present the largest gap between expectations and performance (Oliver, 1980 and Cronin and Taylor, 1992). Within the scope of this definition, two points of view can be drawn: the transactional and the overall one.
16 2.5.1 SATISFACTION MEASUREMENT
Several researchers prefer an overall summary measure of satisfaction, whereas others argue that it should be measured as a combination of attributes (Churchill and Iacobucci, 2002). However, in the case of applying a single item to overall satisfaction measurement, it should be preceded by the “evaluation of multiple statements based on customer own merits” (Churchill and Iacobucci, 2002: 376). Oliver (1981) refers that multipoint satisfaction scales does not reflect true satisfaction because the surprise effect has just occurred and it did not have time to decay.
According to Oliver (1981b) and Söderlund (2003b), Likert and semantical differential scales are the most reliable ones in order to measure satisfaction, however while Söderlund (2003b) includes like /dislike (attitudinal evaluation) to evaluate attitude and overall satisfaction, Oliver (1981) refers that such scales are unique to satisfaction at emotional level not adequate to attitude scaling.
2.6 CUSTOMER BEHAVIOURAL INTENTIONS
Consumer behaviour study is one of the main marketing disciplines and must assume an essential role in a firm’s strategy to best reach and gain customers. Wells and Prensky (1996) show a broader definition, denying that consumer behaviour involves mostly purchases including: “Browsing, influencing others, using the product, returning the product or complaining, if necessary, disposing of the product, reading magazines and watching television, and many other activities.”
This broad definition focuses mainly on post-purchase activities, which can be favourable and unfavourable. Favourable customer’s intentions include “influencing others”, word of mouth – WOM; “using the product”, assuming repurchase intention, also pointed out by several researchers as Boulding et al. (1993); Zeithaml et al. (1996); Söderlund (1998) ; Ozdemir and Hewett (2010); and “reading magazines and watching television”, since customer interest in the brand can develop a future opinion leader. According to Fisk et al. (1990), Zeithaml et al. (1996) and Slater and Narver (2000) when customers adopt favourable intentions due to the delivery of superior customer value, they are contributing to firm financial success. Unfavourable behavioural intentions, as “complaining” or “returning the product” are the worst scenario for a firm (Slater and Narver, 2000).
2.7 SERVICE QUALITY, SATISFACTION AND CONSUMER BEHAVIOURAL
INTENTIONS
17 Service quality and satisfaction are always connected and his power of interaction is in doubtful. (Bitner, 1990; Bolton and Drew, 1991 a); Parasuraman et al., 1988). It depends on the way authors assess both concepts, in the short attribute level or the long term overall level. However, quality judgments influence positively satisfaction in an asymmetric way (Parasuraman et al., 1991). Oliva and Oliver (1995) states that when performance is poor, greater improvement is needed to get satisfaction; when in midrange levels of service quality provide proportionally great increase on satisfaction and, above average performance, improvements do not impact on comparable increases in satisfaction.
There are several authors in literature who found a positive association between service quality and consumer behavioural intentions (Parasuraman et al., 1988; Cronin and Taylor, 1992; Boulding et al., 1993; and Zeithaml et al., 1996).
Moreover, satisfaction plays an important role in predicting customer behavioural intentions, both to repurchase and to recommend. According to Hart et al. (1990), satisfied customers inform six people about their good experiences, while dissatisfied inform eleven. In Oliver’s (1980) study, dissatisfaction is presented in three stages: initial irritation, unpleasantness and relief in the after-effect stage and WOM after-effect arises between the second and the third. Only a positive link between satisfaction and loyalty appears to be dominant however the way in which it is done is not consensual (La Barbera and Mazursky, 1983; Zins, 2001 and Pham and Simpson, 2006). Jones and Sasser (1995) classify the relationship as simple and linear however, according to Fisk et al. (1990) and Oliva, Oliver and MacMillen (1992), customer involvement plays an essential role upon the linearity of the relation and the turning point satisfaction/ dissatisfaction is changeable (see also Bitner, 1990; Bolton and Drew, 1991b; and Oliver, 1980).
The satisfaction conceptualization adopted in this study will be the overall one taking into account Jones and Suh (2000) and Jones and Sasser (1995) to whom aggregate satisfaction is a better predictor of behavioural intentions than the transaction specific one.
2.8 CONCLUSION
Service quality assumes an extreme importance to customers. The multi-dimensionality of airline industry requires a service quality evaluation based customer’s perception of service attributes. Given the fewer limitations, Servperf was the quality model chosen. On the other hand,
18
CHAPTER 3. RESEARCH OBJECTIVES AND HYPOTHESES
3.1 INTRODUCTION
The main purposes of this chapter are presenting in detail the theoretical research model, which founded this study, based on the theoretical frameworks described in the previous chapter. Also, the main constructs of the model and their linkages are revisited from a theoretical point of view, establishing the support for the hypotheses raised.
3.2 RESEARCH OBJECTIVES AND PROPOSED CONCEPTUAL MODEL
This project aims to answer the central question of this investigation: What is the true influence of service quality and satisfaction on passenger behavioural intentions in charter airlines?
Our main objectives are:
1) To identify key items and dimensions considered in airline service quality evaluation; 2) To evaluate the impact of service quality in satisfaction;
3) To determine the relation between service quality and passenger behavioural intentions; 4) To determine the impact of satisfaction on passenger behavioural intentions;
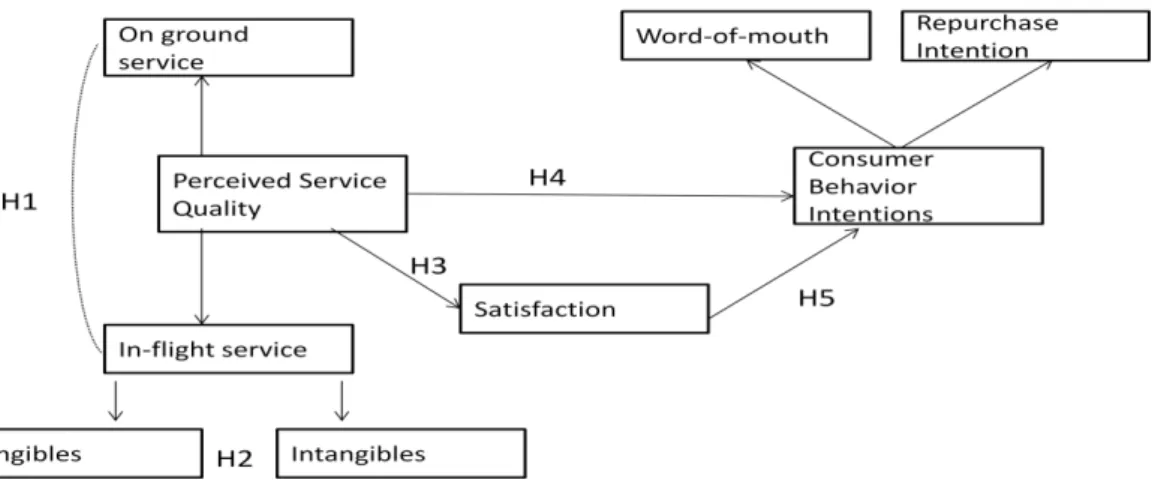
Based on the problem statement and the subsequent research objectives, it is proposed the conceptual model in figure 3.1. This model is based on the most relevant theorectical frameworks of airline service quality, satisfaction and customer behaviour intentions (Zins, 2001; Park et al., 2006b; and Saha and Theingi, 2009).
Figure 3.1 Proposed Conceptual Model based on the frameworks of Zins (2001), Park et al. (2006b)
and Saha and Theingi (2009)
19 Table 3.1 Summary of the variables under study
Dependent Variable : Consumer Behavioural Intention
The consumer’s behaviour is a latent variable composed by two items: word of mouth and repurchase
intention (Boulding et al., 1993; Zeithaml et al., 1996; Söderlund, 1998 and Ozdemir and Hewett, 2010). However, after proving internal consistency, this variable will be analysed as one-dimensional.
According to this conceptual model there is to be assessed a potential linkage between: Key dimensions of airline service and perceptions of importance
o On-ground service and in-flight service o Tangibles and Intangibles
Service Quality and Satisfaction
Service Quality and Consumer Behavioural Intentions Satisfaction and Consumer Behavioural Intentions
3.3 AIRLINE SERVICE KEY DIMENSIONS IMPORTANCE
Identifying the relatively more important service dimensions for customers is important, since the greater the importance of dimension, the smaller the customer tolerance to faults (Zeithaml and Bitner, 1996). Each industry requires specific dimensions measured accordingly (Brady and
Independent
Variables Literature Review
Tangibles Adapted from Young, Cunningham and Lee (1994) that used the quality of Food and Beverage service and the chairs comfort (pitch and size); Wen and Yeh (2010) suggest that the entertainment and the cleanness of the cabin should be equally considered. To Mustafa et al. (2005), tangible encompasses onboard catering; comfort and cleanness of seat; onboard entertainment; and onboard reading material.
Intangibles Adapted from Parasuraman et al (1985, 1988), Gilbert and Wong (2003), Park, Robertson and Wu (2006a) and Saha and Theingi (2009). Empathy, being responsible and guarantee are dimensions presented in Servqual; yet we have considered just a few items: pro activity; sympathy; knowledge; individual attention; follow up and pleasant reception, all referring to the aircrew.
On-Ground Service Adapted from Aksoy et al. (2003); Park et al. (2006b); and Chen and Chang (2005). On-ground service is measured using convenience items on the process of reservation and ticketing (excluded due to charter package differentiation) and the quality of the service in the check-in counter.
Overall Satisfaction
20 Cronin Jr, 2001), so dimensions chosen are based on literature review of the specific area of airline service.
Airline service includes multiple service quality dimensions of core service - transportation, of facilitating service – check-in procedures and of supporting services in-flight meals (Bolton and Drew, 1991b). Park et al. (2006a) concluded that reservation; ticketing and airport services dimensions are insignificant to satisfaction. Zins (2001), Park et al. (2006 a) and An and Noh (2009) highlighted the importance of in-flight dimensions and their power to frustrate or appease customers. As Anderson and Sullivan (1993) put it, the importance of service dimensions is of great influence on satisfaction and other consumer behavioural aspects. Thus, we associate the empirical basis to theoretical assumptions and we formulate the first hypothesis of this study:
Hypothesis 1 - Charter airline passengers view in-flight service as more important than on-ground service.
Quality associated with human interaction on-board is capable of positively or negatively influencing the attitudes and the behavioural intentions of passengers, both directly (Zins, 2001) and indirectly (Park et al., 2006a). According to Zins (2001), Park et al. (2006 a) and An and Noh (2009), in-flight meals are very important since they require more time spent interacting directly with the customer. Brady and Cronin Jr. (2001) also explain the staff potential to either frustrate or appease passengers and in the specific context of airlines, Gilbert and Wong (2003) determined that holidaymakers have higher expectations concerning individual attention and helpful airline crew who deliver prompt service. In a similar way, Zins (2001) has concluded that intangibles play a more important role in the prediction of customer satisfaction and loyalty than tangibles. Therefore, it is expected that:
Hypothesis 2 - Charter passengers give more importance to intangibles than tangible aspects of in-flight service.
3.4 SERVICE QUALITY AND SATISFACTION
From theoretical point of view, service quality positively influences customers’ satisfaction and this influence is verified also in empirical airline service studies (Zins, 2001; Park et al, 2006 a,b; and Saha and Theingi, 2009). Nevertheless, “[e]very time there are more plains in the sky and more people flying, airline performance suffers.” (Headley, 2010)
21 satisfaction are on-board service and employee service. Staff ability, was highlighted by Brady and Cronin Jr. (2001) and by Zins (2001) about its predictive power in creating emotional responses in customers and satisfying them. Thus, we come up with the third hypothesis:
Hypothesis 3 - Service quality positively influences passenger’s satisfaction.
3.5 SERVICE QUALITY AND BEHAVIOURAL INTENTIONS
According to several authors, service quality influences behavioural intentions simply through satisfaction (Andersen and Sullivan, 1993). In airline industry context, Park et al. (2006 a,b) also found a positive influence of service quality in repurchase intentions and intention to recommend the airline to others, indirectly by means of satisfaction.
However, quite a few studies found a direct link between service quality and customer behavioural intentions (Cronin and Taylor, 1992; Zeithaml et al., 1996) and effective behaviour (Parasuraman et al., 1988). Boulding et al. (1993) stated a positive correlation between service quality and willingness to recommend, repurchase intentions and saying positive things about the firm. In the airline environment, Zins (2001) has found a direct relationship between these two constructs. In sum, it is expected that:
Hypothesis 4: Service quality positively influences passenger’s behavioural intentions.
3.6 SATISFACTION AND BEHAVIOURAL INTENTIONS
To La Barbera and Mazursky (1983), Anderson and Sullivan (1993), Jones and Sasser (1995) and Bloemer, Ruyter and Peeters ( 1998) customer satisfaction plays a supreme role in predicting customer behaviour intentions. The customer has a central role in the power of this relationship since they interact with service outcomes and their own experience is fulcral in both evaluations of satisfaction and future intentions. Both in the Australian context (Park et al., 2006b) and in Thailand low cost airlines (Saha and Theingi, 2009), passenger satisfaction was found to influence directly passenger future behavioural intentions. In light of the previous arguments, it is suggested that:
22
CHAPTER 4 - METHODOLOGY
4.1 TYPE OF RESEARCH AND DESIGN
This study will focus on empirical research, by expanding previous studies presented in literature review, and by applying existing hypotheses to new situations (air charter industry) and new hypotheses deducted from the conclusions of literature review ( Hill e Hill, 2000).
The research will be quantitative so, the focus is on numerical selection and statistical analyses of the results. Consequently, the selected instrument of collection will be a structured questionnaire and the program Statistic Package for Social Sciences- SPSS will be used for the data analyses.
4.2 SAMPLING
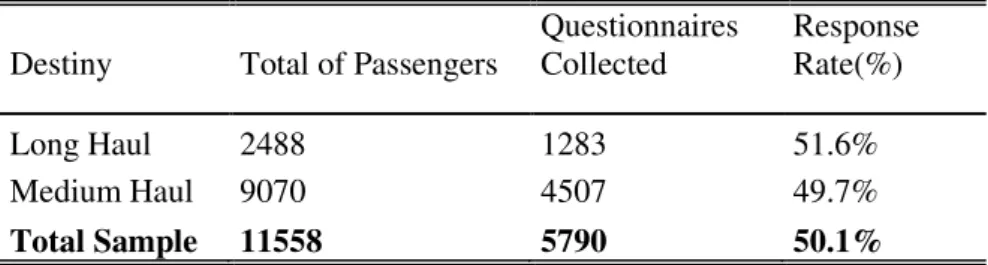
For the scope of this study, a convenience sample of 11558 passengers travelling White airlines was asked to participate both when leaving the country of origin as well as one week later, in the countries’ destination airports. The total sample size is 5790 and the rate of response is 50.1% (table 4.1). The study was conducted in distinct flight routes from 24th July to 20th August, 2010.
Table 4.1 Total Sample
Destiny Total of Passengers
Questionnaires Collected
Response Rate(%)
Long Haul 2488 1283 51.6%
Medium Haul 9070 4507 49.7%
Total Sample 11558 5790 50.1%
4.3 SURVEY DEVELOPMENT
A self-completion questionnaire (Appendix 1) has been developed since we have considered it the most effective method to obtain information about attitudes based on perceptions of service features (Aaker et al, 2004). The questionnaire has closed and multichotomous questions, requiring inquirers to condense their complex perceptions into a single statement (Churchill and Iacobucci, 2002).
4.4 MEASUREMENT AND SCALING
23 scales of measurement, we will be using only three: nominal, ordinal and interval (Malhotra and Birks, 2006).
The scales and items used were based on literature review and the most important for our study are showed in appendix (Appendix 2).
4.5 VARIABLE’S ANALYSIS AND IMPROVEMENT
This sub-chapter is aimed at exhibiting the previous analyses and the variables that were changed based on the literature review.
Exploratory Factor Analysis and Principal Components Analysis
Factor Analysis was used in order to reduce service quality dimensions (table 4.2) and behavioural intentions ( table 4.3). Full data will be used but we will not distinguish between long and medium haul as we intend to find the important factors in a group of variables. It is, thus, fundamental to have the largest sample possible, as a way of guaranteeing that, in further analysis, the factors remain the same (Pestana and Gageiro, 2003).
Indeed, Principal Component Analysis is adequate to demanding variable correlations, which in turn can be measured through statistics Kayser-Meyer-Olkin (KMO)1. In this study, service quality variables are highly correlated KMO= 0,946 and behavioural intentions variables show a mediocre correlation between pairs of variables. However, Word-of-Mouth and Intention to Repurchase are highly correlated (0,905). Thus, Principal Component Analysis is justified.
Table 4.2 – Factor Analysis applied to Service Quality
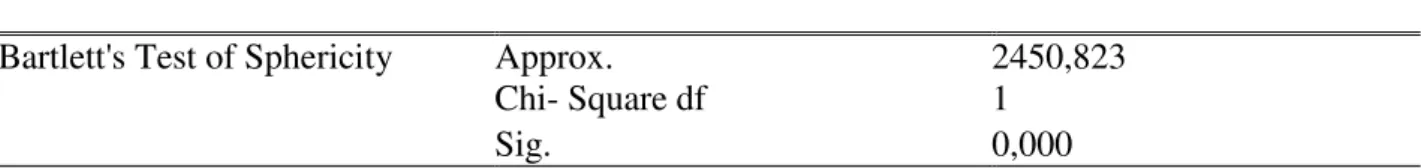
Table 4.3 – Factor Analysis applied to Costumer Behavioural Intentions
1 KMO goes from 0 to 1, should be greater than 0,7, and is inadequate if less than 0,5.
Kaiser-Meyer-Olkin 0.946
Bartlett's Test of Sphericity Approx. Chi- Square df
40079,940 105
Sig. 0,000
Kaiser-Meyer-Olkin 0.500
Bartlett's Test of Sphericity Approx. Chi- Square df
2450,823 1
24
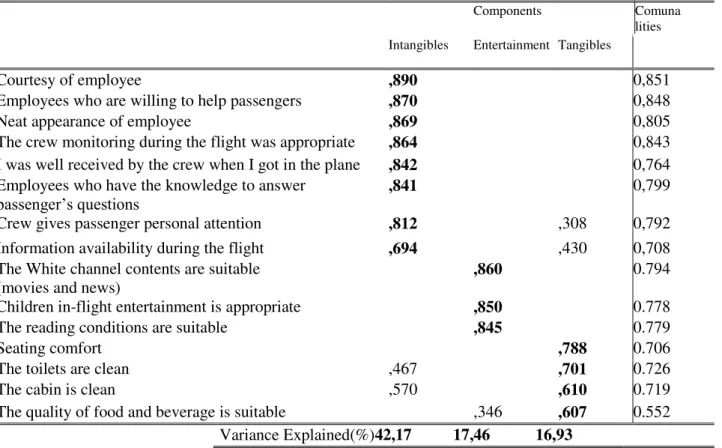
Principal Component Analysis
Principal Component Analysis was based on a collection of in-flight service quality items extracted from literature review. After analysing the first Principal Component Analysis, at
communalities table, we realized that the percentage of service quality variables common variance
in the extracted factors is higher than 50% in all variables, except for the amount of food and beverage. Comparing both principal analyses of components (with and without this item), we
decided to remove it in order to be in accordance with literature review.
On the other hand, we have concluded that if two components are extracted, the explained variance would be of 59,63%. After verifying that there is a third component near to 1 (0.914), which increases the explained variance by 16,93%, we have decided to extract it. With this, we drawn up three components that generate the following factors: Index of Intangibles, Index of Tangibles and Index of Entertainment, all referred to in-flight service quality.
At customer behaviour level, a single index was created, Customer Behavioural Intentions, which showed a variance of 96.65%, explained by the intention to recommend and the intention to repurchase. Table 4.5 and Table 4.5 analyse the indices obtained from Analysis of Principal Components using the Varimax method.
Table 4.4 –Principal Component Analysis applied to Service Quality
Components Comuna
lities Intangibles Entertainment Tangibles
Courtesy of employee ,890 0,851
Employees who are willing to help passengers ,870 0,848
Neat appearance of employee ,869 0,805
The crew monitoring during the flight was appropriate ,864 0,843
I was well received by the crew when I got in the plane ,842 0,764
Employees who have the knowledge to answer
passenger’s questions ,841 0,799
Crew gives passenger personal attention ,812 ,308 0,792
Information availability during the flight ,694 ,430 0,708
The White channel contents are suitable
(movies and news) ,860
0.794
Children in-flight entertainment is appropriate ,850 0.778
The reading conditions are suitable ,845 0.779
Seating comfort ,788 0.706
The toilets are clean ,467 ,701 0.726
The cabin is clean ,570 ,610 0.719
The quality of food and beverage is suitable ,346 ,607 0.552
25 Table 4.5 Principal Component Analysis applied to Customer Behavioural Intentions
Component:Consumer Behavior Intentions
Word of mouth 0,983
Intention to Repurchase 0,983
Variance Explained (%) 96,647
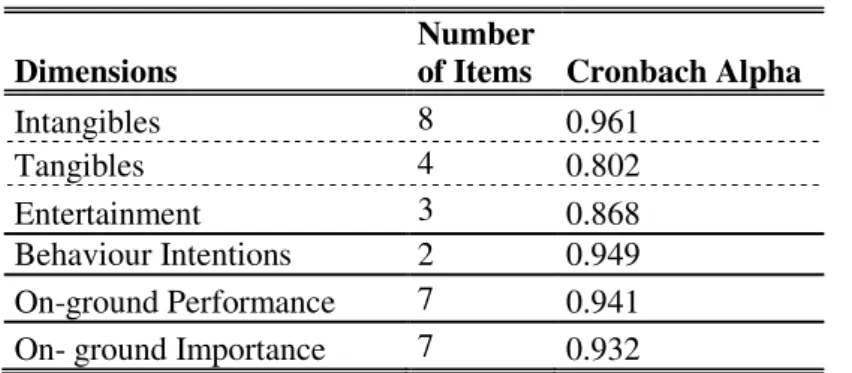
Reliability Analysis: Cronbach’s Coefficient Alpha
The most commonly used type of internal consistency reliability is the Cronbach’s Coefficient Alpha2. It indicates the consistency of a multiple item scale, typically used with Likert type items that are summed to make a summated scale. Thus, Cronbach Alpha was used to assess internal consistency of all items used in future analysis (table 4.6).
Table 4.6 Cronbach’s Coefficents Alphas
Dimensions
Number
of Items Cronbach Alpha
Intangibles 8 0.961
Tangibles 4 0.802
Entertainment 3 0.868
Behaviour Intentions 2 0.949
On-ground Performance 7 0.941
On- ground Importance 7 0.932
In table 4.6, it is possible to check that the internal consistency of each item is higher than 0.7, which implies that the reliability of the measure is very high. It is important to highlight the reliability of Customer Behavioural Intention Index (0,949).
CHAPTER 5
–
EMPYRICAL ANALYSIS OF DATA
5.1 SAMPLE CHARACTERIZATION
The profile of White passengers (table 5.1) is made up of 55,5% women and 44,5% men in both routes. The majority of people are between the ages of 20 and 39 years old (49,3%). The eldest generation (> 59 years old) is the one that travels the least in charter airlines, independently of the route. The largest part of inquirers are employees (46,6%) or self-employed (17,6%). The
2 Cronbach Alpha varies between 0 and 1 and should be greater than 0,7 to be reasonable, it is good if between 0,8 and
26 percentage of retired inquirers can be regarded as low (4,6%). As far as socio-demographics is
concerned, there is not a consistent difference between routes.
Table 5.1 Socio-Demographics sample characterization respecting total of passengers, medium haul passengers and long haul passengers
Total Medium Haul Long Haul
Dimension Item N % N % N %
GENDER Male 2204 44.5 1690 43.8 514 46.9
Female 2746 55.5 2165 56.2 581 53.1
AGE
<20 444 7.8 359 8.1 85 6.7
20-39 2820 49.3 2142 48.2 678 53.3
40 to 59 2076 36.3 1628 36.7 448 35.2
>59 375 6.6 313 7.0 62 4.9
EMPL
O
Y
MEN
T
ST
A
TU
S
Self-employed 1004 17.6 738 16.8 266 21.2
Employee 2626 46.6 2050 46.8 576 46.0
Collaboration with State 784 13.9 627 14.3 157 12.5
Housewife/Husband 84 1.5 67 1.5 17 1.4
Student 663 11.8 518 11.8 145 11.6
Unemployed 79 1.4 62 1.4 17 1.4
Retired 261 4.6 224 5.1 37 3.0
Others 135 2.4 97 2.2 38 3.0
5.2 DESCRIPTIVE ANALYSIS
5.2.1 SERVICE QUALITY AND IMPORTANCE OF DIMENSIONS
In this section, we will present the descriptive analysis of relevant data to answer the central objectives here. In terms of service quality, both on-ground and in-flight will be analysed. Based on the result of principal component analysis, we concluded that in-flight service quality could be considered as a multi-dimensional construct consisting of three dimensions. For each dimension of on-ground service and in-flight service we have calculated a global index after summing up and averaging the scores obtained, both in terms of performance and importance. The reliability of these indexes was tested through Cronbach alpha coefficients. Thus, in table 5.2 the results for
means and standard deviation of each dimension are presented, as well as the importance ranking of all variables in table 5.3, both in general terms and also considering the type of route.
27 reading conditions include, in both classes, journals and magazines and on-board magazines. A music selection is also offered to adults and children. In medium haul, entertainment is restricted to a movie and the on-board magazine (over three-hour flights) and in less than three-hour flights entertainment is synonym of the on-board magazine.
Table 5.2 Service quality in a charter airline (means and standard deviations) to model dimensions
considering the type of flight
SERVICE
QUALITY Num
ber
o
f
Item
s
Total of flights Medium Haul Flights Long Haul Flights
N Mean Stan
dar d Dev iatio n R an kin g
N Mean Stan
dar d dev iatio n R an kin g
N Mean Stan
d. Dev iatio n R an kin g
Intangibles 8 4891 6.14 0.94 1 3717 6.11 0.96 1 1174 6.21 0.90 1
Tangibles 4 4262 5.46 1.11 3 3102 5.56 1.07 3 1160 5.22 1.19 4 Entertainment 3 3629 4.27 1.69 5 2694 4.00 1.72 5 935 5.04 1.33 5 IN-FLIGHT 15 2980 5.30 1.05 4 2145 5.22 1.06 4 835 5.5 0.98 3 ON- GROUND 7 5217 5.62 1.23 2 4027 5.64 1.22 2 1190 5.57 1.25 2
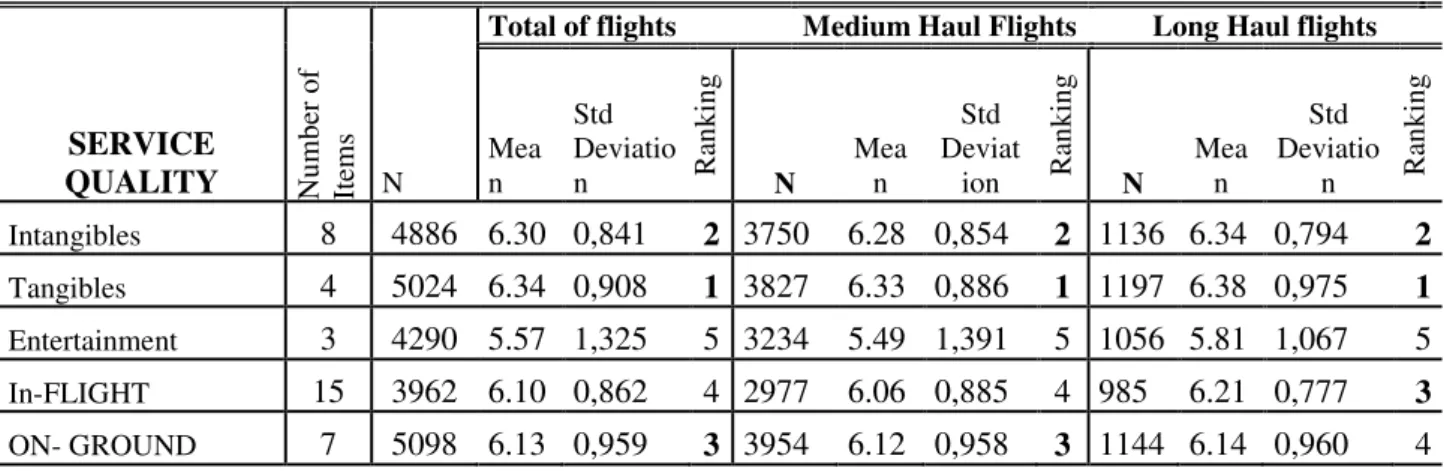
Table 5.3 Rankings and Means of Importance between service quality dimensions depending on
type of flight (total, medium haul and long haul)
SERVICE
QUALITY Num
ber
o
f
Item
s
Total of flights Medium Haul Flights Long Haul flights
N Mean Std Deviatio
n R
an kin g N Mea n Std Deviat
ion R
an kin g N Mea n Std Deviatio
n R
an
kin
g
Intangibles 8 4886 6.30 0,841 2 3750 6.28 0,854 2 1136 6.34 0,794 2
Tangibles 4 5024 6.34 0,908 1 3827 6.33 0,886 1 1197 6.38 0,975 1
Entertainment 3 4290 5.57 1,325 5 3234 5.49 1,391 5 1056 5.81 1,067 5 In-FLIGHT 15 3962 6.10 0,862 4 2977 6.06 0,885 4 985 6.21 0,777 3
ON- GROUND 7 5098 6.13 0,959 3 3954 6.12 0,958 3 1144 6.14 0,960 4
The hypothesis 1 replicates the highest importance of in-flight service when compared to on-ground service which is only true in long haul flights, being rejected in medium haul flights.
For more specific conclusions an analysis at items level was carried out (Vide appendix 3). From
this analysis, we concluded that still the hypothesis 1 is rejected, the more important items pertain to in-flight dimension and were: Cleanliness of toilets in medium haul (6,45); knowledge to answer in-flight passengers questions in long haul (6,46). The more important item of on-ground
service was Knowledge to answer passenger questions at check-in (6,34) in long haul, and in
medium haul (6,26) . Considering both in-flight and on-ground, the least important items were:
28 in medium haul (5,38); Children in-flight entertainment in long haul (5,72). So, if it is true that the
highest means of importance are related to in-flight service, largely because of intangibles, it is also true that the least important items relate to in-flight service mainly due to the entertainment dimension.
Considering in-flight service, the second hypothesis evaluates the higher importance of intangibles when compared with tangibles. However, as it is possible to see in table 5.4, charter passengers believe tangibles are the most important dimension of service (6.34) followed by intangibles (6.30), independently of the route. An interesting aspect is that intangibles have twice the number of items comparing to tangibles so that a global positive evaluation requires a standardized performance in all items pertaining to intangible dimension, or a good sense of balance between different performances, since we are working on means. At items level, Items with the highest score of importance were Cleanliness of toilets for long haul (6,52) and medium haul (6,45)
considering tangibles; Employees who have knowledge to answer passengers questions in long
haul (6,46) and medium haul (6,38) considering intangibles. Thus, hypothesis 2 is rejected.
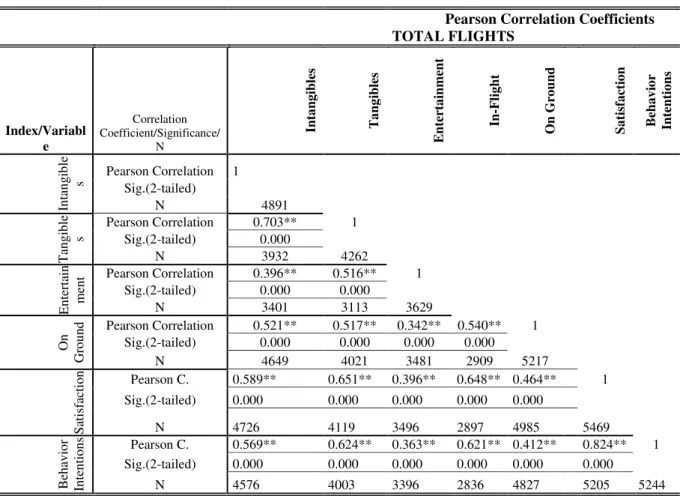
5.3 ANALYSIS OF RELATIONSHIPS BETWEEN VARIABLES
Correlation Analysis
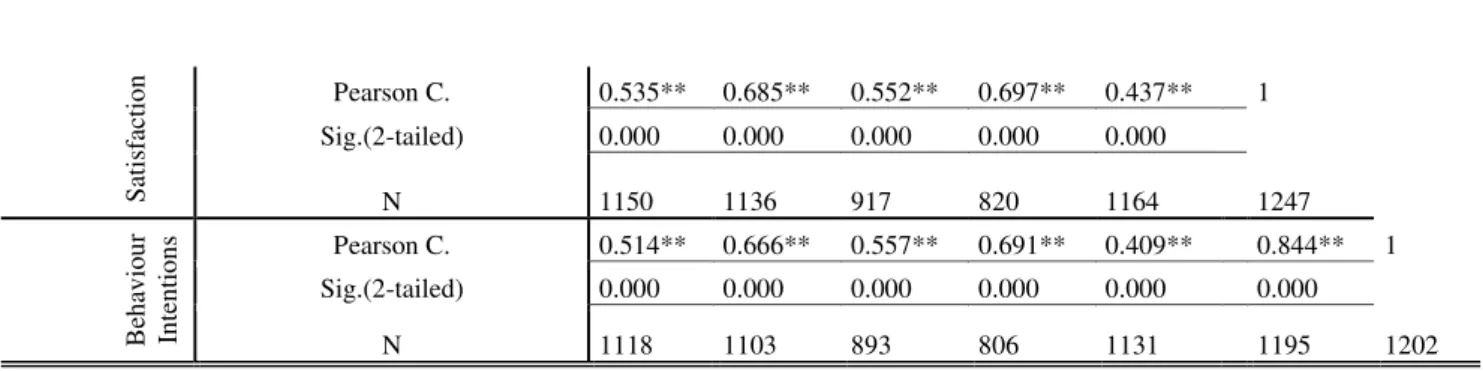
The relationships between service quality (with the three dimensions as concluded in principal component analysis), satisfaction and customer behavioural intentions (both assessed as a one-dimensional variables) for both routes and total sample was investigated using Pearson correlation coefficient (vide appendix 4, tables 1a, 1b and 1c).
Firstly, the array of correlation indicates a significant positive correlation between the tangibles, intangibles, entertainment and on-ground regarding both Satisfaction and Behavioural Intentions. Secondly, we found a high significant correlation between Satisfaction and Behavioural Intentions (r=0,844, n =1195, p<0,01).3
Multiple Linear Regression
The second objective intends to verify whether the service quality provided by a charter company is, or is not, a predictor factor of Satisfaction (table 5.4). The third objective investigates the same independent variable and its effect on Consumer Behavioural Intentions (table 5.5).
29 Table 5.4 Satisfaction Determinant factors on charter airlines
Model
Unstandardized Coefficients
Standardized Coefficients
t Sig.
Collinearity Statistics
B Std. Error Beta Tolerance
Total (Constant) ,674 ,105 6,433 ,000
Medium Haul ,612 ,122 4,999 ,000
Long Haul ,900 ,205 4,393 ,000
Total Intangibles ,293 ,024 ,238 12,193 ,000 ,473
Medium Haul ,307 ,030 ,251 10,102 .000 ,412
Long Haul ,241 ,043 ,188 5,631 ,000 ,553
Total Tangibles ,397 ,022 ,376 18,092 ,000 ,417
Medium Haul ,391 ,030 ,354 12,936 ,000 ,340
Long Haul ,397 ,037 ,418 10,862 ,000 ,418
Total Entertainment ,053 ,011 ,074 4,703 ,000 ,722
Medium Haul ,044 ,013 ,062 3,280 ,001 ,710
Long Haul ,099 ,030 ,116 3,330 ,001 ,513
Total On-Ground ,267 ,031 ,225 8,496 ,000 ,671
Medium Haul ,142 ,019 ,146 7,320 ,000 ,642
Long Haul ,134 ,016 ,139 4,212 ,000 ,740
Dependent Variable: Satisfaction
Total flights: d(4,2825)= 679.409;r=0.7;Adjusted R 2 =0.49; Durbin Watson=1.754
Medium Haul: d(4,2023)=478.212,r=0.486;Adjusted R 2=0.485; Durbin Watson=1.753 Long Haul:d(4,797)=204.234;r=0.712;Adjusted R 2=0.504; Durbin Watson=1.893
All service quality indexes were significant (p<0,01) to the satisfaction prediction Tolerance Analysis 4
The hypothesis 3 seeks to determine whether the dimensions of service quality positively influence satisfaction. As it is easy to conclude, 48.5% of Satisfaction variance can be predicted from the independent variables, in the short haul, and 50.4% in the long haul. Thus, the hypothesis 3 is confirmed for both routes.
All variables are significantly contributing to simplified satisfaction equation. Tangibles is the dimension that mostly influences Satisfaction in both routes, (B =0, 354) in medium haul and (B=0,418) in long haul; followed by intangibles and on-ground service. Entertainment is the dimension which least predicts Satisfaction in medium haul (B = 0,146) and long haul (B=0,139). As far as on-ground service is concerned, it plays a higher influence on passengers’ satisfaction on medium course but it is a little difference.
4 Analyzing tolerance, it is possible to detect some multicolinearity problems, since tolerance is low (<1-r2) for tangibles in both
30 Table 5.5 Service Quality prediction on Customer Behavioural Intentions
Model
Unstandardized
Coefficients Standardized Coefficients
t Sig.
Collinearity Statistics
B
Std.
Error Beta Tolerance
Total (Constant) ,652 ,116 5,636 ,000
Medium Haul ,658 ,133 4,939 ,000
Long Haul ,664 ,234 2,835 ,005
Total Intangibles ,352 ,026 ,270 11,371 ,000 ,479
Medium Haul ,379 ,033 ,298 11,595 ,000 ,420
Long Haul ,282 ,049 ,199 5,764 ,000 ,554
Total Tangibles ,410 ,024 ,369 14,631 ,000 ,420
Medium Haul ,386 ,032 ,337 11,892 ,000 ,345
Long Haul ,407 ,042 ,389 4,718 ,000 ,413
Total Entertainment ,042 ,012 ,056 3,389 ,001 ,721
Medium Haul ,027 ,014 ,036 1,840 ,066 ,712
Long Haul ,141 ,034 ,150 4,153 ,000 ,509
Total On-ground ,093 ,017 ,092 5,413 ,000 ,679
Medium Haul ,097 ,021 ,096 4,646 ,000 ,653
Long Haul ,083 ,030 ,082 2,734 ,006 ,740
Dependent Variable: Customer Behavior Intentions
Total Flights: d(2, 2770)=585.072);r=0.677; Adjusted R Square=0.457; Durbin Watson=1.771 Medium Haul: d(4,1982)=408.273;r=0.672; Adjusted R Square=0.451; Durbin Watson= 1.784 Long Haul: d(4,783)=182.851;r=0,695; Adjusted R Square=0.480; Durbin Watson=1,814 Bold value is not significant (p<0,05)
As seen in table (5.5), all variables contribute significantly to the model, except for Entertainment in medium haul (p=0.066). However, in long haul, entertainment assumes a significant predictive role in intentions (B =0,150). Tangibles are the dimension which mostly predicts Consumer Behavioural Intentions, both in long haul (B = 0,389) and medium haul (B= 0,337) followed by intangibles, that have a powerful influence in medium haul passenger intentions (B= 0,298) than long haul does (B = 0,199). Besides, we can infer that on-ground service is less determinant on intentions than tangibles and intangibles. Relating the data with the fourth hypothesis, which predicts the positive influence of Service Quality in Customer Behavioural Intentions, it is accepted for all dimensions in both routes, with the exception of entertainment in medium haul.
In order to test the fifth hypothesis, a multiple linear regression was carried out having Satisfaction as independent Variable and Consumer Behavioural Intentions as dependent one (table 5.6).
31 Table 5.6: The impact of Satisfaction on Customer Behavioural Intentions
Model
Unstandardized Coefficients
Standardized Coefficients
t Sig.
Collinearity Statistics
B
Std.
Error Beta Tolerance
Total (Constant) ,764 ,048 15,818 ,000
Medium Haul ,917 ,055 16,689 ,000
Long Haul ,310 ,100 3,103 ,002
Total Satisfaction ,887 ,008 ,824 105,042 ,000 1,000
Medium Haul ,862 ,010 ,818 89,967 ,000 1,000
Long Haul ,960 ,018 ,844 54,383 ,000 1,000
Dependent Variable: Customer Behaviour
Total Flights: d(1,5203)=11033.864;r=0.824;Adjusted R square=0.679;Durbin Watson=1.868 Medium Haul: d(1,4008)=8094.089 ;r=0.818;Adjusted R square=0.669;Durbin Watson=1.838 Long Haul: d(1,1193)=2957.51 ;r=0.818; Adjusted RSquare=0.669; Durbin Watson=2.055 Tolerance is maximum (1,000) excluding multicollinearity problems
CHAPTER 6: CONCLUSION
6.1 DISCUSSION
Service quality and satisfaction are considered to affect financial success, reputation and future lifespan of firms due to their influence on customer behavioural intentions and attitudes. A review of aviation industry literature suggests that the growing increase in air traffic and the necessary reductions in costs given the petroleum crisis and global financial jeopardize passengers’ satisfaction and consequently intentions to companies. Among the several articles on aviation, records about the charter industry were not found. Therefore, this research study has the following purpose:
Purpose: To explore the impact of the most important service quality dimensions on charter industry and also the impact of satisfaction in determining customer behavioural intentions.
According with the purpose and the research objectives, we intend to focus on and discuss a parallelism between researches found in literature and the obtained results here.
Objective 1 - To identify key items and dimensions considered in airline service quality evaluation, regarding performance and importance
32 to the distinct offer yet explained in chapter 5. This managerial decision is possibly based on the time flights and the fact that in medium haul, the type of aircraft used does not have personal video for each passenger and there are less crew members. On the other hand, entertainment assumes the role of least important dimension to passengers in both routes which can be a reason for it not to being a priority to the firm.
Regarding the perceptions of the importance of each dimension, the long haul passenger gives more importance to all dimensions compared to the medium haul one. Possibly, this may be linked with the number of hours spent on the plane, the financial effort involved and a greater emotional commitment in vacation planning, as destinations are generally more expensive and more distant.
From Objective 1 we stated two hypotheses, the first of which stated that airline charter passengers consider in-flight service more important than on-ground service, which was accepted in long haul flights. Contrary to what was expected given the time of interaction which is longer on-board and the powerful prediction of certain in-flight service attributes on satisfaction this hypothesis was rejected on medium haul flights. However, it is imperative to highlight two aspects: the number of items of each type of service (in-flight has more items, so a good global evaluation is harder to achieve) and the role of entertainment, in both levels, performance and importance, lowering the values of in-flight service evaluation.
Following the dominant paradigm in service quality airline articles, the hypothesis 2 refers that airline passengers consider more important intangibles than tangibles in on-board service.
Not as one would have expected, the tangibles are the most important dimension regardless of the route, even though tangibles and intangibles do not show a significant difference in our study. Consequently, the hypothesis was rejected. Zins (2001) provides a possible explanation for this when saying that catering cannot be detached from personal interaction. Also Mustafa et al. (2005) stated that aspects related to the crew are given less importance than comfort and catering; these two are items of tangible dimension in our study. However, faced with the surprise of the rejection of this hypothesis and the inconclusive results, we decide to expand our conclusions based on the items, in order to find explainable reasons. In effect, the analysis at items level shows that intangibles which are below the average of importance are passengers are well received when entering the plane and the appearance of the crew in long haul, which curiously are the best
evaluated items at performance level. In medium haul, the items employees gives crew personal attention and appearance of the crew are below the average line of importance, but while the
33 importance are seating comfort and food and beverage quality, precisely the worst evaluated at
performance level.
A possible conclusion for these facts is that after answering the performance battery of questions, passengers value as less important the items which yet satisfy them and as more important the items which in their opinion are less well performed and, consequently, require airline managers’ attention. On the other hand, they show priorities of action to the airline valuing the item with less performance as the least important too, employees give passengers personal attention. In medium
haul the employees give personal attention is the least important, probably because passengers
interact with crew fewer time than in long haul and their needs, problems, fear, anxiety are minor.
However, these are possible explanations, since according with Sultan and Simpson (2000) tangible aspects are the least important ones within the service and Pakdil and Aydin (2007) show some higher expectations, conditioned by the importance perceived by passengers, for reliability , in which fit several items of the intangible dimension in our study.
Objective 2 - To evaluate the impact of service quality in satisfaction
Regarding, service quality as a global construct, literature review about aviation provided a conceptual linkage between that construct and satisfaction (Zins, 2001; Park et al, 2006 a,b; and Saha and Theingi, 2009). Hence, hypothesis 3 stated that service quality in charter airlines influences positively passenger’s satisfaction, which was confirmed by the empirical findings of this study.
In fact, 48.5% of Satisfaction variance can be predicted from the independent variables, in the short haul, and 50.4% in the long haul. There are no differences between medium and long distance courses as far as the order of satisfaction determinants is concerned: tangibles, intangibles and on-ground service. Entertainment is the dimension which less predicts satisfaction.
Surprisingly, tangible dimension predicts more satisfaction than intangible one, contrary to the support provided by the theory and empirical data (Brady and Cronin Jr., 2001; Zins, 2001 and Park et al., 2009). On the other hand, the acceptance of the hypothesis 3 is corroborated by An and Noh (2009) that underline that food and beverage quality is the mostly powerful dimension to influence passengers satisfaction. This fact concerns economic class since 98.5% of inquirers in our study travel in economic class.
34 satisfaction in long haul than in medium haul. This fact is possibly related to the hours spent in the aircraft in long haul flights. In these flights, passengers are more sensitive to questions of entertainment, comfort, quality meals, cleanliness of cabin and toilets than in a flight of two or three hours in which passengers do not need to eat or are less sensitive to questions of comfort, cleanliness and entertainment. Maybe due to the faults detected in entertainment, medium haul passengers demand a positive quality interaction with the crew as a way of killing time, talking
about the destination, answering possible doubts and resolving eventual problems.
Objective 3 - To determine the relation between service quality and passenger behavioural intentions
Focusing on the relation between service quality and behavioural intentions, according to Zeithaml (1996), we have accepted the hypothesis 4 taking into account the positive influence of service quality into behavioural intentions, in both length courses. The tangible dimension has a higher impact on behavioural intentions, followed by the intangible dimension, matching Zins (2001) who selects comfort and catering as variables, which are concerned with tangibles in this study. In medium haul, entertainment does not predict behavioural intentions due to the same reason that less predicts satisfaction.
When comparing predictive powers of different dimensions on both routes, it is possible to state that it happens the same that in the prediction of satisfaction. That is, intangible dimension has a higher influence on behavioural intentions in medium course and tangibles play a higher influence on long haul. The possible reasons for this are explained above (in the comments about objective 2).
Service quality explains 45,1% of the variation of behavioural intentions on medium course and 48% on long course, illustrating a higher influence than the one shown by An and Noh (2009). These authors have explained 29,1% of the variation of behavioural intentions based on four service quality dimensions.
Objective 4 - To determine the impact of satisfaction on passenger behavioural intentions