Does Corporate Governance Influence the Efficiency of Brazilian
Companies? *
Igor Bernardi Sonza
Ph.D., Multidisciplinary Department, Federal University of Santa Maria E-mail: [email protected]
Gilberto de Oliveira Kloeckner
Associate Professor, Graduate Program of Economics, Federal University of Rio Grande do Sul E-mail: [email protected]
Received on 3.1.2013- Desk acceptance on 3.11.2013- 3rd. version approved on 4.8.2014
ABSTRACT
Conflicts of interest between managers and owners is an oft-studied issue in academia, first documented by Berle and Means in 1932, which exposes the classic conflict of interest between agent and principal discussed in agency theory. The premise of corporate governance is that people in corporations do not necessarily act in funders’ best interest. Based on this assumption, this study investigates the influen-ce of aspects of corporate governaninfluen-ce on the efficiency of publicly traded Brazilian companies. The study combines static optimization techniques through data envelopment analysis (DEA) to identify the efficiency of publicly traded companies, using panel data to identify the influence of corporate governance on company efficiency. The data were manually collected from 20-F reports from the Securities and Exchange Commission (SEC) for Brazilian companies that had American depositary receipts (ADRs) because the database is not entirely available in Brazil. Many of the hypotheses were confirmed, thereby showing the particular conditions of corporate finance in Brazil with respect to corporate governance. The immaturity of the Brazilian capital market is perceived in various analyses, emphasizing that the history of the Brazilian corporate system is one of the limiting factors of the efficiency of companies. The conditions that prevail are the following: (i) high ownership-management overlap; (ii) boards with low effectiveness; (iii) in family groups, the poor definitions of the roles of stockholders, boards and management; (iv) the lack of clarity related to the cost-benefit relationship for good governance; (v) ine-fficiency of the boards of directors and (vi) evidence of conflicts of interests, diminished by explicit and implicit incentives.
Keywords: Efficiency. Corporate governance. Agency theory.
1 InTRoDuCTIon
Conflicts of interest between managers and owners is an oft-studied issue in academia, first documented in 1932 by Berle and Means, exposing the classic con-flict of interest between agent and principal discussed by agency theory. The premise behind corporate gover-nance is that people in corporations do not necessarily act in funders’ best interest.
Executives may act in several ways that are incon-sistent with the interests of shareholders. Tirole (2006) divides these behaviors into four categories, which be-long to the problem generally termed “moral hazard”: (i) insufficient commitment; (ii) extravagant investments; (iii) entrenchment strategies, or maintaining one’s po-sition in the company by engaging in actions that may harm shareholders; and (iv) self-dealing, or increasing private benefits for executives and consuming “perks” that burden the company and do not benefit the sha-reholder. However, the issue of moral hazard is only a small portion of executives’ questionable behavior. Tiro-le (2006) argues that the primary issue involved in this conflict of interest is institutional responsibility related to corporate governance, finances and administrative incentive contracts.
Consistent with that assumption, this study aims to investigate the influence of aspects of corporate gover-nance (particularly with respect to executive compen-sation) on the efficiency of Brazilian publicly traded companies.
This issue can be considered innovative because it uses data on corporate governance (executive compen-sation) to verify the impact of the variables set forth above on the efficiency of Brazilian companies; the data were collected manually from 20-F reports of the Secu-rities and Exchange Commission (SEC) because the en-tire database is not available in Brazil. Companies that have American depositary receipts (ADRs) are required to provide that data to the SEC, enabling the collection of information. This study seeks to add corporate go-vernance to the literature on production efficiency in the context of institutional differences in the Brazilian environment to complement previous studies that only
consider outputs as measures of efficiency.
Among those studies are the works of Belkaoui and Pavlik (1992) and Hitt and Ireland (1986), who used the logarithm of revenue or market capitalization as a dependent variable to measure company performance. Frydman, Gray, Hessel, and Rapaczynski (1999) consi-dered profitability as a measure of efficiency. Meggin-son, Nash, and Randenborgh (1994) indicated efficiency by taking the company’s revenue divided by the number of employees. However, these authors did not consider that an organization’s strategic focus is its operational function, i.e., the process of transforming inputs into outputs (Sheu & Yang, 2005).
Research on the technical efficiency of companies through data envelopment analysis (DEA) enables ac-cess to the problem of corporate governance in a tran-sition scenario. If there is a significant positive rela-tionship between corporate governance practices and technical efficiency, companies should have incentives to develop their governance. For Zheka (2005), tech-nical efficiency is a useful proxy because it is a single aggregate measure of using input factors to produce desired outputs relative to efficiency. This analysis ena-bles an examination of the root of the corporate gover-nance problem and, specifically, of the inefficient use of resources.
The use of technical efficiency to measure company performance, according to Destefanis and Sena (2007), can be justified in many ways: (i) technical efficiency is a good indicator of performance in underdeveloped ca-pital markets because it diminishes the importance of measures based on share price, which may not fully re-flect information in the marketplace; (ii) where there is separation between capital and control, managers’ ina-ppropriate behavior generates a reduction in technical efficiency, which is captured in the analysis; and (iii) in the economics literature, several authors have demons-trated the existence of a substantial relationship between ownership structure and efficiency (Jensen & Meckling, 1976; Belkaoui & Pavlik, 1992).
2 ASpECTS of CoRpoRATE GovERnAnCE
Assuming that corporate governance is the way that corporate shareholders ensure returns on their invest-ments, thus resolving the conflict of interest between agent and principal, Tirole (2006) suggests two mea-sures discussed below: (i) incentives for executives and (ii) monitoring.
2.1 Incentives for Executives.
Because the scope of questionable performance by executives is large, implicit and explicit, incentives can, in practice, generate value creation for the company (Tirole,
2006). The following are the types of incentives available.
2.1.1 Explicit incentives.
maxi-mize corporate value. According to Jensen and Murphy (1990), executive compensation can positively impact shareholder wellbeing and the company's performan-ce. Kaplan (1994a) finds a positive relationship between executive compensation and corporate financial perfor-mance in Japan. However, according to Bertrand and Mullainathan (2001), executive compensation is often the result of luck. Under these assumptions, the follo-wing hypothesis is created:
Hypothesis 1: It is expected that a higher level of total compensation for executives causes them to have greater incentives to seek efficiency, and therefore, the-re should be a positive the-relationship between these two variables.
Another aspect of the design of incentive compensa-tion is the (non)linearity of compensacompensa-tion as a funccompensa-tion of performance. Shares or “options” (i.e., the right to buy shares at a “strike price” until a specified date) can be offered to executives. Taking into account the per-centage of shares owned by company officers and di-rectors, Ghosh (2007) identifies a positive relationship between this variable and company performance, but this relationship is not necessarily monotonic. Babenko (2009) shows that share buyback is positively related to executive compensation because executives are forced to assume more risk in companies that repurchase sha-res, forcing them to exercise their options and recei-ve higher compensation. In contrast, Bergstresser and Philippon (2006) show that the use of accounting ma-nipulations is more pronounced in companies where the total potential compensation of the Chief Executive Officer (CEO) is more related to the value of shares and options. Thus, during years with greater manipulation, CEOs usually exert a greater number of options and sell large quantities of shares, which shows that incen-tives based on shares and options are not always the best choice for executive compensation. In the same context, Bennett (2010) finds that when a majority of a company’s shares are owned by outside shareholders, that company performs better in the announcement to buy and sell shares than companies with primarily in-side shareholders.
Slovin and Sushka (1993), Ghosh and Ruland (1998), Hall and Liebman (1998) and Fahlenbrach and Stulz (2009) find a strong positive relationship betwe-en performance and executive compbetwe-ensation that pri-marily consists of shares and options, but as stated by Dickins and Houmes (2009), this positive relationship diminishes greatly in markets that are experiencing cri-ses. Florackis, Kostakis, and Ozkan (2009) arrive at the same result using a semiparametric approach. Along the same lines, Bulan, Sanyal, and Yan (2010) find a nonmonotonic positive relationship between producti-ve efficiency and executiproducti-ve share ownership, and Gue-dri and Hollandts (2008) identify this relationship in French companies as having the form of an inverted “U”. In accordance with these assumptions, the follo-wing hypotheses are formulated:
Hypothesis 2: The fact that executives own company shares creates incentives for them to seek efficiency, so this relationship should be positive.
Hypothesis 3: The fact that executives own company options creates incentives for them to seek efficiency, so this relationship should be positive.
2.1.2 Implicit incentives.
Naturally, executives are concerned with keeping their jobs. Unsatisfactory performance causes directors to remove executives from their posts. Directors may voluntarily fire executives or can implicitly or explicitly pressure them to quit if shareholders observe that the company’s stock price or profit is lower than expected (Tirole, 2006). In this context, Boyer and Ortiz-Molina (2008) argue that career preoccupation causes executi-ves to make riskier decisions.
Some studies, such as those by Weisbach (1988) and Jensen and Murphy (1990), have documented an inver-se relationship between company performance and the likelihood of executive turnover (i.e., a change in the identity of the CEO in a given period). These results suggest that executives are more likely to leave a com-pany after years of bad performance than after years of good performance, and therefore, they are disciplined by the threat of termination. However, for Chen, Gol-dstein, and Jiang (2008), turnover is a good proxy for determining whether directors effectively monitor the executives.
Other studies, such as those by Jensen and Warner (1988) and Gilson (1989), find an inverse relationship between turnover and performance. Gilson (1989) sho-ws that 52% of companies surveyed turn over executi-ves when they are in financial difficulty or bankruptcy. Executives who have resigned from their companies ty-pically are not hired by another listed company during the three subsequent years. This phenomenon is also observed by Kaplan (1994b) for German companies. Ac-cording to these assumptions, the following hypotheses are formulated:
Hypothesis 4: Executive turnover is negatively related to company efficiency because it may indicate financial diffi-culties arising out of mismanagement.
Hypothesis 4A: Executive turnover is positively related to company efficiency because it indicates an improvement in performance requirements.
Jensen and Murphy (1990) suggest that the risk of CEOs being fired by the board decreases with time. The authors argue that the risk of dismissal is more pronoun-ced for younger CEOs because, over time, they will form their power bases. Based on this assumption, the following hypothesis is formulated:
Hypothesis 5: The executive’s age is negatively rela-ted to efficiency because, in general, older CEOs have established their power bases and make less risky de-cisions.
that have long been a puzzle for researchers working on models of optimal contracts, primarily with regard to the separation of ownership and control. Jensen (1993) and Bebchuk and Fried (2003) explain that the influence of executives on their own pay, hiring, and firing, among others factors, can generate substantial costs for shareholders that can distort incentives and hurt corporate performance. Goyal and Park (2002) ar-gue that the sensitivity of CEO turnover to company performance is significantly lower when the CEO also serves on the board of directors. This result demons-trates that an executive’s dual status as a board member hinders dismissal due to weak performance. Thus, the following hypothesis is formulated:
Hypothesis 6: The fact that the executive serves on the board, especially when the CEO is the chairman of the board, may impair corporate efficiency, and thus, there is a negative relationship between the variables.
The optimal contract hypothesis predicts that mo-nitoring by the directors is less necessary when the-re athe-re other control mechanisms that athe-re effective in reducing the agency problem. Chen et al. (2008) state that two measures capture the power of incentives for executives: tenure, which is measured by the number of years that the executive has held office, and the size of the executive group. The optimal contract hypothesis predicts a negative relationship of tenure and number of chief executives with efficiency. The idea behind this statement is that executives who are in power for longer have fewer worries about the job market, and thus, the demand for monitoring is relatively high for executives who have served for a longer period.
The existence of a large number of executives also ge-nerates more monitoring because the greater the number of executives, the greater the oversight by the directors. Goyal and Park (2002) find a negative effect of tenure on the company because a long tenure may represent that the CEO has established a power base. In this context, the following hypotheses are formulated:
Hypothesis 7: Executive tenure is negatively rela-ted to corporate efficiency because it can worsen the agency problem.
Hypothesis 8: The number of executives is nega-tively related to the company’s efficiency because the demand for monitoring is greater, thereby increasing the costs.
2.2 Monitoring.
Companies are monitored by various external agents, including board members, auditors, major sha-reholders, creditors, investment banks, and rating agen-cies. First, the board members monitor the company’s management on behalf of shareholders (Tirole, 2006). Studies such as Gilson (1990) have shown the impor-tance of measuring the impact of the composition of the board of directors on company performance: the
proportion of independent directors is the most im-portant question to evaluate, which demonstrates the positive relationship between these variables.
Faleye, Hoitash, and Hoitash (2011) claim that di-rectors may be either affiliated with the company or in-dependent and that the latter group has no significant relationship with the company. Due to this objectivity, independent directors are seen as valuable monitors, and their involvement with the board is usually related to improvement in the company’s accounting system and greater shareholder protection. Brick and Chidam-baran (2010) find a positive relationship between the number of independent directors and company per-formance after increased external pressure from the stock exchanges to seat independent directors. Beasley (1996) shows that the percentage of independent bo-ard members is lower in companies that have had fraud scandals.
However, Adams and Ferreira (2007) present a mo-del in which independent directors can suffer severe consequences because administrators are less inclined to share information with directors as the intensity of monitoring increases. With less information, the board cannot monitor effectively. In his most recent study, Adams (2009) suggests that directors who primarily monitor executives are less affected than directors who only direct, suggesting that monitoring alone is not su-fficient for good governance. In the same vein, Cohen, Frazzini, and Malloy (2012) show that companies tend to appoint independent directors that have a more op-timistic view of the company and who are less efficient monitors. Those authors also identify that the more optimistic the independent directors, the more poorly managed the companies and the larger the subsequent increases in executive compensation. According to the-se assumptions, the following hypothethe-ses have been formulated:
Hypothesis 9: An increase in the proportion of inde-pendent directors is positively related to efficiency becau-se independent directors have fewer vices related to the company, which could increase effective monitoring.
Hypothesis 9A: An increase in the proportion of inde-pendent directors is negatively associated with efficiency because companies tend to appoint directors who are more optimistic and less efficient monitors.
Arthaud-Day, Certo, Dalton, and Dalton (2006) de-monstrate that changes in the board of directors occur more frequently when a company is restructuring. In the same vein, Agrawal, Jaffe, and Karpoff (1999) show that fraud scandals can create incentives to change the board of directors to increase company performan-ce through increased monitoring and the presenperforman-ce of directors with better reputations. These factors show that turnover can be positively connected to efficiency. Based on these assumptions, the following hypotheses are formulated:
Hypothesis 10: Turnover of the chairman of the board is positively related to efficiency because it may represent an increase in monitoring by hiring directors with better reputations, especially if the company had experienced a fraud scandal.
Hypothesis 10A: Turnover of the chairman of the bo-ard is negatively correlated with efficiency because it crea-tes problems related to the continuity of decision-making, which has an impact on company revenues.
Jensen (1993) and Nanka-Bruce (2009) claim that having a small board can help increase company per-formance. When a board has more than seven or eight people, it is less able to function effectively in terms of monitoring, and it becomes easier for the CEO to maintain control. Consequently, board size is negative-ly related to company efficiency. Yermack (1996) also finds that companies with smaller boards have better financial indices and better financial incentives for
executives. In that context, the following hypothesis is formulated:
Hypothesis 11: Board size negatively influences a company’s efficiency because it is less able to function effectively.
Chen et al. (2008) argue that directors with greater lon-gevity in office generally have greater financial resources, prompting them to invest more in company ownership and creating a positive relationship among ownership, age, te-nure and, consequently, efficiency.
In the same context, but using different arguments, Adams (2009) and Faleye et al. (2011) find that the lon-ger a director serves, the greater his or her decision-making performance. The authors argue that knowled-ge and professional experience make directors more likely to choose the correct strategic alternative. Addi-tionally, because they have longer periods of service, these directors also generate greater confidence on the part of CEOs by being less critical and more unders-tanding when evaluating potential strategic options. Consistent with this fact, the following hypotheses are formulated:
Hypothesis 12: Director tenure is positively related to efficiency because longer-serving directors are more pre-pared to make strategic decisions.
Hypothesis 13: Director age is positively related to effi-ciency because older directors have more experience and influence, thus facilitating interaction with the CEO.
3 METhoDoloGICAl ASpECTS
To analyze the influence of aspects of governance on the efficiency of publicly traded Brazilian companies, we conducted exploratory and descriptive research based on quantitative methods. The steps used to conduct the study are described below:
a) Data collection: secondary data extracted from spe-cific databases in Brazil were used to conduct this study. The basic data relating to ownership struc-ture balance sheet and income statement, among others were taken from Economática. Data on the number of employees were taken from companies’ websites, Portal Exame and the Securities and Ex-change Commission (SEC). Finally, we used data collected manually from the 20-F SEC reports to analyze aspects of corporate governance (this idea is from Funchal and Terra, 2006).
b) Scope and sample: this work covers publicly traded companies listed on the SEC with stock traded at the Stock Exchange of São Paulo (Bolsa de Valores de São Paulo Bovespa) (ADRs). Data collection was perfor-med in two steps. To analyze the relative efficiency of companies, data were obtained for an average of 515 companies with shares traded at Bovespa during 1999-2009 (11 years), totaling 5,665 company-years (data on all the companies traded in this period were
used). Because DEA does not accept missing data, the company-years that did not have all available data were removed, resulting in 4,046 company-years. This sample was divided by year (11 years) and by sector (13 sectors), generating 143 different analyses. This measure was taken because, given that the DEA is a calculation of relative efficiency (efficient relative to other companies that are in the sample), companies could not be compared to themselves in previous ye-ars or to companies belonging to different sectors in which the measures, standards, and conventions are very different. To identify the 13 sectors mentioned, the same criteria as those of the Economática databa-se (which classifies 21 different databa-sectors) were udataba-sed, and some of these were rearranged by a homogeneity criterion because they had few companies, thus pre-cluding analysis.
and electronics (38 companies per year on average); (7) telecommunications (26 companies per year on average); (8) textiles (29 companies per year on ave-rage); (9) chemicals, oil, and gas (24 companies per year on average); (10) cellulose, agriculture, fishing, and mining of non-metallic products (22 companies per year on average); (11) trade (16 companies per year on average); (12) management of companies and enterprises (22 companies per year on average); and (13) electric power (38 companies per year on average).
Much data relating to corporate governance is not supplied by Brazilian companies, particularly for such a long time series, because it is not included in the Bovespa or other known databases in Brazil. Therefore, the data were manually collected and analyzed from the 20-F reports of Brazilian com-panies that had ADRs, which contained a relatively complete set of information for these companies. However, the sample had to be reduced because few Brazilian companies have ADRs. The first sample was used to calculate efficiency using DEA, and the second was reduced to the number of companies that had data on corporate governance. When the two databases were combined, only 396 company-years remained to be analyzed, that is, an average of 40 companies (not all companies had data for all 11 years).
c) Software: the programs used were (i) DEA-Solver-Pro® to calculate DEA and (ii) Stata SE® to calculate linear regressions.
d) Data analysis: data analysis was performed in two sta-ges, as follows:
1. Calculation of Companies’ Relative Efficiency: The first step consisted of calculating the relative effi-ciency of publicly traded Brazilian companies throu-gh DEA. The use of these variables was inspired by the model from Nanka-Bruce (2009) and were ar-ranged as follows: (i) three types of input variables the cash value of tangible and intangible assets; the cash value of material costs and operating expenses; and a log of the number of employees, and (ii) two types of output variables the cash value of revenues and Tobin’s q, a performance measure based on ma-rket value. Tobin’s q is calculated based on Chung and Pruitt (1994), who consider it to be the ratio be-tween the market and book values of the company’s total assets, i.e., q=(MVE+PS+D)/TA, where MVE is the product of the company’s stock price and the number of common stock shares in circulation, PS is the liquidating value of outstanding preferred sto-ck, D is total debt, and TA is the total assets of the company. Total debt is calculated as follows: D = CL – CA + S + LTD, where CL is current liabilities, CA is current assets, S is Stock, and LTD is Long Term Debt. The data used to compose this variable were taken from Economática. Two methods were used for DEA: (i) variable returns to scale (BCC); and (ii)
total efficiency (GRS). The model used is additive because it simultaneously maximizes outputs and minimizes inputs, and it is the most recommended model for analyses involving costs and financial re-sults (Cooper, Seiford, & Zhu, 2004). To calculate DEA, several steps were necessary. First, the varia-bles were winsorized, i.e., a new variable identical to the previous variable was generated, except for the lower extreme values, which were replaced by the next smallest value, and the higher values, which were replaced by the previous value. This was done to reduce the influence of outliers on the analysis. It was decided to use 5% in winsorization. Second, the correlation test was applied to assess whether the variables were highly correlated. If so, an analysis was conducted to identify the less-significant varia-ble so it could be removed from the model. Third, the variables were separated by year and by sector, generating 143 analyses (11 years and 13 different sectors). The index generated constitutes the relati-ve efficiency of companies and is used as the depen-dent variable in the regression.
2. Analysis of the influence of corporate governance on efficiency: To assess the influence of ownership struc-ture on company efficiency, we used the unbalanced panel data model that employs the generalized method of moments (GMM), which is a tool that considers a given sample of individuals over time and allows mul-tiple observations of each individual in the sample. In this case, the dynamic model (which considers the la-gged dependent variable as explanatory) and differen-ces (GMM-Sys) were applied. The instruments used were the lagged variables, as proposed by Almeida, Campello, and Galvão (2010). To conduct the analysis, the following tests were applied: (i) the correlation test, which checks whether the variables are highly related and, if so, assesses which variable is least significant so it can be removed from the model; (ii) the Arella-no and Bond (1991) test, which tests the existence of serial correlation; (iii) the test of over-identification by Hansen J (1982); and (iv) Chi-square (X2). As in
the DEA, the variables are winsorized at 5%. Formula 1 shows the dependent variable and the independent variables of the model.
because, according to Laeven and Levine (2008), one-third of European companies have multiple large shareholders with market value that differs from companies that have a dispersion or concentration of shares. This shows the need to examine not only the largest shareholder but also the remaining majority shareholders. For simplicity, only regressions with PSV and FSV are shown in the tables. The governance variables, defined in the literature review and hypothesis formulation, are as follows: (i) number of di-rectors; (ii) tenure of didi-rectors; (iii) age of didi-rectors; (iv) number of independent directors; (v) number of executives on the board; (vi) dummy if the CEO is also chairman of the board; (vii) dummy for director turnover; (viii) num-ber of chief executives; (ix) age of executives; (x) tenure of executives; (xi) dummy for executive turnover; (xii) equity ownership of executives in the company; (xiii) options for executives; and (xiv) executive compensation. The
varia-bles “options for executives” and “executive compensation” are adjusted for inflation using the General Price Index In-ternal Availability (Índice Geral de Preços-Disponibilidade Interna - IGP-DI). These variables are defined in Appendix A. With respect to the control variables, the following mea-sures were included in the equation: (i) size total assets; (ii) leverage current and long-term liabilities on stockholders’ equity; (iii) industry fixed effects; and (iv) temporal fixed effects.
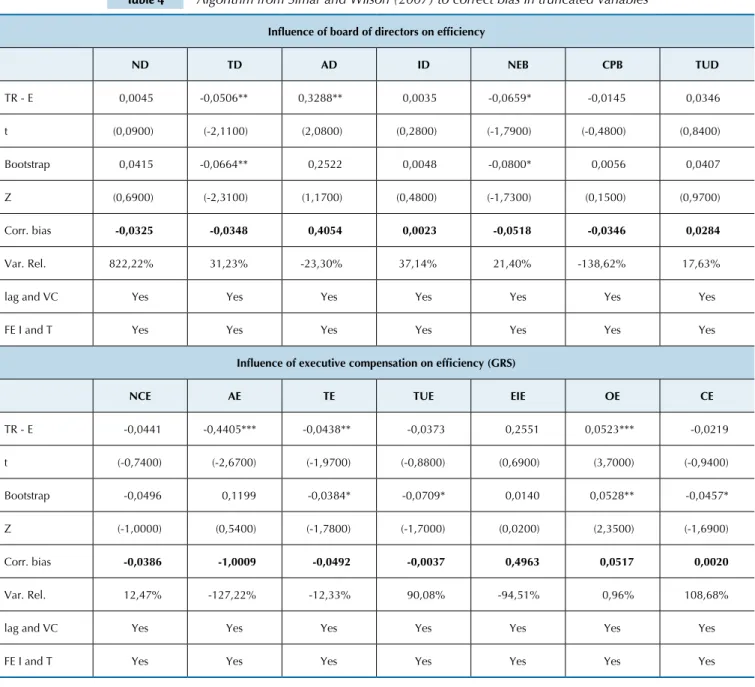
Because the dependent variable in the model is limi-ted to a number from zero to 100, there is a possibility of problems with truncated variables. For this reason, the algorithm from Simar and Wilson (2007) was applied in two stages to improve the statistical inference of the mea-sures of technical efficiency. Examples from Souza, Souza and Staub (2009) were also used as parameters to analyze the model.
4 AnAlySIS of RESulTS
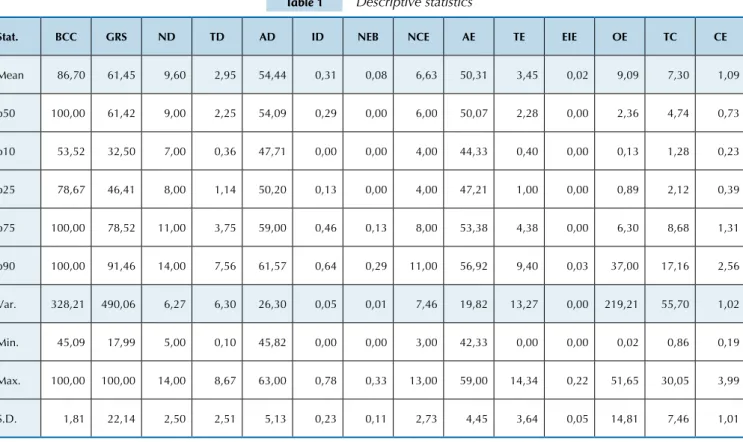
This subsection aims to identify how agent-principal conflicts affect efficiency and whether incentives have a positive effect on the performance of Brazilian cor-porations. Using the descriptive statistics presented in Table 1, we found that on average, companies have nine to ten directors, each of whom spend approximately three years on the board. On average, the directors are 54 years old. The companies have six or seven prin-cipal executives, who are 50 years old on average and
spend approximately three and one-half years in offi-ce. Executives’ equity interest is very low, an average of just under 0.02%. Total compensation, deflated to the year 1999, is approximately R$ 7.3 million, represen-ting R$1.09 million per year for each executive, with options that average R$9.09 million. With respect to performance, companies have 61.45% total efficiency on average; when considering only variable returns to scale, this average increases to 86.70%.
Table 1 Descriptive statistics
Stat. BCC GRS ND TD AD ID NEB NCE AE TE EIE OE TC CE
Mean 86,70 61,45 9,60 2,95 54,44 0,31 0,08 6,63 50,31 3,45 0,02 9,09 7,30 1,09
p50 100,00 61,42 9,00 2,25 54,09 0,29 0,00 6,00 50,07 2,28 0,00 2,36 4,74 0,73
p10 53,52 32,50 7,00 0,36 47,71 0,00 0,00 4,00 44,33 0,40 0,00 0,13 1,28 0,23
p25 78,67 46,41 8,00 1,14 50,20 0,13 0,00 4,00 47,21 1,00 0,00 0,89 2,12 0,39
p75 100,00 78,52 11,00 3,75 59,00 0,46 0,13 8,00 53,38 4,38 0,00 6,30 8,68 1,31
p90 100,00 91,46 14,00 7,56 61,57 0,64 0,29 11,00 56,92 9,40 0,03 37,00 17,16 2,56
Var. 328,21 490,06 6,27 6,30 26,30 0,05 0,01 7,46 19,82 13,27 0,00 219,21 55,70 1,02
Min. 45,09 17,99 5,00 0,10 45,82 0,00 0,00 3,00 42,33 0,00 0,00 0,02 0,86 0,19
Max. 100,00 100,00 14,00 8,67 63,00 0,78 0,33 13,00 59,00 14,34 0,22 51,65 30,05 3,99
S.D. 1,81 22,14 2,50 2,51 5,13 0,23 0,11 2,73 4,45 3,64 0,05 14,81 7,46 1,01
Tables 2 and 3 show the analyses for the influence of the board of directors on efficiency using the BCC method and the influence of executive compensation on efficiency using the GRS method. The other tables were omitted because they showed similar results. All the variables addressed in the review were tested sepa-rately and in combination, and the ownership structu-re variable was included in the last structu-regstructu-ression. At the bottom of the tables, the Hansen J (1982) over-identi-fication test is shown, showing that in all analyses, the null hypothesis is not rejected and indicating that the instruments are apparently uncorrelated with the error term of the regression.
In the chi-squared test (X2), the null hypothesis is
rejected, indicating that the observed frequencies are not different from the expected frequencies, i.e., the-re is an association between groups of variables in the models presented. Finally, in the Arellano and Bond (1991) test (AR(1) and AR(2)), the null hypothesis is rejected in most of the regressions with respect to the lack of serial correlation in the first-order residuals, and the hypothesis is not rejected for the second order. Therefore, for these, the model shows serial correlation of first order, an important assumption for the validity of instruments based on the lag of regressors, as in the case of GMM-Sys used in the analysis. For the sake of synthesis, some regressions that showed similar results were omitted.
In Regression 8 on Table 2, ownership structure negati-vely influences efficiency in a subsequent period, showing that a 1% change in the ownership structure of the princi-pal shareholder adversely affects efficiency by 0.17% at a 10% significance level using the BCC method. In economic terms, for a one-standard-deviation difference of 0.09, the influence is 0.015%.
When the companies analyzed are considered sepa-rately, the number of directors (Regression 1) negatively influences efficiency, i.e., a 1% change in the number of directors adversely affects efficiency by 0.14% at a 10% significance level using the BCC method, and in econo-mic terms, a one-standard-deviation difference of 0.09 has an influence of 0.01%. This result is consistent with the studies of Jensen (1993) and Nanka-Bruce (2009),
which state that having a small board of directors can help to increase company performance, thus not rejec-ting Hypothesis 11. Combined analyses corroborate the assumptions of the model, although this variable is not significant in Regression 8. In terms of length of servi-ce, this variable negatively influences efficiency when considered separately (Regression 2), i.e., a 1% change in length of service adversely affects efficiency by 0.07% using the BCC method at a 10% significance level, and in economic terms, the influence of a one-standard-deviation difference of 0.04 is 0.003%, thereby rejecting Hypothesis 12. In contrast, in the two combined analy-ses (Regression 8 in Table 2 and Regression 9 in Table 3), this variable is positive and significant, thereby not re-jecting Hypothesis 12 and corroborating Adams (2009) and Faleye et al. (2011).
The age of directors positively influences efficiency (Regression 3) i.e., a 1% increase in the age of the direc-tors increases efficiency by 0.56% using the BCC me-thod at a 10% significance level, whereas in economic terms, the influence of a one-standard-deviation diffe-rence of 0.31 is 0.17%, thereby not rejecting Hypothesis 13. This analysis is consistent with Adams (2009), who argues that younger directors tend to have less influen-ce on the board, interact less with CEOs and, conse-quently, hinder information exchange between the par-ties, thus affecting efficiency.
In separate analyses, the number of independent di-rectors compared to the total number of didi-rectors (Re-gression 4) had a positive relationship with efficiency, i.e., a 1% increase in the proportion of independent directors on the board increases efficiency by 0.08% at a 5% significance level, and in economic terms, the in-fluence of a one-standard-deviation difference of 0.03 is 0.002%, thereby not rejecting Hypothesis 9. This re-sult is consistent with studies from Faleye, Hoitash, and Hoitash (2011), which state that independent directors are seen as valuable monitors and that their involvement with the board is normally related to improvements in a company’s accounting system and increased shareholder protection. The combined analyses are consistent with this result, and in Regression 9 in Table 3, this variable has a significance level of 1%.
Table 2 Analysis of the Board of Directors’ inluence on eficiency using the BCC method
Variables (1) (2) (3) (4) (5) (6) (7) (8)
BCC (-1) 0,33*** 0,24** 0,22*** 0,22** -0,01 0,28 0,27 -0,42
Z (2,57) (2,23) (2,72) (2,09) (-0,08) (0,82) (0,96) (-1,35)
PSV (-1) -0,17*
Z (-1,89)
ND -0,14* -0,24
Z (1,64) (-1,39)
TD -0,07* 0,09**
Z (-1,73) (2,10)
Variables (1) (2) (3) (4) (5) (6) (7) (8)
AD 0,56* 0,01
Z (1,81) (0,02)
ID 0,08** 0,04
Z (2,20) (0,55)
NEB -0,06* 0,12
Z (-1,65) (1,29)
CPB -0,24* 0,08
Z (-1,64) (0,94)
TUD 0,22** 0,01
Z (2,08) (0,12)
TA 0,15*** 0,18*** 0,13*** 0,12*** 0,15*** 0,01 -0,25 0,33**
Z (4,95) (4,92) (3,87) (4,01) (5,02) (0,04) (-1,34) (2,17)
L -0,01 -0,03 -0,01 -0,01 -0,07** -0,11 -0,13 0,08
Z (-0,13) (-0,76) (-0,30) (-0,34) (-2,10) (-0,96) (-1,43) (0,57)
Const. 0,89*** 1,65 -0,77 3,35 2,08*** 29,57 47,23 2,09
Z (1,95) (0,74) (-0,57) (1,27) (7,20) (0,57) (0,73) (1,50)
FE Ind. Yes Yes Yes Yes Yes Yes Yes Yes
TE Temp. Yes Yes Yes Yes Yes Yes Yes Yes
chi2 4331,49 341,91 1977,77 3374,40 2770,00 44,62 684,92 110,71
Hansen 11,15 12,31 13,93 7,52 2,48 15,08 8,37 0,00
ar1 -2,03 -2,44 -2,88 -2,48 -1,80 -1,40 -1,34 -1,94
ar2 1,43 0,87 -1,54 1,20 1,40 -0,99 0,17 0,68
Linear regression of the inluence of the board of directors on eficiency. The model is estimated using unbalanced panel data by GMM-Sys. The dependent variable is eficiency, calculated by DEA using the BCC model (variable returns to scale). The dependent variables used are the following: PSV - principal
shareholder with vote; ND - number of directors; TD - tenure of directors; AD - age of directors; ID - independent directors; NEB - number of executives on the board; CPB - chief executive as president of the board; and TUD - turnover of directors. The control variables used are the following: L - leverage; TA -
total assets; FE Ind. - industry ixed effects; and FE Temp. - temporary ixed effects (see Appendix A). * -10% signiicance level; ** -5% signiicance level; *** -1% signiicance level. Z indicates that the Z-statistic was used in the study. Chi2 represents the Chi-squared test, Hansen represents Hansen’s test, and AR represents the serial autocorrelation of irst and second-order residuals.
continued
In line with this theory, when considering the num-ber of executives on the board relative to the total number of directors, it is evident that this variable is negatively correlated with efficiency when considered separately (Regression 5). That is, a 1% increase in the proportion of the number of executives on the board decreases efficiency by 0.06% at a 10% significance le-vel, and in economic terms, a one-standard-deviation difference of 0.03 has a 0.002% influence, thereby not rejecting Hypothesis 6. This result is in line with Jensen (1993), Goyal and Park (2002), and Bebchuk and Fried (2003), who explain that executives’ influence on their own compensation, hiring, firing, and other factors can generate substantial costs for shareholders that can dis-tort incentives and damage corporate performance. This result corroborates the combined regression analysis of Regression 9 in Table 3, in which the result is negative at a 1% significance level.
Consistent with the previous results, the fact that the CEO is also chairman of the board of directors further negatively influences company efficiency when consi-dered separately (Regression 6). That is, if the company
chooses to seat the CEO as chairman of the board, effi-ciency decreases by 0.24% at a 10% significance level, and in economic terms, a one-standard-deviation di-fference of 0.16 has a 0.04% influence, thereby not re-jecting Hypothesis 6. This result is also corroborated by Regression 9 in Table 3, where this variable is nega-tive at a 1% significance level.
Table 3 Analysis of the inluence of executive compensation on eficiency using the GRS method
Variable (1) (2) (3) (4) (5) (6) (7) (8) (9)
GRS (-1) 0,50*** 0,22** 0,51*** -0,01 0,35*** 0,77*** 0,47*** -0,12 -0,44***
Z (6,33) (2,01) (6,59) (-0,03) (3,64) (8,58) (5,99) (-0,70) (-3,47)
FSV (-1) -1,01***
Z (-5,31)
NPE -0,11* -0,12** -0,72***
Z (-1,74) (-2,32) (-4,23)
AE 0,88** 0,47
Z (2,09) (0,80)
TD -0,05** 0,05*** 1,13***
Z (-1,93) (4,76) (5,61)
TUE -0,19** 0,16*** -0,58***
Z (-1,99) (4,14) (-5,94)
EIE 2,53* -9,84*** -0,55***
Z (1,78) (-13,54) (-19,30)
OE 0,03* -0,04 0,22***
Z (1,69) (-1,60) (5,77)
CE 0,07** -0,07*** 0,03***
Z (1,95) (-4,77) (11,50)
ND -2,77***
Z (-13,20)
TD 0,09***
Z (9,86)
ID 0,34***
Z (15,10)
NEB -1,46***
Z (-9,75)
CPB -1,62***
Z (-7,78)
TUD 0,11***
Z (2,53)
TA 0,10*** 0,16*** 0,05 0,08 -0,01 0,02 0,03 0,46***
Z (2,70) (3,21) (1,31) (0,65) (-0,05) (0,22) (1,09) (11,38)
L -0,04 -0,13*** -0,08 -0,04 -0,03 -0,02 -0,08** -0,70***
Z (-0,88) (-2,54) (-1,17) (-0,31) (-0,34) (-0,18) (-2,03) (-25,46)
Const. 0,69 -3,20 1,35** 1,04 3,39 0,50 1,91*** 1,84 11,99***
Z (1,27) (-1,57) (2,19) (0,13) (1,04) (0,38) (3,33) (1,27) (10,20)
FE Ind. Yes Yes Yes Yes Yes Yes Yes Yes Yes
FE Temp. Yes Yes Yes Yes Yes Yes Yes Yes Yes
chi2 8144,72 1026,61 1924,81 6055,82 1772,65 437,83 2504,11 3290,00 8170,00
Hansen 14,57 2,96 12,06 6,65 13,78 0,00 11,72 0,00 0,00
ar1 -1,16 -1,22 -2,00 -0,04 -2,10 -1,63 -2,33 -1,64 -1,32
ar2 -1,02 -1,33 -1,31 -0,46 -0,28 0,31 -0,44 0,90 -0,50
Linear regression for the inluence of executive compensation on eficiency. The model is estimated using unbalanced panel data by GMM-Sys. The de
-pendent variable is eficiency, calculated from DEA using the GRS model (total eficiency). The de-pendent variables used are the following: FSV - ive main
shareholders with a vote; ND - number of directors; TD - tenure of directors; AD - age of directors; ID - independent directors; NEB - number of executi-ves on the board; CPB - chief executive as president of the board; TUD - turnover of principal director; NPE - number of principal executiexecuti-ves; AE - age of executives; TE - tenure of executives; TUE - turnover of executives; EIE - equity interest of executives in the company; OE - options per executive; TC - total
compensation; and CE - compensation per executive. The control variables used are the following: L - leverage; TA - total assets; FE Ind. - industry ixed effects; and FE Temp. - temporary ixed effects (see Appendix A). * -10% signiicance level; ** -5% signiicance level; *** -1% signiicance level. Z indicates that the Z-statistic was used in the study. Chi2 represents the Chi-squared test, Hansen represents Hansen’s test and AR represents the serial autocorrelation of irst- and second-order residuals.
When considering the data for the executives (Table 3), ownership structure negatively influences efficiency du-ring a subsequent period, showing that a 1% change in the ownership structure of the top five shareholders negatively
affects efficiency by 1.01% at a 1% significance level, and in economic terms, at a one-standard-deviation difference of 0.19, this influence is 0.19%.
sepa-rately, the number of chief executives (Regression 1) negatively influences efficiency. That is, a 1% change in the number of chief executives negatively affects effi-ciency by 0.11% at a 10% significance level, and in eco-nomic terms, at a one-standard-deviation difference of 0.06, this influence is 0.007%, thereby not rejecting Hypothesis 8. The combined analyses corroborate the separate analysis (Regressions 8 and 9 of Table 3). This result is in line with Chen, Goldstein, and Jiang (2008), who claim that a large number of executives generate a larger monitoring effort.
In considering the age of the executives, when taken separately, this variable positively influences efficiency (Regression 2). That is, a 1% change in the age of top executives positively affects efficiency by 0.88% at a 5% significance level, and in economic terms, at a one-standard-deviation difference of 0.42, this influence is 0.37%, thereby rejecting Hypothesis 5. This result agrees with Jensen and Murphy (1990).
With respect to the average number of years that chief executives are in office, when analyzed separately, this variable negatively influences efficiency (Regression 3). That is, a 1% change in the tenure of the top exe-cutives negatively affects efficiency by 0.05% using the BCC method at a level of 5%, and in economic terms, at a one-standard-deviation difference of 0.02, this in-fluence is 0.001%, thereby not rejecting Hypothesis 7. This result is consistent with the studies of Goyal and Park (2002), who find a negative effect of tenure on the company because a long tenure may mean that the CEO has established a power base. The combined analyses did not corroborate this result.
In considering a change in company presidency, when taken separately, this variable negatively influences effi-ciency (Regression 4). That is, turnover of the chief exe-cutive adversely affects efficiency by 0.19% at a 5% level of significance, whereas in economic terms, a one-standard-deviation difference of 0.09 has a 0.02% influence, thereby not rejecting Hypothesis 4. This result is consistent with the studies of Jensen and Warner (1988), Gilson (1989), and Kaplan (1994b), who find that most companies turn over executives when they are in financial difficulty or bankruptcy. The combined analysis in Regression 9 corro-borates the results.
Regressions 5, 6, and 7 refer to explicit incentives that may exist. Taking into consideration executives’ equity interest (Regression 5), when taken separately, this variable positively influences efficiency. That is, a 1% increase in the equity interest of the major sha-reholders positively affects efficiency by 2.53% at a 10% significance level, and in economic terms, at a one-standard-deviation difference of 1.42, this influence is 3.59%, thus supporting Hypothesis 2. This result is in line with Jensen and Murphy (1990), Ghosh (2007), and Fahlenbrach and Stulz (2009), among others, who show that if executives have partial ownership, they have in-centives to reduce agency problems. However, these results are not corroborated by the combined analysis,
where this variable is negative and significantly related with efficiency (Regressions 8 and 9).
“Options” (namely, the right to buy shares at a “stri-ke price”) may be offered to the executives until a spe-cified date. The choice of options as an incentive for CEOs, when analyzed separately, positively influences efficiency. That is, a 1% increase in the choice of op-tions positively affects efficiency by 0.03% at a 10% significance level, and in economic terms, at a one-standard-deviation difference of 0.02, this influence is 0.0006%, thus not rejecting Hypothesis 3. The combi-ned analysis in Regression 9 corroborates the separate analysis. This result is in line with Slovin and Sushka (1993), Ghosh and Ruland (1998), Hall and Liebman (1998), and Fahlenbrach and Stulz (2009), who identify options as incentives for executives to pursue higher company performance.
Finally, for executive compensation in Regression 7, a 1% increase in this variable positively affects efficiency by 0.07% at a 5% significance level using the GRS me-thod, and in economic terms, at a one-standard-devia-tion difference of 0.03, this influence is 0.002%. These results are in agreement with the combined analysis in Regression 9, thereby corroborating Hypothesis 1. This relationship is consistent with the studies of Jensen and Murphy (1990) and Kaplan (1994a), who shows that executive compensation may positively impact both shareholder wellbeing and company performance be-cause it generates incentives for executives to resolve agency problems. The negative sign and significance of this variable in Regression 8 indicates the possibi-lity that this result may be ambiguous, as described by Baker et al. (1988), who show that if compensation is not performance-related, there are few incentives for executives to structure and strengthen contracts to ma-ximize corporate value.
In terms of control variables, those relating to size, represented by total assets, showed a positive rela-tionship with efficiency and were only significant in Regressions 1, 2, 3, 4, 5 and 8 of Table 2 and in Regres-sions 1, 2 and 8 of Table 3. The variable referring to leverage was negatively related to efficiency in virtually all analyses but was only significant in Regression 5 of Table 2 and in Regressions 2, 7 and 8 of Table 3 becau-se, according to Boubakri and Cosset (1998), there is a tendency for leverage to decrease as efficiency increa-ses because an increase in debt can hinder the efficient allocation of resources. Finally, temporal and industry dummy variables were used in all regressions. The lag-ged dependent variable was positive and significant in most analyses, showing that in those regressions, com-pany efficiency during one period influences efficiency during a later period.
gover-nance were made explicit. The first analysis shown was calculated by maximum likelihood using the truncated normal regression without considering the 100%
effi-cient observations (TR - E), whereas the second was calculated using truncated regression but using 2,000 bootstrap replications.
Table 4 Algorithm from Simar and Wilson (2007) to correct bias in truncated variables
Inluence of board of directors on eficiency
ND TD AD ID NEB CPB TUD
TR - E 0,0045 -0,0506** 0,3288** 0,0035 -0,0659* -0,0145 0,0346
t (0,0900) (-2,1100) (2,0800) (0,2800) (-1,7900) (-0,4800) (0,8400)
Bootstrap 0,0415 -0,0664** 0,2522 0,0048 -0,0800* 0,0056 0,0407
Z (0,6900) (-2,3100) (1,1700) (0,4800) (-1,7300) (0,1500) (0,9700)
Corr. bias -0,0325 -0,0348 0,4054 0,0023 -0,0518 -0,0346 0,0284
Var. Rel. 822,22% 31,23% -23,30% 37,14% 21,40% -138,62% 17,63%
lag and VC Yes Yes Yes Yes Yes Yes Yes
FE I and T Yes Yes Yes Yes Yes Yes Yes
Inluence of executive compensation on eficiency (GRS)
NCE AE TE TUE EIE OE CE
TR - E -0,0441 -0,4405*** -0,0438** -0,0373 0,2551 0,0523*** -0,0219
t (-0,7400) (-2,6700) (-1,9700) (-0,8800) (0,6900) (3,7000) (-0,9400)
Bootstrap -0,0496 0,1199 -0,0384* -0,0709* 0,0140 0,0528** -0,0457*
Z (-1,0000) (0,5400) (-1,7800) (-1,7000) (0,0200) (2,3500) (-1,6900)
Corr. bias -0,0386 -1,0009 -0,0492 -0,0037 0,4963 0,0517 0,0020
Var. Rel. 12,47% -127,22% -12,33% 90,08% -94,51% 0,96% 108,68%
lag and VC Yes Yes Yes Yes Yes Yes Yes
FE I and T Yes Yes Yes Yes Yes Yes Yes
The estimated model was performed in two stages for bias correction, as proposed by the algorithm from Simar and Wilson (2007). The irst regression presented was calculated by maximum likelihood using truncated normal regression without considering the 100% eficient observations (TR - E), whereas
the second was calculated using truncated regression but with 2,000 bootstrap replications. Bias correction was performed using the formula .
Finally, relative bias was calculated between the two regressions shown. The dependent variable of eficiency was calculated by DEA using the BCC (variable returns to scale) model for variables related to the board and the GRS (total eficiency) model for variables related to executive compensa -tion (using the same logic as Tables 2 and 3). The dependent variables used are the following: ND - number of directors; TD - tenure of directors; AD - age of directors; ID - independent directors; NEB - number of executives on the board; CPB - chief executive as president of the board; TUD - turnover of principal director; NPE - number of chief executives; AE - age of executives; TE - tenure of executives; TUE - turnover of executives; EIE - equity interest of executives in the company; OE - options per executive; and CE - compensation per executive. The control variables used are
the following: L - leverage; TA - total assets; and FE I and T - industry and temporal ixed effects (see Appendix A). A lagged dependent variable was used as explanatory in the model (Lag).* - 10% signiicance level; ** - 5% signiicance level; *** - 1% signiicance level. The applied tests were the student’s t-test for the irst regression and the Z-test for the second. Four digits are used after the decimal point to correctly visualize the relative bias
of the variables.
θk = 2θk -θk
~ *
Finally, correction bias was performed, and the relative bias between the two regressions shown was calculated. In almost all analyses, the bias was greater than 1%. Howe-ver, the results were qualitatively similar to those found in previous regressions, even though some were not statisti-cally significant, as in the case of the variables “board size”, “number of independent directors”, “chief executive on the
5 ConCluSIonS AnD ConTRIBuTIonS of ThE STuDy
Because the possibility of questionable performance by executives is large, in practice, implicit and explicit incentives can generate value creation for the company. For this reason, it is important to analyze the influence of these incentives on efficiency. With respect to exe-cutive compensation, this variable was positive when analyzed separately, thereby not rejecting Hypothesis 1. This relationship is consistent with the studies of Jensen and Murphy (1990) and Kaplan (1994a), who show that executive compensation can positively im-pact shareholder wellbeing and company performance of the company because it provides the executive with incentives to resolve the agency problem.
Taking into consideration executives’ equity interest, this variable positively influences efficiency when con-sidered separately, thereby not rejecting Hypothesis 2. This result is in line with Jensen and Murphy (1990), Ghosh (2007), and Fahlenbrach and Stulz (2009), among others, who find a strong positive relationship between performance and executive compensation, resulting pri-marily from shares owned by CEOs that create incenti-ves to reduce agency problems because executiincenti-ves with part ownership will be more likely to generate profit for the company. The choice of options as an incentive for CEOs was also significant, thereby not rejecting Hypo-thesis 3 and corroborating studies of Sushka and Slovin (1993), Ghosh and Ruland (1998), Hall and Liebman (1998), and Fahlenbrach and Stulz (2009), which identi-fied that options are incentives for the executive to seek higher company performance.
Considering implicit incentives, a change in com-pany presidency negatively influences efficiency, there-by not rejecting Hypothesis 4 but rejecting Hypothesis 4A. This result is consistent with the studies of Jensen and Warner (1988), Gilson (1989), and Kaplan (1994b), who find that most companies turn over executives when they are in financial difficulties or bankruptcy. In contrast, the age of executives positively influences efficiency, rejecting Hypothesis 5. This result agrees with studies of Jensen and Murphy (1990) suggesting that the risk of dismissal is more pronounced for youn-ger CEOs. The lonyoun-ger an executive is at a company, the greater the possibility of creating ties, becoming entrenched in the job, and earning incentives. In the analysis using the algorithm from Simar and Wilson (2007), this variable was negative and significant, cor-roborating those authors.
In line with this theory, the number of executives on the board relative to total number of directors is nega-tively correlated with efficiency, thereby not rejecting Hypothesis 6. This result is in line with Jensen (1993), Goyal and Park (2002), and Bebchuk and Fried (2003), who explain that executives’ influence on their own pay, hiring, and firing, among others, can generate substan-tial costs for shareholders that can distort incentives and hurt corporate performance. Confirming previous
results, a CEO simultaneously serving as chairman of the board of directors further negatively influences company efficiency.
In the companies analyzed, the average number of years of CEO tenure negatively impacts efficiency, the-reby not rejecting Hypothesis 7. This result is consis-tent with studies by Goyal and Park (2002), which show a negative effect of tenure because a long tenure may mean that the CEO has established a power base. The combined analyses do not corroborate this result. The number of top executives negatively affects efficiency, thereby not rejecting Hypothesis 8. This result is in line with Chen et al. (2008), who claim that a large number of executives also generates a greater monitoring effort because the greater the number of executives, the grea-ter the oversight by directors.
Analyzing the issues related to monitoring, the number of independent directors compared to the to-tal number of directors had a positive relationship with efficiency, thereby not rejecting Hypothesis 9 but rejec-ting Hypothesis 9A. This result is consistent with Faleye et al. (2011), who state that independent directors are seen as valuable monitors and that their involvement with the board is usually related to improvements in the company’s accounting system and greater sharehol-der protection.
In the case of chairman turnover, this variable po-sitively influences efficiency in virtually all the results, thereby not rejecting Hypothesis 10 and rejecting Hy-pothesis 10A. This result is consistent with Agrawal et al. (1999), who show that fraud scandals can create incentives to change the board of directors for the pur-pose of increasing company performance through in-creased monitoring and hiring of directors with better reputations.
in-formation exchange between the parties, thus affecting efficiency.
Many of the hypotheses were confirmed, thus sho-wing the particular conditions of corporate finance in Brazil with respect to corporate governance. The im-maturity of the Brazilian capital market, identified by Aldrighi and Mazzer (2007), is perceived in various analyses, highlighting that the history of the Brazilian corporate system is one of the factors limiting the effi-ciency of companies. The prevailing conditions are as follows: (i) high ownership-management overlap; (ii) boards with low effectiveness; (iii) in family groups, the poor definitions of the roles of stockholders, bo-ards and management; (iv) the lack of clarity about the cost-benefit relationship of good governance; (v) ine-fficiency of the boards of directors and (vi) evidence of conflicts of interest, diminished by explicit and implicit incentives. In the same context, Ferreira (2012), by tes-ting whether companies listed on the corporate gover-nance segment are more efficient than companies listed on the traditional market, finds no evidence to corro-borate that statement. Macedo and Corrar (2012) find superior performance for companies in the electricity distribution sector in Brazil only in 2005 and do not find superior performance for companies with better corporate governance practices in subsequent years.
Studies in other countries have also analyzed the in-fluence of corporate governance on technical efficiency but have found a positive relationship between these variables. Luo and Yao (2010) have found that Chinese banks, seeking to increase governance and efficiency levels, significantly increased their efficiency even af-ter a crisis due to diversification of ownership structu-re. Zheka (2005) and Zelenyuk and Zheka (2006) also
have found a positive impact of the quality of corporate governance on the efficiency of Ukrainian companies. Delmas and Tokat (2005) have found that the market deregulation process has a negative effect on the pro-duction efficiency of U.S. electric companies but that some types of governance structures can adapt to the uncertainty of regulation by using different mechanis-ms. To investigate the strengths and weaknesses of the German corporate governance system, in which banks and insurance companies predominate as major sha-reholders and labor unions have board representation, Frick and Lehmann (2005) have identified that this system can benefit governance processes and increase company performance. Along the same lines, Lehmann, Warning, and Weigand (2004) have found that the per-formance of German companies makes a significant contribution to explaining differences in profitability among companies. Seeking to analyze the relationship between corporate governance and efficiency in Italian manufacturing companies, Destefanis and Sena (2007) have identified a positive impact on the ownership structure of the largest shareholders.
This study has some limitations: (i) the DEA works with a measure of relative efficiency, which may distort the analysis, but the issue of truncated variables was re-solved by bias correction using the algorithm proposed by Simar and Wilson (2007), whose results are qualitati-vely similar; (ii) the relationship among the variables in the model can be endogenous; (iii) the sample obtained for calculating the aspects of governance is very small; and (iv) some results presented in Regressions 8 of Ta-bles 2 and 3 were not in line with the other results due to possible endogeneity of the governance variables, which may generate distortions in the study.
Adams, R. B. (2009). Asking directors about their dual roles. Working Paper, University of Queensland.
Adams, R. B., & Ferreira, D. (2007 February). A theory of friendly boards.
Journal of Finance, 62 (1), 217-250.
Agrawal, A., Jafe, J. F., & Karpof, J. M. (1999). Management turnover and governance changes following the revelation of fraud. Journal of Law
and Economics, 42 (1), 309-342.
Aldrighi, D. M., & Mazzer, R. (2007 abril/junho). Evidências sobre as estruturas de propriedade de capital e de voto das empresas de capital aberto no Brasil. Revista Brasileira de Economia, 61 (2), 129-152. Almeida, H., Campello, M., & Galvão, A. F. (2010 September).
Measurement errors in investment equations. Review of Financial
Studies, 23 (9), 3279-3328.
Arellano, M., & Bond, S. (1991 April). Some tests of speciication for panel data: Monte Carlo evidence and an application to employment equations. Review of Economic Studies, 58 (2), 277-297.
Arthaud-Day, M. L., Certo, S. T., Dalton, C. M., & Dalton, D. R. (2006). A changing of the guard: executive and director turnover following corporate inancial restatements. Academy of Management Journal, 49 (6), 1119-1136. Babenko, I. (2009 February). Share repurchases and pay-performance
sensitivity of employee compensation contracts. Journal of Finance, 64
(1), 117-151.
Baker, G. P., Jensen, M. C., & Murphy, K. J. (1988 July). Compensation and incentives: practice vs. theory. Journal of Finance, 43 (3), 593-616. Beasley, M. S. (1996 October). An empirical analysis of the relation
between the board of director composition and inancial statement fraud. Accounting Review, 71 (4), 443- 465.
Bebchuk, L. A., & Fried, J. M. (2003). Executive compensation as an agency problem. Journal of Economic Perspectives, 17 (3), 71-92. Belkaoui, A., & Pavlik, E. (1992 August). he efects of ownership
structure and diversiication strategy on performance. Managerial and
Decision Economics, 13 (4), 343-352.
Bennett, M. J. (2010). Does ownership structure afect corporate performance? Evidence from the market for asset sales. he IUP
Journal of Corporate Governance, 9 (1-2), 57-98.
Bergstresser, D., & Philippon, T. (2006 June). CEO incentives and earnings management. Journal of Financial Economics, 80 (3), 511-529. Berle, A., JR., & Means, G. (1932). he modern corporation and private
property. Chicago: Commerce Clearing House.
Bertrand, M., & Mullainathan, S. (2001 August). Are CEOs rewarded for luck? he ones without principals are. Quarterly Journal of Economics, 116 (3), 901-932.
Boubakri, N., & Cosset, J. C. (1998 June). he inancial and operating performance of newly privatized irms: evidence from developing countries. Journal of Finance, 53 (3), 1081-1110.
Boyer, M. M., & Ortiz-Molina, H. (2008 May). Career concerns of top executives, managerial ownership and CEO succession. Corporate
Governance: An International Review, 16 (3), 178-193.
Brick, I. E., & Chidambaran, N. K. (2010 September). Board meetings, committee structure, and irm value. Journal of Corporate Finance, 16
(4), 533-553.
Bulan, L., Sanyal, P., & Yan, Z. (2010 July/August). A few bad apples: an analysis of CEO performance pay and irm productivity. Journal of
Economics and Business, 62 (4), 273-306.