Harmonic Analysis of Multipath Index Time Series in GPS Stations
†E.M. SOUZA1*, D.B.M. ALVES2 and F.L. SCHUMACHER3
Received on May 16, 2014 / Accepted on February 23, 2015
ABSTRACT.The identification of the cyclical and seasonal variations can be very important in time series. In this paper, the aim is to identify the presence of cyclical or seasonal variations in the indices of the multipath effect on continuous GPS (Global Positioning System) stations. Due to the model used to obtain these indices, there should not have cyclical variations in these series, at least due to the multipath effect. In order to identify the presence of cyclical variations in these series, correlograms and Fourier periodograms were analyzed. The Fisher test for seasonality was applied to confirm the presence of statistical significant seasonality. In addition, harmonic models were adjusted to check in which months of the year the cyclical effects are occurring in the multipath indices. The possible causes of these effects are pointed out, which will direct the upcoming investigations, as well as the analysis and correlations of other series. The importance of this analysis is mainly due to the fact that errors in the collected signals of these stations will directly influence the accuracy of the results of the whole community that directly or indirectly uses GPS data.
Keywords:harmonic analysis, multipath index, time series.
1 INTRODUCTION
Data from GNSS (Global Navigation Satellite Systems), or specially, GPS system are affected by several errors, which may occur on satellite, signal propagation, and receiver or ground station. Most of these errors can be eliminated, reduced or modeled, depending on the applied position-ing method or desired accuracy. One of the most used positionposition-ing methods is the relative one, where is possible to estimate a receiver position in relation to a reference station (generally this reference station belongs to a continuous monitoring network). Applying relative positioning, most of the errors are eliminated, depending on receiver’s distance. But, there is a kind of error that is not eliminated, the multipath effect. This error occurs because reflected signals arrive to
*Corresponding author: Eniuce Menezes de Souza
†Grateful to CNPq for the processes 473973/2012-0 and 303079/2011-8 and FAPESP 2012/19906-7.
1Department of Statistics, UEM – Maring´a State University, Av. Colombo, 5790, 87020-900 Maring´a, PR, Brazil. E-mail: [email protected]
2Cartography Department, UNESP – S˜ao Paulo University, Rua Roberto Simonsen, 305, 19060-900Presidente Prudente, SP, Brazil. E-mail: [email protected]
the receiver antenna together the direct one. Antenna can receive signals reflected in neighboring surfaces (indirect), like buildings, cars, trees, water etc. Therefore, the received signals can be composed by direct and indirect signals and introduce distortions in signal and its modulation [8]. Multipath modeling is very difficult because it depends on physical conditions of each receiver’s location. So the ideal is to collect the data avoiding such effect, but in many times this is not possible.
After data collection, we can estimate some indices that can represent multipath effect, indicating its presence in the data. One of these is the Multipath (MP) index, which is obtained from linear combinations of GPS signals. The development and details concerning this index can be found in [8] and [6].
When data from continuous monitoring stations are used, mainly as base station in relative po-sitioning, it is expected a minimum of multipath effect, because these stations are, theoretically, well located in places without obstructions. Otherwise, if there is multipath presence in a ref-erence station, this error will affect directly the user positioning. Therefore, in this paper, the main goal is to evaluate the existence and magnitude of multipath in continuous monitoring sta-tions from temporal series of MP index, which also provides information about data quality. Furthermore, we aim to verify which events can influence the index values, and to investigate the presence of cyclic variations and seasonality statistically significant in the series. In this investigation, the multipath repeatability will be very useful to prove the multipath presence. This repeatability occurs because if the receiver remains stopped and the environment nearby remains unchanged, the multipath effect should repeat every day according to the satellite move-ment. Thus, behaviors or periodicities beyond the multipath repeatability might indicates other effects influencing the MP calculus, or in other words, been taken into account together with multipath effect.
An important effect that can influence the MP index series and motivates this investigation is related to ionospheric irregularities, called ionospheric scintillation ([3], [4]). This effect can be described as a fast change in phase and amplitude of GPS signal, caused by irregularities of electron density. Scintillation can degrade or cause the GPS signal lost. The Brazilian territory is one of the most affected regions of the Earth, with high scintillation activity in sunset hours. Ionospheric scintillation occurs mainly around the peak of the 11-year ionosphere solar cycle and the most affected months are March, April, September and October, near equinox.
Thus, Section 2 presents how to build the harmonic models to investigate the cyclic variations of this time series. The results and analysis are discussed in Section 3. Finally, the concluding remarks are presented in Section 4.
2 INVESTIGATING CYCLIC VARIATIONS
years. The analysis of the autocorrelation function (ACF) or correlogram is useful in identifying the presence of autocorrelation, however its correct interpretation is one of the most difficult tasks in time series [2]. In that sense, particularly for investigation of periodicities, harmonic analysis and Fourier periodogram can be very helpful. The harmonic analysis is historically known for allowing the investigation of “hidden” periodicities in time series. In usual regression models in the form:
Yt =µt+εt, (2.1)
whereµt is a deterministic function and {εt}is a sequence of independent white noise ofYt , with mean zero and varianceσε2[5], seasonality or cyclical effects can be incorporated via cosine functions:
µt =δcos(2π ωt+φ), (2.2)
whereδ > 0 is the amplitude,ω is the frequency andφ, which follows uniform distribuition φ ∼ U(−π, π ), is the curve phase. Ast varies, the curve oscillates between the maximumδ and minimum−δ. Since the curve repeats itself exactly every 1/ωtime units, 1/ωis called the period of the cosine curve. However, equation(2.2)is not appropriate because the nonlinearity of the parametersδandφ. Hence it is convenient to use the reparametrization:
δcos(2π ωt+φ)=α1cos(2π ωt)+β1sin(2π ωt), (2.3)
whereδ=α12+β12,=arctan(−β1/α1),α1=δcos and β1= −δsin.
Then for a fixed frequencyωwe can use cos(2π ωt)and sin(2π ωt)as predictor variables and adjust theαjandβj by the least squares method (LSM). The model can thus be written as:
µt =β0+α1cos(2π ωt)+β1sin(2π ωt). (2.4)
where the constant termβ0can be interpreted as a cosine with frequency equal to zero.
In this sense we could write the decomposition ofYt in terms of periodic functions. Thus the general linear combination ofmcosine curves with arbitrary amplitudes, frequencies and phases can be written as:
Yt =β0+
m
j=1
αjcos(2π ωjt)+βjsin(2π ωjt). (2.5)
Although theαj andβj can be estimated by the LSM, for some frequencies the procedure is simplified. Ifn is odd we haven = 2k+1 and the sine and cosine predictor variables with frequency 1n,n2, . . . ,kn, wherenk can be written as 12−21n, are orthogonal, beyondω=0. These frequencies are called Fourier frequencies and
ˆ
β0= ¯Y =
1 n
n
t=0
Yt,αjˆ = 2 n
n
t=1
Ytcos
2πj t n
andβˆj = 2 n
n
t=1
Ytsin
2πj t n
. (2.6)
of the harmonicδj in (2.3) is given bynδ2j/2, which is the known Fourier periodogram [2, 5]. Therefore:
I j
n
=
nαˆ2j + ˆβ2j
2 , (2.7)
for j=1, . . . ,kifnis even and j =1, . . . ,k−1 ifnis odd. Actually, other representations for the periodogram can be constructed, but the meaning is the same.
The idea of locating hidden frequencies or periodicities in time series comes from repeating the analysis in (2.3) for all frequencies 1n, . . . ,nk, correlating them with the series for a intensity measure. In other words, quantifying the importance of each frequency to the series in question.
By adjusting a model for the Fourier frequencies we have the harmonic analysis. If the series can be considered deterministic with periodicityS, then the harmonic model in equation (2.5) can be adjusted for j=1, . . . ,S/2 [7].
Even ifαj andβj were null for all j, it is possible that peaks occur on the ordinate of the periodogram due to random fluctuations. Thus, to verify whether the periodicity is significant or not, assuming that the processYt is Gaussian, Fisher shows a procedure to test the hypothesis H0:αj =βj =0∀j (there is no periodicity) based on the statistic:
gobs =
maxInj
[K]
j=1I
j n
, (2.8)
where[K] = kifn is even and[K] = k−1 ifn is odd [7]. Fisher showed that fornodd the exact distribution ofgobs, underH0, is given by:
P(g>a)=m(1−a)m−1−
m
2
(1−2a)m−1+. . .+(−1)x m
x
(1−xa)m−1, (2.9)
wherem= [K]andxis the largest integer smaller than 1ax=1a . The expression given in (2.9) can be approximated using only the first term of the expansion, that is:
P(g>a)∼=m(1−a)m−1. (2.10)
For a given significance levelα, we can find the critical valuea(α)such thatP(g >a(α))=α. If the observed value of the statistic (gobs) is greater thana(α)we must rejectH0, which means
that there is a periodicity. Substitutingaforgobsthe approximate testp-value can be found.
3 RESULTS
software change occured in this period for this station. More details and the time series for other RBMC stations can be seem in [1].
The TEQC software (http://facility.unavco.org/software/teqc/) was used to obtain the MP daily indices of the station, with data from 2006 to 2012. All the other analyzes were performed in R software (http://cran.r-project.org/).
Figure 1 shows the MP time series of the POLI station and their respective ACF.
Figure 1: Top: MP time series of the POLI station. The red solid lines indicates the beginning of October. The red dashed lines indicates the end of March. Bottom: Autocorrelation function (ACF).
It is possible to see in Figure 1 that from beginning of October (red solid line) to the end of March(red dashed line), the effects are more intense. We can also note two peaks per year, which occurs in this period, around March and October. Furthermore, the magnitude of these peaks is increasing with time. The presence of effects that are repeated every year in the time series can also be seen in ACF (Fig. 1, bottom). To confirm such seasonalities, which refer to the presence of effects that are being repeated in periods of 12 months, the Fourier periodogram was estimated and the result is shown in Figure 2.
In Figure 2 one can notice a peak in blue, which occurs at the frequency 0.002734375 and represents a periodicity of 365 days(=1/0.002734375). The red line is indicating exactly this frequency, which coincides with the estimated (in blue). So we can confirm the seasonality by Fourier periodogram. Concerning to the Fisher periodicities test, from equation (2.8) is obtained gobs =0.25. By equation (2.10) we have P(g >gobs) < 0.0001. Therefore we reject H0, i.e.
0.0 0.1 0.2 0.3 0.4 0.5
0246
Freq
P
er
iodogr
am 12 months
Time
MP POLI
2007 2008 2009 2010 2011 2012 2013
0.2
0.4
0.6
0.8
1.0
1.2 POLI
Model 1 Model 2
Figure 2: Top: Fourier periodogram for time series MP for POLI. Bottom: Time series of MP for station POLI and the estimated harmonic models.
Although the presence of seasonality has been confirmed, it is still necessary to identify its be-havior, indicating the times when its effect is more expressive. In this sense, the Fourier harmonic modeling presented in Section 2 is quite useful. In Figure 2 adjustments of two harmonic mod-els for the MP of POLI station are illustrated. Model 1 considers the series with deterministic seasonality of 365 days (green) and model 2 was adjusted for Fourier frequencies without con-sidering deterministic seasonality (black).
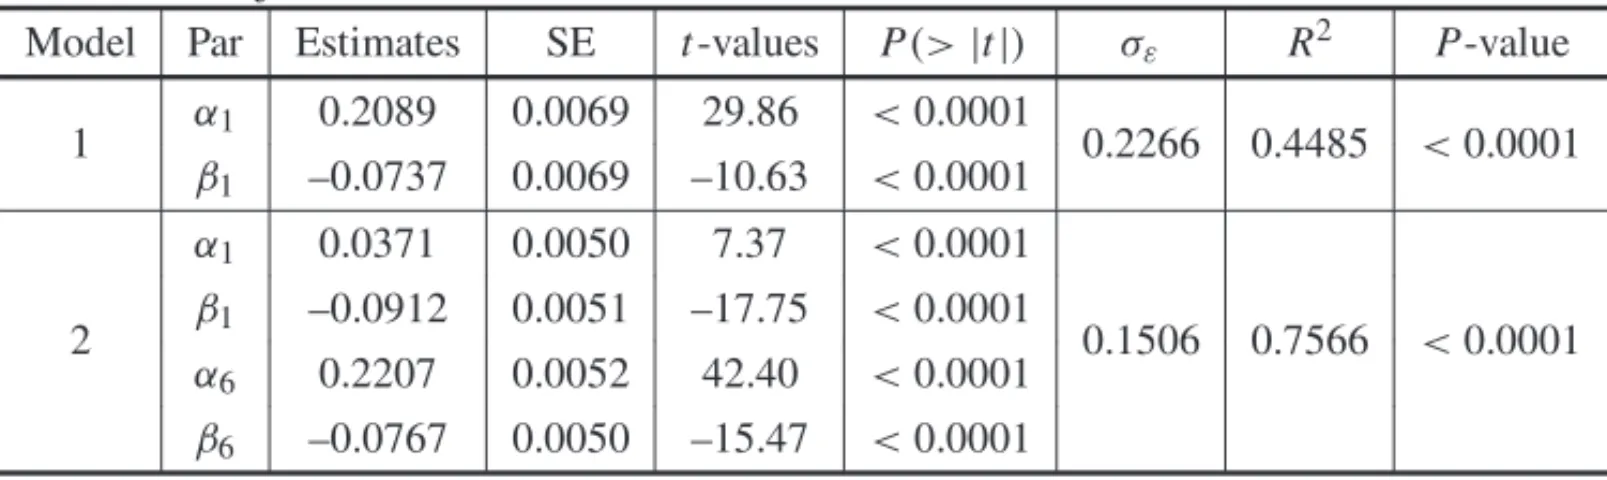
The main harmonic in the model 1 occurs in j =1, with frequency 1/365=0.002734375 and amplitudeδ1 = α12+β12 = 0.04364+0.00544= 0.04908. This harmonic is responsible for
71.64% of the variance of the series. In model 2 various components of frequency contribute to the variance of the series. The most important harmonic in model 2 has amplitudeδ=0.04871+
0.00588=0.05459. This harmonic along with the annual harmonic contribute with 84.86% of the variance of the series.
Table 1: Adjusts of the harmonic models for time series of the MP for the POLI station. Model Par Estimates SE t-values P(>|t|) σε R2 P-value
1 α1 0.2089 0.0069 29.86 <0.0001 0.2266 0.4485 <0.0001
β1 –0.0737 0.0069 –10.63 <0.0001
2
α1 0.0371 0.0050 7.37 <0.0001
0.1506 0.7566 <0.0001 β1 –0.0912 0.0051 –17.75 <0.0001
α6 0.2207 0.0052 42.40 <0.0001
β6 –0.0767 0.0050 –15.47 <0.0001
4 CONCLUDING REMARKS
The positioning performed using data from continuous monitoring stations has been much employed in recent years. In order to evaluate the quality of data from these stations were generated and evaluated MP time series data of POLI station of the RBMC.
Only with the time series graph it was noticeable variations that repeat periodically. To evaluate this phenomenon more effectively, correlograms, periodograms and harmonic adjusts of the se-ries were analyzed. With the results presented in Figures 1 and 2 the seasonality became clear. To confirm the seasonality, Fisher’s exact test was performed, where it was possible to verify the presence of statistically significant seasonality. Moreover, by harmonic adjustments that consider or not deterministic seasonality, it was possible to identify peaks in March and October. The fact that these peaks are in the months of March and October coincides with recent research related to the effects of ionospheric scintillation, which has been more intense in those months. It is expected that non-modeled effects can be absorbed in the calculation of these indices, which ex-plains the appearance of the seasonal effect on the index studied. These results will direct future research towards the correction of the effect of ionospheric scintillation.
RESUMO. A identificac¸˜ao de variac¸ ˜oes c´ıclicas e sazonais ´e muito importante em s´eries temporais. Neste artigo, objetiva-se identificar a presenc¸a de variac¸ ˜oes c´ıclicas e sazonais nos ´ındices do efeito do multicaminho em estac¸˜oes GPS (Global Positioning System) de moni-toramento cont´ınuo. Devido ao modelo usado na obtenc¸˜ao de tais series, n˜ao deveriam existir variac¸ ˜oes c´ıclicas nas mesmas, pelo menos devido ao multicaminho. No sentido de identificar
a presenc¸a de variac¸˜oes c´ıclicas nestas s´eries, foram analisados correlogramas e periodogra-mas de Fourier. Para confirmar a presenc¸a de sazonalidade estatisticamente significativa, foi utilizado o teste de Fisher para sazonalidade. Al´em disso, modelos harmˆonicos foram ajus-tados para verificar em que meses do ano os picos dos efeitos c´ıclicos est˜ao ocorrendo. As
poss´ıveis causas dos efeitos s˜ao apontadas, as quais direcionar˜ao investigac¸˜oes futuras, bem como a an´alise e correlac¸˜oes com outras s´eries. A importˆancia desta an´alise se deve princi-palmente ao fato de que erros nos sinais coletados afetar˜ao a acur´acia dos resultados de toda a comunidade que usam dados GPS diretamente ou indiretamente.
REFERENCES
[1] D.B.M Alves, E.M. Souza, V.Y. Kaneshiro & J.S. Souza. An´alise de s´eries temporais de multicami-nho em estac¸˜oes de monitoramento cont´ınuo.Boletim de Ciˆencias Geod´esicas,19(2013), 353–373.
[2] C. Chatfield. The Analysis of Times Series: An Introduction. Chapman and Hall: London (1995).
[3] R.S. Conker, M.B. El-Arini, C.J. Hegarty & T. Hsiao. “Modeling the Effects of Ionospheric Scintil-lation on GPS/Satellite-Based Augmentation System Availability”.Radio Science,38(2003).
[4] R. Tiwari, S. Skone, S. Tiwari & H.J. Strangeways. 3WBMod Assisted PLL GPS Software Re-ceiver for Mitigating Scintillation Affect in High Latitude Region. IEEE, 2011. Dispon´ıvel em:
<http://www.ursi.org/proceedings/procGA11/ursi/FG-4.pdf>. Acesso em: out. 2012.
[5] J.D. Cryer & K.S. Chan. Time Series Analysis: With Applications in R, Springer Texts in Statistics (2008).
[6] L.H. Estey & C.M. Meertens. TEQC: The multi-purpose toolkit for GPS/GLONASS Data.GPS Solutions,3(1) (1999), 42–49.
[7] P.A. Morettin & C.M.C. Toloi. An´alise de S´eries Temporais. Edgar Blucher: S˜ao Paulo (2004).