1Departamento de Geofísica,Instituto de Astronomia, Geofísica e Ciências Atmosféricas, Universidade de São Paulo (USP). E-mails: [email protected], frankb@ iag.usp.br, [email protected]
2Géosciences Environnement Toulouse (GET), Université de Toulouse, Observatoire Midi-Pyrénées, Toulouse, France. E-mail: [email protected]
*Corresponding author.
Manuscript ID: 20160055. Received in: 04/15/2016. Approved in: 05/05/2016. ABSTRACT: In the last decade, the participation of the Amazonian Craton on Precambrian supercontinents has been clariied thanks to a wealth of new paleomagnetic data. Paleo to Mesoproterozoic pale-omagnetic data favored that the Amazonian Craton joined the Co-lumbia supercontinent at 1780 Ma ago, in a scenario that resembled the South AMerica and BAltica (SAMBA) coniguration. hen, the mismatch of paleomagnetic poles within the Craton implied that ei-ther dextral transcurrent movements occurred between Guiana and Brazil-Central Shield after 1400 Ma or internal rotation movements of the Amazonia-West African block took place between 1780 and 1400 Ma. he presently available late-Mesoproterozoic paleomagnetic data are compatible with two diferent scenarios for the Amazonian Craton in the Rodinia supercontinent. he irst one involves an obli-que collision of the Amazonian Craton with Laurentia at 1200 Ma ago, starting at the present-day Texas location, followed by transcurrent mo-vements, until the inal collision of the Amazonian Craton with Baltica at ca. 1000 Ma. he second one requires drifting of the Amazonian Craton and Baltica away from the other components of Columbia after 1260 Ma, followed by clockwise rotation and collision of these blocks with Laurentia along Grenvillian Belt at 1000 Ma. Finally, although the time Amazonian Craton collided with the Central African block is yet very disputed, the few late Neoproterozoic/Cambrian paleomagne-tic poles available for the Amazonian Craton, Laurentia and other West Gondwana blocks suggest that the Clymene Ocean separating these blocks has only closed at late Ediacaran to Cambrian times, after the Amazonian Craton rifted apart from Laurentia at ca. 570 Ma. KEYWORDS: Amazonian Craton; paleomagnetism; superconti-nents; Columbia; Rodinia; Gondwana.
RESUMO: Dados paleomagnéticos obtidos para o Cráton Amazôni-co nos últimos anos têm Amazôni-contribuído signiicativamente para elucidar a participação desta unidade cratônica na paleogeograia dos superconti-nentes pré-cambrianos. Dados paleomagnéticos do Paleo-Mesoprotero-zoico favoreceram a inserção do Cráton Amazônico no supercontinente Columbia há 1780 Ma, em um cenário que se assemelhava à conig-uração “South AMerica and BAltica” (SAMBA). Estes mesmos dados também sugerem a ocorrência de movimentos transcorrentes dextrais entre os Escudos das Guianas e do Brasil-Central após 1400 Ma, ou que movimentos de rotação do bloco Amazônia-Oeste África ocorreram dentro do Columbia entre 1780 e 1400 Ma. Os dados paleomagnéticos atualmente disponíveis do inal do Mesoproterozoico são compatíveis com dois cenários diferentes para a Amazônia no supercontinente Rodínia. O primeiro cenário envolve uma colisão oblíqua da Amazônia com a Laurentia, começando no Texas há 1200 Ma, seguida por movimentos transcorrentes até o inal da colisão da Amazônia com a Báltica há 1000 Ma. No segundo cenário, a ruptura da Amazônia e da Báltica do Co-lumbia ocorre após 1260 Ma e é seguida por uma rotação horária e pela colisão desses blocos com a Laurentia ao longo do cinturão Grenville há 1000 Ma. Finalmente, a época em que a Amazônia colidiu com a parte central do Gondwana tem sido objeto de muita disputa. Todavia, os poucos polos paleomagnéticos do inal do Neoproterozoico/Cambriano para o Cráton Amazônico, para a Laurentia e outros blocos do Gond-wana Ocidental sugerem que o Oceano Clymene que separou estes blocos ocorreu entre o inal dos períodos Ediacarano e Cambriano, após a separação do Cráton Amazônico da Laurentia há 570 Ma.
PALAVRAS-CHAVE: Cráton Amazônico; paleomagnetismo; super-continentes; Columbia; Rodínia; Gondwana.
Paleomagnetism of the Amazonian
Craton and its role in paleocontinents
Paleomagnetismo do Cráton Amazônico
e sua participação em paleocontinentes
Manoel Souza D’Agrella-Filho1*, Franklin Bispo-Santos1, Ricardo Ivan Ferreira Trindade1 , Paul Yves Jean Antonio1,2
INTRODUCTION
he paleogeography of continental blocks is the key piece of information to understand the geological evolu-tion of our planet and the mechanisms that prevailed in the assembly and rupture of supercontinents, a process known as supercontinental cycle (Condie 2002). Based on the Pangea assembly, Meert (2012) deined that a superconti-nent must comprise at least 75% of the existing contisuperconti-nental crust. Based on this deinition, the continental masses were united in supercontinents at least three times in Earth’s his-tory: 200 Ma (Pangea), 1100-1000 Ma (Rodinia), and 1850-1800 Ma (Columbia/NUNA). Note that large continental masses such as Gondwana and Laurasia did not comprise 75% of the continental surface, and therefore cannot be regarded supercontinents according to Meert’s deinition. he ages of assembly for the three supercontinents imply a periodicity of approximately 750 Ma for the superconti-nent cycle (Meert 2012).
If we consider the peaks in U-Pb zircon ages, integrated with Nd isotopic ratios obtained for rocks all over the globe, we can assume the existence of a fourth supercontinent at ca. 2700 Ma (Hawkesworth et al. 2010). However, the recon-struction of such Archean supercontinent is a challenge given the scarcity of paleomagnetically viable targets of that age (Evans 2013). Some attempts to correlate Archean units based on geological and paleomagnetic data have been published, such as the formation of Zingarn supercraton made by the link of Zimbabwe/Rhodesia (Africa) and Yilgarn (Australia) blocks (Smirnov et al. 2013), or the Vaalbara supercraton formed by Kaapvaal (Africa) and Pilbara (Australia) blocks (de Kock et al. 2009). However, the lack of the main paleo-magnetic poles for the Archean nuclei make paleogeographic reconstructions for those times very speculative (Buchan
et al. 2000, Pesonen et al. 2003).
Several paleogeographic reconstructions of a Paleoproterozoic supercontinent (1850-1800 Ma) have been proposed in literature (e.g. Rogers 1996, Rogers & Santosh 2002, Zhao et al. 2002, 2003, 2004, 2006, Meert 2002, Pesonen et al. 2003, Hou et al. 2008a, 2008b, Johansson 2009, 2014, Yakubchuck 2010, Piper 2010, Evans & Mitchell 2011, Zhang et al. 2012, among others). his supercontinent has received diferent names: NENA (Gower et al. 1990), NUNA (Hofman 1997), Columbia (Rogers & Santosh 2002), or Paleopangea (Piper 2010). Reddy & Evans (2009) advocate the name NUNA because it is older than the name Columbia. However, Meert (2012) argues that the NUNA paleocontinent deined by Hofman (1997) difers little from the NENA proposed by Gower et al. (1990). herefore, if precedence should be considered, this Mesoproterozoic supercontinent should be named
NENA. In addition, NENA and NUNA originally refer to correlations between Laurentia, Baltica, Siberia, and eventu-ally East Antarctica, so these reconstructions represent only a fraction of the Paleoproterozoic supercontinent. In this way, Meert (2012) states that the name Columbia proposed by Rogers & Santosh (2002) designates the irst attempt of a global and testable reconstruction. After Meert’s (2012) reasonings, we will call hereafter the Paleoproterozoic super-continent as Columbia.
he rupture time of Columbia is a subject of intense dis-cussion in literature. Some authors suggest that Columbia broke-up soon after its formation, as evidenced by the signif-icant amount of maic dykes dated around 1780-1790 Ma found in North China Craton (Kusky et al. 2007), Baltica (Pisarevsky & Bylund 2010), and Amazonian Craton (Reis et al. 2013). Nevertheless, such global tectonic and magmatic features are usually associated with Statherian taphrogenesis at diferent cratons, and so they would not represent a com-plete rupture of the supercontinent (Brito Neves et al. 1995). Indeed, paleomagnetic and geochronological data obtained for Baltica and Laurentia, which formed the Columbia core (e.g. Zhao et al. 2002), suggest they remained joined from 1800 Ma until at least 1270 Ma (Salminen & Pesonen 2007). A long-lived Columbia is consistent with the unusual tec-tonic style that prevailed in the Mesoproterozoic, marked by a strong decrease in the subduction low and subduc-tion related magmatism (Silver & Behn 2008). his is also coherent with the intense intracratonic magmatic activity that is characterized by the emplacement of a voluminous anorogenic rapakivi granitic magmatism, between 1600 and 1300 Ma, which is one of the most striking features of the continental blocks forming Columbia (e.g. Åhäll & Connelly 1998, Anderson & Morrison 1992, Bettencourt
et al. 1999, Hofman 1989, Karlstrom et al. 2001, Rämö
et al. 2003, Vigneresse 2005).
Piper (2010) proposes that the demise of Columbia occurred through a series of small intracratonic rotations that are consis-tent with U-Pb ages (and Nd model ages), obtained for rocks between 1200 and 1000 Ma. Such period is characterized by a small peak in the formation of juvenile crust, when compared with periods related to the formation of other supercontinents (Hawkesworth et al. 2010). Recently, Pisarevsky et al. (2014) suggested that the Columbia supercontinent began its agglu-tination at ~1700 Ma, reaching its maximum area between 1650-1580 Ma. hey also argued that Columbia broke-up in two stages. he irst one occurred between 1450 and 1380 Ma and the second at ca. 1270 Ma. In contrast, Zhao et al. (2004) and Rogers & Santosh (2009) postulated that Columbia’s break-up occurred almost synchronously at ca. 1500 Ma.
Almost all continental masses involved in Columbia, later assembled to form the Rodinia supercontinent at about
1100 – 1000 Ma ago (McMenamin & McMenamin 1990). Several paleogeographic reconstructions have been proposed for the Neoproterozoic supercontinent (e.g. Hofman 1991, Weil et al. 1998, D’Agrella-Filho et al. 1998, Dalziel et al. 2000, Tohver et al. 2002, 2006, Pisarevsky et al. 2003, Meert & Torsvik 2003, Li et al. 2008). Li et al. (2008) rebuilt Rodinia including all cratonic areas of the world. However, geological evidence show that some continental blocks that formed the West Gondwana (e.g. Congo-São Francisco, Kalahari) did not take part in Rodinia, since a large ocean existed between these units and the Amazonian Craton (Cordani et al. 2003, Kröner & Cordani 2003, D’Agrella-Filho et al. 2004, and references therein). After Rodinia break-up, their continental fragments gathered in other conigurations (e.g. Gondwana), but the details of this process, including the timing and reassembly conig-uration of the diferent blocks, are still a subject of debate in literature, mainly due to the almost total absence of key paleomagnetic poles between 900 and 600 Ma for the units that potentially composed these landmasses.
he Amazonian Craton, in the Northwest of South America, surely played a fundamental role in the Earth’s geo-dynamic history and in the paleogeography of Columbia, Rodinia, and Gondwana. In recent years, a wealth of new paleomagnetic data was obtained for this unit with import-ant implications on the formation and rupture of Columbia and Rodinia supercontinents, and on the agglutination of Gondwana. In Table 1, we list all poles between 2100 and 530 Ma available for the Amazonian Craton and corre-sponding references.
In this paper, we will discuss the recent paleomagnetic and geological evidence for the participation of the Amazonian Craton in diferent Proterozoic supercontinents. Firstly, we will introduce the reasoning behind paleogeographic recon-structions based on paleomagnetic data. hen, we will present a brief description of the geologic/tectonic compartments of the Amazonian Craton. he following topics discuss the recent paleomagnetic data and their implications for the par-ticipation of the Amazonian Craton in pre-Columbia times, in Columbia supercontinent, in Rodinia supercontinent, and in the Gondwana continent. Finally, the most import-ant conclusions regarding the geodynamic evolution of the Amazonian Craton during the Proterozoic will be shown.
PALEOMAGNETIC RECONSTRUCTION
OF PALEOCONTINENTS
he Pangea was the irst supercontinent to be recon-structed on the basis of the itting of geological provinces, continent shorelines, paleoclimatic indicators, and the
continuity of the paleontological record throughout the ancient continental assembly (Wegener 1912). With the advent of isotope geochemistry, radiometric chronology and geophysics, other approaches were incorporated into the exercises of paleocontinent reconstructions, particularly the pre-Pangea supercontinents (Evans 2013), including the age and continuity of large igneous provinces and paleomag-netic data. From these, the only technique that provides a quantitatve assessment of the past distribution of the con-tinents is paleomagnetism (e.g. Butler 1992).
Paleomagnetic poles are equated to the Earth’s spinning poles and therefore provide a geographical reference frame for reconstructions. he paleomagnetic method is based on two premises:
1. the Earth’s magnetic ield when averaged over 104 to
105 years is equivalent to that of a dipole centered in
the planet, and aligned along its rotation axis;
2. magnetic minerals record and preserve the orientation of the ancient ield over geological time scales.
he irst premise is also known as the geocentric axial dipole (GAD) hypothesis, and seems to hold for recent and ancient times (Meert 2009, Swanson-Hysell et al. 2009). he ield sampling must then comprise sites distributed within at least tens to hundreds of thousand years. his is the reason why several dykes or sedimentary strata must be sampled to determine a single paleomagnetic pole.
For ensuring that a paleomagnetic pole calculated for a given geological formation its the GAD assumption, we must comply with minimum statistical standards (e.g. number of samples larger than 24; conidence circle around the pole smaller than 16°; van der Voo 1990). In addition, paleomagnetic directions for a given target must preferen-tially include normal and reversed directions, thus proving that enough time has elapsed during the eruption, intru-sion or deposition of the studied geological unit. he second premise of paleomagnetism assumes that the orientation of the geomagnetic ield, when the rock unit was formed, is preserved until today in its magnetic remanence vector. However, we know that diferent geological processes, such as metamorphism or diagenesis, can change the original magnetization by re-heating original magnetic grains or creating new ones (van der Voo & Torsvik 2012). Usually, this change overprints the original magnetization only partially and a single sample may therefore record two or more remanence vectors.
Rock unit Plat (°N) Plong (°E) dp/dm (A95)
(°) Age ± error (Ma) Q Ref. The proto-Amazonian Craton before Columbia
a) Tumuc Humac Mount. Granite 18.9 273.7 19.2/22.3 2100 ± 1 U-Pb zrn 3 1, 2
b) Tampok River Granite -6.9 300.1 15.9/16.1 2155 ± 3 U-Pb zrn 3 1, 3
c) Mataroni River Granite 14.9 289.2 40.6/42.7 2115 ± 3 U-Pb zrn 3 1, 2
d) Approuague River Granite 4.5 298.9 19.1/19.2 2093 ± 3 U-Pb zrn 3 1, 2
e) Approuague River Granite -5.9 296.9 34.3/35.1 2100–2050 3 1
f) Approuague River Granodiorite -18.5 294.3 21.3/23.0 2089 ± 4 U-Pb zrn 3 1, 3
g) Approuague River Granite 5.3 293.4 16.8/17.2 2050–2070 3 1
Mean (a–g) - GF1 pole 1.8 292.5 (11.2) 2050-2070 3 4
h) Oyapok granitoids – OYA pole -28.0 346.0 (13.8) 2036 ± 14 Ar-Ar
amp 5 1, 5
i) Armontabo River Granite – ARMO pole -2.7 346,3 (14.2) 2080 ± 4 U-Pb zrn 4 1, 6
j) Imataca Complex – IM1 pole -49.0 18.0 (18.0) 1960–2050 3 7
k) Imataca Complex – IM2 pole -29.0 21.0 (18.0) 1960–2050 3 7
l) Encrucijada Pluton – EN1 pole -55.0 8.0 (6.0) 1972 ± 4 Ar-Ar
amp 3 8
m) Encrucijada Pluton – EN2 pole -37.0 36.0 (18) 1972 ± 4 Ar-Ar
amp 3 8
Mean (h-m) - CA1 pole 43.2 21.9 (16,5) ~1970 3 9
n) Costal Late Granite – PESA pole -56.7 25.1 6.2/12.4 2060 ± 4 U-Pb zrn 3 1, 3 o) Costal Late Granite – ROCO pole -58.0 26.4 7.9/15.8 2095 ± 6 U-Pb zrn 3 1, 3
p) Costal Late Granite – MATI pole -58.6 25,5 9.7/19.4 ~2050-1970 3 1
q) Costal Late Granite – ORGA pole -59.7 44.7 10.1/19.5 2069 ± 4 U-Pb zrn 3 1, 3
Mean (n-q) - GF2 pole -58.5 30.2 (5.8) ~2050-1970 3 4
Roraima Uairen Fm. – U2 pole -66.5 9.0 (17.8) 1920-1830 2 10,
11
Surumu Group volcanics - SG pole -27.4 54.8 (9.8) 1966 ± 9 U-Pb zrn 5
9, 12,
13
The Amazonian Craton in the Columbia supercontinent
Roraima Uairen Fm. - U1 pole -69.0 17.0 (7.2) 1838 ± 14 U-Pb l 4 10,
11
Aro-Guaniamo dike (group II) -42.0 0.0 (6.0) 1820 mean Ar-Ar
bi 4 8
Colider Group (rhyolites) – CG pole -63.3 298.8 (10.2) 1789 ± 7 U-Pb zrn 4 14
Avanavero Sills – AV pole -48.4 27.9 (9.6) 1788.5 ± 2.5 U-Pb
badd 5
15, 16
Basic dykes (group I) 59.0 222.0 (6.0) 1800-1500 4 8
Kabaledo dykes 44.0 210.0 (14.3) 1800-1500 2 17
La Escalera basic dykes (group 1) 55.5 225.5 (11.2) 1800-1500 4 8
Parguaza G3N 10.7 294.7 (25.0) 1545-1393 1
18, 19, 20
Parguaza rapakivi batholith G1R 54.4 173.7 (9.6) 1545-1392 1
18, 19, 20
Mean Mucajai/Parguaza complex 31.7 186.6 (22.8) ~1530 2 21
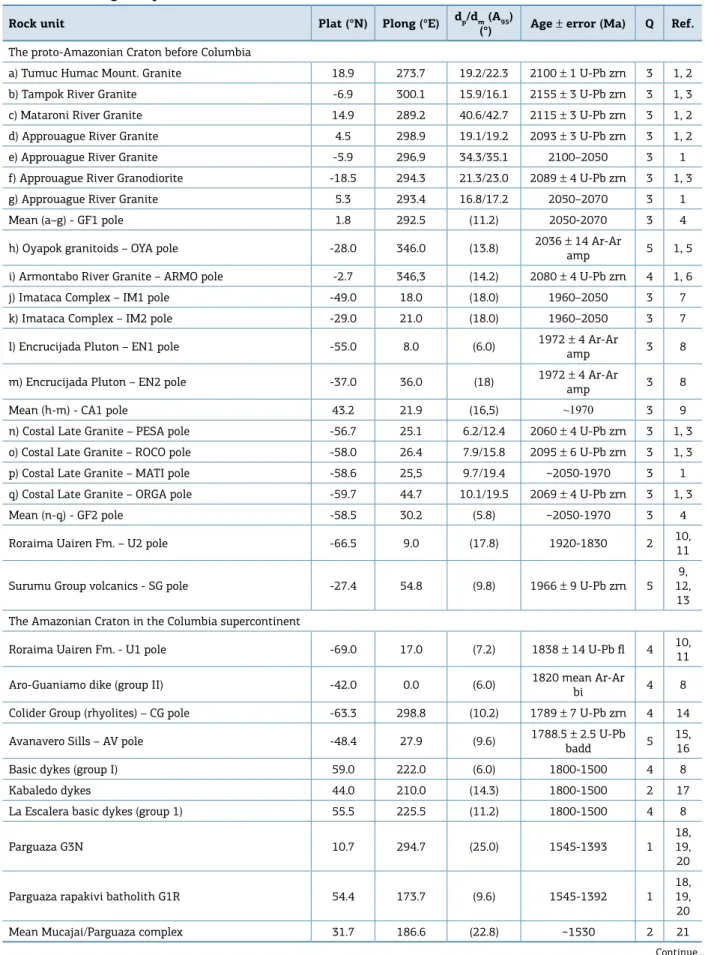
Table 1.Paleomagnetic poles from the Amazonian Craton between 2100 and 530 Ma.
Continue...
nature of a remanence direction, we use paleomagnetic sta-bility tests, such as the baked contact test, the fold test, and the conglomerate test (see details in Butler 1992). In addi-tion, the direction must be diferent from the paleomagnetic directions obtained in younger geological units of the same region. van der Voo (1990) summarized the checks conceived to attest if the two basic assumptions of paleomagnetism were valid. Furthemore, van der Voo stablished that a reference paleomagnetic pole must have been obtained in a geolog-ical unit in structural continuity to the cratonic block and must have a precise dating (error within 4%).
With reference paleomagnetic poles in hand, one can deine the ancient position of continents based on their Euler rotations. he Euler theorem implies that any displacement in the surface of a sphere is equivalent to a single rotation about a ixed axis. hus, to drive any continental mass back to its ancient position, we just need a rotation pole and the rotation angle around it. In this way, the conirguration of a paleocontinent can be expressed as a series of rotation poles and angles and as such they can be tested with new paleo-magnetic poles or through the other approaches cited before.
Euler pole reconstructions of continent motions date back to the work of Bullard et al. (1965), but until recently several reconstructions are still performed by cutting and pasting continents on lat maps, thus distorting their contours and providing models that are sometimes unrealistic and not testable. Nowadays, several softwares enable to eas-ily reconstruct the global geography in three-dimensions using rotation angles and poles (e.g. GPlates, Williams
et al. 2012, GMap, Torsvik & Smethurst 1999). he paleomagnetic approach to paleocontinent recon-structions has nevertheless some drawbacks: the most import-ant is the ambiguity in polarity given the axial symmetry of the GAD model (Fig. 1). Because of that, a paleomagnetic pole allows one to assign a paleolatitude and a paleodecli-nation (rotation from present-day North) for a continent but not the hemisphere or longitude it belonged to in the past. herefore, to deduce the paleolongitude and polarity of diferent continental masses in paleogeographic recon-structions, one must use additional information other than paleomagnetism. In the further discussion, we attempted to complement the paleomagnetic information for the
Plat: Paleolatitude; Plong: Paleolongitude; dp/dm (A95) (in degrees): Fisher’s statistical parameters. Geochronological symbols – zrn: zircon; badd: baddeleyite;
bi: biotite; pl: plagioclase; l: luorapatite; x: xenotime; amp: amphibole; wr: whole rock; Q: quality factor (van der Voo 1990); *: inferred from the Gondwana apparent polar wander path. References of the table: 1 – Théveniaut et al. (2006); 2 – Vanderhaeghe et al. (1998); 3 – Delor et al. (2003); 4 – D’Agrella-Filho et al. (2011); 5 – Nomade et al. (2001); 6 – Enjolvy (2004); 7 – Onstott & Hargraves (1981); 8 – Onstott et al. (1984a); 9 – Bispo-Santos et al. (2014a); 10 – Castillo & Costanzo-Alvarez (1993); 11 – Beyer et al. (2015); 12 – Fraga & Dreher (2010); 13 – Schobbenhaus et al. (1994); 14 – Bispo-Santos et al. (2008); 15 – Bispo-Santos et al. (2014b); 16 – Reis et al. (2013); 17 – Veldkamp et al. (1971); 18 – Valdespino & Costanzo-Alvarez (1997); 19 – Gaudette et al. (1978); 20 – Bonilla-Pérez et al. (2013); 21 – Veikkolainen et al. (2011); 22 – Bispo-Santos (2012); 23 – D’Agrella-Filho et al. (2016); 24 – Geraldes et al. (2014); 25 – Teixeira et al. (2016); 26 – Elming et al. (2009); 27 – Bispo-Santos et al. (2012); 28 – D’Agrella-Filho et al. (2012); 29 – Teixeira et al. (2011); 30 – Tamura et al. (2013); 31 – Girardi et al. (2012); 32 – Tohver et al. (2002); 33 – D’Agrella-Filho et al. (2008); 34 – Trindade et al. (2003).
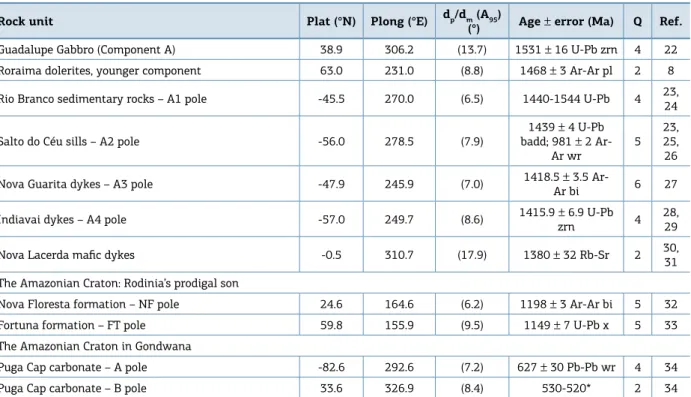
Rock unit Plat (°N) Plong (°E) dp/dm (A95)
(°) Age ± error (Ma) Q Ref.
Guadalupe Gabbro (Component A) 38.9 306.2 (13.7) 1531 ± 16 U-Pb zrn 4 22
Roraima dolerites, younger component 63.0 231.0 (8.8) 1468 ± 3 Ar-Ar pl 2 8
Rio Branco sedimentary rocks – A1 pole -45.5 270.0 (6.5) 1440-1544 U-Pb 4 23, 24
Salto do Céu sills – A2 pole -56.0 278.5 (7.9)
1439 ± 4 U-Pb badd; 981 ± 2
Ar-Ar wr
5 23, 25, 26
Nova Guarita dykes – A3 pole -47.9 245.9 (7.0) 1418.5 ± 3.5
Ar-Ar bi 6 27
Indiavai dykes – A4 pole -57.0 249.7 (8.6) 1415.9 ± 6.9 U-Pb
zrn 4
28, 29
Nova Lacerda maic dykes -0.5 310.7 (17.9) 1380 ± 32 Rb-Sr 2 30, 31
The Amazonian Craton: Rodinia’s prodigal son
Nova Floresta formation – NF pole 24.6 164.6 (6.2) 1198 ± 3 Ar-Ar bi 5 32
Fortuna formation – FT pole 59.8 155.9 (9.5) 1149 ± 7 U-Pb x 5 33
The Amazonian Craton in Gondwana
Puga Cap carbonate – A pole -82.6 292.6 (7.2) 627 ± 30 Pb-Pb wr 4 34
Puga Cap carbonate – B pole 33.6 326.9 (8.4) 530-520* 2 34
Amazonia Craton and surrounding cratonic blocks with the most updated geological data available in the literature.
THE AMAZONIAN CRATON
he Amazonian Craton is one of the largest cratonic areas in the world, with about four million square kilome-ters (Fig. 2a). It is exposed in two major areas divided by the Phanerozoic Amazon Basin: the Guiana Shield to the North and the Brazil-Central Shield (also known as Guaporé Shield) to the South (Schobbenhaus et al. 1984, Santos et al. 2000, Lacerda-Filho et al. 2004). According to recent syntheses of Tassinari et al. (2000), Delor et al. (2003), Santos et al. (2003), and Cordani & Teixeira (2007), the evolution of the Amazonian Craton is marked by successive accretionary events with greater or lesser involvement of the juvenile crust occurred from the Paleoproterozoic to the Neoproterozoic. Based on geochronological data, Tassinari & Macambira (1999, 2004) proposed an evolutionary model for the Amazonian Craton, which began when Hadean-Archean microcontinents assembled along Paleoproterozoic colli-sional orogens between 2200 Ma and 1950 Ma. his was followed by the development of a succession of magmatic arcs and collisional processes involving the reactivation and reworking of pre-existing rocks. Two models that subdivide
Figure 1. Amazonian craton (AMC) and geologic/ geocronological provinces (yellow lines) reconstructed with the OYA pole. Amazonian craton is shown in its present position (A) with South American coastline. Also shown is the local geographic position of the Oyapok
granites and their respective pole (with conidence
circle) in green. Paleomeridian line passing through the sampling site and paleomagnetic pole is also shown. Positions B to G show that the continent can be moved freely along the same latitude for the two choices of polarity: Normal (B, C and D) or Reverse (E, F and G). Dm and Im are, respectively, the mean declination and inclination of characteristic remanent magnetization direction calculated for the OYA rocks. “Normal polarity” and “reverse polarity” globes on the right show the
coniguration of inclination (I, red arrows) for each case.
A
B C D
E F G
60o
-60oW
Im = 60.2O
Im = 60.2O 30o
AMC SITE
NORMAL POLARITY
REVERSE POLARITY I = +90O
I = +90O I = 0o
I = 0O
I = -90O
I = -90O
N
OYA POLE
-30oW
Dm = 133.8°
-30o
0o
IM = 60.2O PALEOMERIDIAN
EQ
N -90oW
-60o
Figure 2. (A) Amazonian Craton and their geologic/geochronological provinces (adapted from Cordani & Teixeira 2007 and Bettencourt et al. 2010). The stars indicate approximate geographical locations of geological units studied by the following research groups: Princeton – blue; BRGM – green; IAG-USP – yellow; other groups – purple. (B) Sketch of the southwestern part of the Amazonian Craton showing Paraguá Terrain and Alto Guaporé,
Sunsás, Aguapeí, and Nova Brasilândia belts (modiied ater D’Agrella-Filho et al. 2012).
0o
40o
IAG Group (1979-present) BRGM Group (2001-2006) Princeton Group (1981-1990) Other groups
20o
Phanerozoic sedimentary covers Precambrian Sedimentary Covers Central Amazonian Province (> 2,6 GA)
Maroni-Itacaiunas Province (2,25-2,05 Ga)
Ventuari-Tapajós Province (1,98-1,88 Ga) Rio Negro-Juruena Province (1,78-1,55 Ga) Rondoniano-San Ignácio Province (1,55-1,30 Ga) Sunsás Province (1,25-0,95 Ga)
Brazil Colombia
Ecuador
Perú
Venezuela
80o
60o
Amazon Basin
Bolivia
Amazonian Craton
Jauru Terrane
Paraguá Terrain Sunsás N
Bolivia
Alto Guaporé BeltBrazil Novs Brasilândia Belt
Aguapeí
Suriname Guyana
French Guyana
A B
the Amazonian Craton into geochronological provinces have been proposed, one by Tassinari & Macambira (1999, 2004) and the other by Santos et al. (2003). We followed the model of Tassinari & Macambira (1999, 2004) (Fig. 2A), which is adopted by several other authors (e.g. Schobbenhaus
et al. 2004, Cordani & Teixeira 2007, Cordani et al. 2010, Bettencourt et al. 2010).
he oldest portion (Hadean-Archean) of the Amazonian Craton (Central Amazonian Province) consists of gran-ite-greenstone terrains and high-grade metamorphic rocks exposed in the Brazil-Central and Guiana shields (Tassinari & Macambira 2004, Nadeau et al. 2013). he Maroni-Itacaiúnas Belt separates these landmasses, and it is dated around 2250-2050 Ma (Ledru et al. 1994). he Hadean-Archean basement is covered by volcano-sedimentary sequences with little or no deformation and ages ranging between 1980 and 1400 Ma. he southwestern part of the Hadean-Archean core was accreted by subduction-related juvenile magmatic arcs, which formed the Ventuari-Tapajós (1980-1810 Ma) and Rio Negro-Juruena (1780 – 1550 Ma) Provinces (Tassinari & Macambira 1999, Tassinari et al. 2000, Pinho et al. 2003, Schobbenhaus & Brito Neves 2003, Cordani & Teixeira 2007).
During the Mesoproterozoic, subduction-related mag-matic arcs were developed between 1600 Ma and 1300 Ma (e.g. Jauru Terrain in Mato Grosso State), forming the Rondoniano-San-Ignacio Province until the inal collision of Paraguá Terrain at about 1320 Ma ago (Bettencourt et al. 2010). his collisional model has been extended to the northwestern Rondônia State, with the recognition of the Trincheira ophiolite by Rizzotto & Hartmann (2012), who interpreted it as an oceanic crust fragment raised during the Mesoproterozoic as a consequence of the collision between the Paraguá Terrain and the proto-Amazonian Craton along the Alto Guaporé Belt (Fig. 2B). he E-W Nova Brasilândia Belt (NBB – 1100 – 1000 Ma old) at North of the Paraguá Terrain (Fig. 2b) most likely represents intracratonic reac-tivations that occurred during the development of Sunsás orogen (Sunsás Province – 1250 – 1000 Ma), which is located on the southwestern tip of the Amazonian Craton, in the Bolivian region (Litherland et al. 1989, Boger et al. 2005, Santos et al. 2008, Teixeira et al. 2010, Cordani et al. 2010). Some authors, however, interpret the NBB as a result of the collision between the proto-Amazonian Craton and the Paraguá Terrain, which would extend to Mato Grosso State, including the Jauru Terrain (Tohver et al. 2004a).
he Aguapei Belt (Fig. 2B) is considered a branch to the north of the Sunsas belt, separated from the main part of the orogeny by the Paraguá Terrain. his belt has been interpreted as an aborted continental rift, whose deposi-tion initiated at ca. 1300 Ma, followed by compression and
thrusting to the east at ca. 1000 Ma (Litherland et al. 1989, Sadowski & Bittencourt 1996).
THE PROTO-AMAZONIAN
CRATON BEFORE COLUMBIA
he deinition of a crustal paleogeography for the period prior to Columbia formation is yet very speculative, since many continental blocks were still being assembled during this period, including the Amazonian Craton, Laurentia, and Baltica. Well-dated paleomagnetic poles for the difer-ent fragmdifer-ents that later were assembled in these cratons are scarce, thus we can only speculate about the possible pres-ence of Archean supercratons, as are the cases of Zingarn (Zimbabwe/Rhodesia/Yilgarn) and Vaalbara (Kaapvaal/ Pilbara) supercratons proposed by Smirnov et al. (2013) and de Kock et al. (2009), respectively. In Amazonia, some authors advocate a relation between the Guiana Shield and the West Africa Craton forming a single, large cra-tonic block (supercraton) at about 2000 Ma ago (Onstott & Hargraves 1981, Nomade et al. 2003, Johansson 2009, Evans & Mitchell 2011).
Despite the general scarcity of Precambrian paleomag-netic data for the Amazonian Craton, the interval between 2100 and 1970 Ma is relatively well represented in the data-base as a result of studies carried out by two research groups at diferent times. hese studies led to the construction of apparent polar wander paths (APW Paths) for the Amazonian Craton (Guiana Shield) and the West Africa Craton for Orosirian times. In the 1980s, the Princeton group (led by Tullis C. Onstott) conducted a series of paleomagnetic and geochronological studies on intrusive rocks from Guiana Shield (Venezuela and Guyana; see localizations of the stud-ied geological units in Fig. 2 – green stars) and West Africa Craton (Onstott & Hargraves 1981, Onstott et al. 1984a, 1984b). Based on the available paleomagnetic data, these authors argued that Guiana Shield was an extension of West Africa Craton, however, it was displaced in relation to the Pangaea reconstruction in such way that the Guri lineament in Guiana Shield and Sassandra lineament in West Africa Craton were aligned (Onstott & Hargraves 1981).
APW Paths overlap at about 2020 Ma, if the paleogeographic coniguration suggested by Onstott & Hargraves (1981) was used. Subsequently, héveniaut et al. (2006), also from the BRGM, presented a comprehensive paleomagnetic and geo-chronological study regarding plutonic and metamorphic rocks from Guiana Shield, in which they tried to accurately identify the age of magnetization acquisition of the studied rocks, based on several U-Pb and Ar-Ar datings of minerals with diferent closure temperatures. According to a new group of poles and the reinterpretation of previous paleomagnetic poles, héveniaut et al. (2006) proposed a new APW Path for the Amazonian Craton (Guiana Shield), between 2155 and 1970 Ma. However, they did not discuss the paleoge-ography proposed by Onstott & Hargraves (1981), which was corroborated by Nomade et al. (2003).
Recently, new paleomagnetic data were obtained for fel-sic volcanic rocks from the Surumu Group (Guiana Shield), which is well dated at 1960-1980 Ma by the U-Pb method (Bispo-Santos et al. 2014a). A robust paleomagnetic pole (Tab. 1) was obtained for these rocks, which helps to bet-ter deine the APW Path traced by héveniaut et al. (2006) between 2070 and 1970 Ma for the Guiana Shield (Fig. 3). his APW Path began being deined by a series of paleopoles concentrated on northern South America, which héveniaut
et al. (2006) associated with the Orosirian deformation event (2070-2050 Ma) that afected the French Guiana. An average paleopole designated GF1 (Fig. 3, Tab. 1) was determined for this set of poles (D’Agrella-Filho
et al. 2011). Eastward, the curve passes over the ARMO and OYA poles (Tab. 1) determined for granites collected over the Armontabo and Oyapok rivers, respectively, whose irst letters provided the acronyms of their poles. he age of these poles was deined by dating diferent minerals (zircon, amphibole and biotite) representing distinct closure tem-peratures associated with their isotopic systems.
héveniaut et al. (2006) interpret the 2020 ± 4 Ma Ar-Ar
age (amphibole) obtained for an Oyapok River granite as the one that best agrees with the blocking temperature of the magnetic mineral (magnetite), which records the geomagnetic ield at the time of formation of these rocks, which yielded the OYA pole. he youngest part of the curve is established by two sets of poles: the irst corresponds to the poles deter-mined for the Imataca Complex (IM1, IM2 – Tab. 1) and the La Encruzijada Granite (EN1, EN2 – Tab. 1), which are integrated into a single average paleopole called CA1 (Fig. 3, Tab. 1). he second set comprises four poles determined for granitic rocks of northern French Guiana (héveviaut
et al. 2006), whose average is represented by GF2 (Fig. 3, Tab. 1). An approximate age of 1970 Ma was suggested by héveniaut et al. (2006) for this part of the curve, based on the 1972 ± 4 Ma age (40Ar/39Ar in amphibole) obtained for
the La Encruzijada granite (Onstott et al. 1984b). A similar age (ca. 1970 Ma) was also suggested based on the Imataca Complex thermal history, disclosed by hornblende, biotite, and feldspar Ar-Ar dating (Onstott et al. 1989).
Finally, the recent ~1960 Ma pole (SG in Tab. 1) deter-mined for the acid volcanic rocks from the Surumu Group (Bispo-Santos et al. 2014a) may indicate an extension of the APW Path traced by héveniaut et al. (2006) for the interval 2070-1970 Ma (Fig. 3). In Fig. 3, the APW Path traced by Nomade et al. (2003) for West Africa, referring
Figure 3. (A) Paleogeographic coniguration of the
Amazonian Craton and West Africa Craton link at around 2000-1970 Ma ago. Geotectonic provinces: Amazonia (CA – Central Amazonian Province, MI – Maroni-Itacaiúnas Province; GU – Guri lineament); West Africa (LS – Leo Shield, KD – Kenemanan Domain, RB – Requibat Shield, SSA – Sassandra lineament). (B) Comparison of the Amazonian and West African 2070-1960 Ma APW Paths. Pole Acronyms: AMC – Amazonian Craton (yellow); GF1, ARMO, OYA, GF2 and SG poles (Tab. 1); WAF – West Africa Craton (green); IC1 –Ivory Coast Granites (Nomade et al. 2003); PL1 – Abouasi Amphibolites (Piper & Lomax 1973); PL2 – Abouasi Dolerites (Piper & Lomax 1973); OD – Liberia Granites (Onsttot & Dorbor 1987); IC2 –
Ferke Granites – Ivory Coast (Nomade et al. 2003); GAF
– Atout Granites (Nomade et al. 2003); AH – Harper
Amphibolite – Liberia (Onsttot et al. 1984a); SL – Atout Gabbros – Algeria (Nomade et al. 2003). West Africa Craton and their corresponding paleomagnetic poles were rotated using the Euler pole at 43.3°N; 330.5°E
(rotation angle of -71.5°). Modiied ater Bispo-Santos
et al. (2014a).
KD
SSA LS
AH (1990-2000 MA)
WEST AFRICA CRATON
AMAZONIAN CRATON
CA
CA
IM
MI
GU
RB
0o
PL1 AMC
WAF
GF1
ARMO
OYA
SG (1960 MA)
SL
CA1 IC1
GAF (1950-1982 MA) IC2
GF2 (~1970 MA)
OD
PL2 A
B
to the time interval 2080 – 1940 Ma, is also shown, after rotation of West Africa and corresponding paleomagnetic poles using an Euler pole located at 43.3°N; 330.5°E (rota-tion angle of -71.5°). he proto-Amazonian/West-African paleogeography (Fig. 3) is similar to that proposed by Onstott & Hargraves (1981), in which the Guri (Guiana Shield) and Sassandra (West Africa) shear zones were part of the same tectonic lineament. Despite the poor quality of the poles applied to trace the West Africa Craton’s APW Path (Nomade et al. 2003), the two paths are clearly dif-ferent for ages older than 2000 Ma, and seem to joint at younger ages (1980 – 1960 Ma), attesting the validity of the formation of this supercraton at about 1980-2000 Ma (Bispo-Santos et al. 2014a) (Fig. 3).
According to Bleeker (2003), during Archean to early Proterozoic transition, there would have been a favorable scenario to the presence of many independent ‘supercratons’. Between 2500 and 2000 Ma, a diachronic fragmentation would have occurred in the larger supercratons generating around 35 independent cratons, which later on amalgamated into larger continental blocks (e.g. Laurentia) that ultimately formed the Columbia Paleo-Mesoproterozoic superconti-nent (Bleeker 2003).
Based on the available paleomagnetic and geolog-ic-geochronological data, we can attempt to reconstruct a proto-Amazonian Craton and its relation with other cra-tonic blocks at ca. 2000 Ma. In general, the paleomagnetic poles from the Amazonian Craton are compared with those from Laurentia and Baltica aiming supercontinental recon-structions. As already stressed, at times prior to Columbia formation, however, any reconstruction must be considered very speculative, since the major cratonic masses that would be assembled in Columbia were still not completely formed. For example, most of Laurentia was only assembled at ca. 1850 Ma, after the following collisions: Archean Slave and Rae blocks at 1970 Ma; the Slave/Rae and Hearne blocks at 1920 Ma; and this block with the Superior Craton at 1850 Ma (Mitchell et al. 2014). Following well-dated paleomag-netic poles from Slave and Superior cratons in the interval between 2200 Ma and 2000 Ma, Mitchell et al. (2014) demonstrate that these blocks were separated by a very large ocean (Manikewan Ocean) at ca. 2000 Ma (see Fig. 7 in Mitchell et al. 2014). In their reconstruction, the Slave block was rotated -79° around an Euler pole at 52°N, 356°E relative to the Superior block. Using this reconstruction, we propose a possible paleogeography at 2000 Ma (Fig. 4) that tentatively includes other two cratonic blocks of Laurentia (Rae and Hearne), and also parts of Baltica, Amazonia, and West Africa, partly based on paleomagnetic poles as further described. he relative paleogeographic positions of Slave and Superior cratons (Mitchell et al. 2014) are constrained
using the 1998 Ma pole determined for the Minto dykes (pole at 30°N, 183°E, A95 = 13°) from the Superior Craton. he Rae and Hearne blocks were positioned between these cratonic blocks.
At that time, Central Amazonia had already been assem-bled with the collision of Archean blocks along the 2250-2050 Ma Maroni-Itacaiúnas mobile belt (MIMB, Cordani & Teixeira 2007). Since other Archean blocks collided with Central Amazonia along the MIMB during and after its assembly, it is very likely that the craton at such time was a larger landmass. Based mainly on geological/geochrono-logical evidence, Johansson (2009) proposed the SAMBA model for Columbia, in which West Africa and Sarmatia/ Volgo-Uralia may be the components of this larger cratonic block. As previously discussed, West Africa was linked to the Guiana Shield at least since 1970-2000 Ma in a position
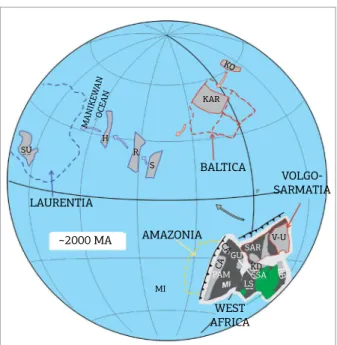
Figure 4. Reconstruction at 2000 Ma partially based on paleomagnetic data. Proto-Amazonia (pAM) was constrained using the OYA pole (Tab. 1). Superior Craton (Su) is constrained using the Minto dykes pole (Buchan et al. 1998, Evans & Halls 2010).
Superior (Su) and Slave (S) relative positions are the same proposed by Mitchell et al. (2014) following
paleomagnetic data. Karelia (Kar) is constrained by the 1984 Ma Pudozhgora intrusion pole (Lubnina et al. 2016), and Kola (Ko) Craton is tentatively positioned close to Karelia. In this scenario, it is suggested that proto-Amazonia, West Africa, Volgo-Uralia (V-U), and Sarmatia (SAR) formed a single cratonic mass. The
curved arrows indicate the possible later drits of each
cratonic block. CA – Central Amazonian Province; MI – Maroni-Itacaiúnas Province; GU – Guri lineament; LS – Leo Shield; KD – Kenemanan Domain; RB – Requibat Shield; SSA – Sassandra lineament.
~2000 MA
MI
LAURENTIA
AMAZONIA BALTICA
VOLGO-SARMATIA
KAR KO
S R H SU
SSA LS
KD RB
MANIKEW AN
OCEAN
CA PAM
V-U
GU
CA
SAR
where the Guri (in Guiana Shield) and Sassandra (in West Africa) lineaments were aligned (Onstott & Hargraves 1981, Nomade et al. 2003, Bispo-Santos et al. 2014a).
At 2000 Ma ago, Baltica was not yet formed either (see Bogdanova et al. 2001, 2013). Collision between Sarmatia and Volgo-Uralia (from South and East of Baltica Shield, respectively) occurred between 2100 and 2000 Ma, forming the Volgo-Sarmatia block. Therefore, based on such arguments, we propose herein that a large landmass was already formed at 2000 Ma com-posed by Volgo-Uralia, Sarmatia, Central Amazonia, and West Africa agglutinated along Paleoproterozoic mobile belts developed up to 2000 Ma. The position of this landmass is constrained by the OYA pole (Tab. 1) obtained for the Oyapok granitoids with an Ar-Ar (amphibole) age of 2020 ± 4 Ma. At that time, active
subduction zones were in progress at the Northern and Western margins of Volgo-Sarmatia and Central Amazonia, respectively (Fig. 4).
Karelia and Kola Archaean areas from north-north-western part of the Baltica Shield were far from Volgo-Uralia and Sarmatia blocks at 2000 Ma (Bogdanova et al. 2013). In Fig. 4, the Karelia position was constrained by the 1984 Ma Pudozhgora Intrusion pole (Lubnina et al. 2016), and Kola Craton is tentatively positioned close to Karelia. According to Daly et al. (2006), after the forma-tion of the Archean Kernoland supercontinent (Pesonen
et al. 2003), a Wilson cycle was developed between Kola and Karelia after the break-up of this supercontinent at ca. 2500 Ma. his was followed by the formation of an ocean and its later closure, culminating with the dock-ing of Kola and Karelia along the Lapland-Kola orogen at ca. 1900 Ma.
Between 1830 and 1800 Ma, an oblique collision took place between Volgo-Sarmatia with Fennoscandian terrains (Kola-Karelia) along the NW part of Sarmatia (Bogdanova et al. 2013). After this oblique collision, Volgo/Sarmatia (together with Central Amazonia and West Africa in our model) performed a counterclockwise rotation that activated older strike-slip faults (Bogdanova
et al. 2013). These fault systems accommodated mafic dyke swarms with ages between 1790 and 1750 Ma in the Ukrainian Shield (northwestern Sarmatia). At the same time (1790-1780 Ma), profuse mafic intru-sions occurred as dykes and sills at the Guiana Shield, spreading over Venezuela, French Guiana and north-ern Brazil (Reis et al. 2013, Bispo-Santos et al. 2014b). After Columbia formation at 1780 Ma (Bispo-Santos et al. 2014b), minor internal rotations happened associ-ated with 1750 Ma mafic dykes at the Ukrainian Shield (Bogdanova et al. 2013).
THE AMAZONIAN CRATON IN THE
COLUMBIA SUPERCONTINENT
According to Rogers & Santosh (2009), the Columbia supercontinent mostly assembled at about 1900-1850 Ma, as suggested by geologic correlations, age constraints, and other lines of evidence, like signiicant atmospheric changes (Bleeker 2003). However, diferent paleogeographic scenar-ios of Columbia were proposed, mainly due to scarcity of high-quality paleomagnetic poles (e.g. Meert 2002, Zhao
et al. 2002, 2003, 2004, Pesonen et al. 2003, 2012, Hou
et al. 2008a, 2008b, Johansson 2009, Rogers & Santosh 2009, Wingate et al. 2009, Yakubchuk 2010, Evans & Mitchell 2011, Zhang et al. 2012, Pisarevsky et al. 2014; among others).
In recent years, several Paleo-to Mesoproterozoic geo-logical units from the Amazonian Craton were investigated to establish its role in the Columbia Supercontinent. The first paleomagnetic study was conducted on the 1780 Ma felsic volcanic rocks of the Colíder Suite (Bispo-Santos et al. 2008), now called Colíder Group, located in northern Mato Grosso State, Brazil-Central (or Guaporé) Shield (Lacerda Filho et al. 2004). Based on these results, the paleogeographic scenario visual-ized for Columbia at 1780 Ma has Laurentia, Baltica, North China and proto-Amazonia aligned in a north to south continental mass forming the core of Columbia Supercontinent (Bispo-Santos et al. 2008) (Fig. 5A). Geological evidence favor the hypothesis that proto-Am-azonia and North China were laterally disposed at 1780 Ma ago. Subduction-related processes were developed in the western margin of the East Block of North China Craton and along the southwestern proto-Amazonian Craton. This process culminated with the docking of the West Block from North China Craton, along the Trans-North China Belt at ca. 1850 Ma ago, establish-ing the final configuration of North China Craton. Meanwhile, Ventuari-Tapajós accretion was in progress along the southwestern Amazonian Craton. Cordani
et al. (2009) restated this interpretation again in a broad discussion on the evolution of the Amazonian Craton and its role in the formation of supercontinents.
Subsequently, paleomagnetic studies on rocks from the Nova Guarita mafic dyke swarm (Bispo-Santos et al. 2012) and Indiavaí Intrusive (D’Agrella-Filho et al. 2012), also located in Mato Grosso State (Brazil-Central Shield), corroborated the paleogeographic model pro-posed by Bispo-Santos et al. (2008). 40Ar/39Ar
geochro-nological dating on biotite and plagioclase minerals separated from four Nova Guarita dykes yielded pla-teau ages between 1407 ± 8 Ma and 1430 ± 8 Ma. An
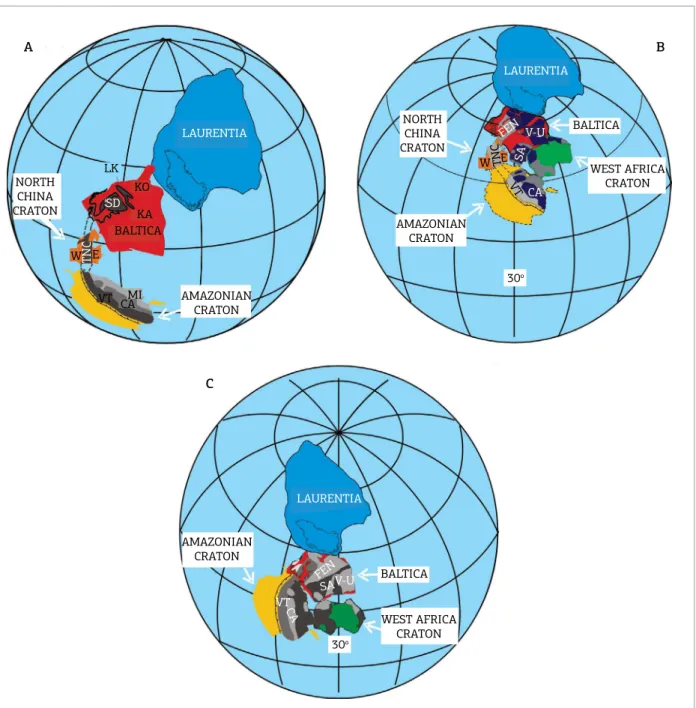
Figure 5. Paleogeographic reconstructions at ~1790 Ma as proposed by: (A) Bispo-Santos et al. (2008), (B)
D’Agrella-Filho et al. (2012), and (C) Bispo-Santos et al. (2014b). Baltica (FEN – Fennoscandia; V-U – Volgo-Uralia; SA – Sarmatia; KO – Kola; KA – Karelia; LK – Lapland-Kola; SD – Svecofennian Domain); Amazonia (CA – Central Amazonian Province; MI – Maroni-Itacaiúnas Province; VT – Ventuari-Tapajós Province); and North China Craton (W –West Block; E – East Block; TNC –Trans-North China belt).
LAURENTIA
NORTH CHINA CRATON
BALTICA
30o
V-U
E
WEST AFRICA CRATON
AMAZONIAN CRATON
SA
W TNC
FEN
CA
VT
NORTH CHINA CRATON
E
LAURENTIA
TNC
AMAZONIAN CRATON BALTICA
KO
KA
CA VT
LK
W
SD
MI
A B
LAURENTIA
BALTICA
WEST AFRICA CRATON 30o
AMAZONIAN CRATON
V-U
SA
CA VT
FEN
C
average of 1418 ± 3 Ma was calculated, which was
inter-preted as the intrusion age of the dykes (Bispo-Santos
et al. 2012). A positive baked contact test obtained for one of the dykes that cut the Paleoproterozoic Matupá granite demonstrates the primary nature of the charac-teristic remanent magnetization (ChRM) isolated for these rocks (see Bispo-Santos et al. 2012). The Indiavaí Intrusive belongs to a set of mafic bodies collectively
known as Figueira Branca Intrusive Suite (Bettencourt et al. 2010). U-Pb dating performed on zircons extracted from Indiavaí and Figueira Branca Intrusives provided ages of 1425 ± 8 Ma and 1415 ± 6 Ma, respectively,
ages and ChRM directions obtained for Indiavaí and Nova Guarita rocks strongly suggest they both preserved thermoremanent magnetizations, acquired during rock intrusions at ca. 1415 – 1425 Ma.
hese Mesoproterozoic poles (Tab. 1) have important implications regarding the signiicance of the Nova Brasilândia Belt (NBB – Fig. 2). Based on geophysical data and struc-tural inferences, Tohver et al. (2004a) interpreted NBB as a suture zone between the Paraguá Terrain (which, in their view, would also include Mato Grosso area, to the south of NBB) and the proto-Amazonian Craton. his model follows primarily the strong contrast between the monocyclic history of NBB, composed by high pressure and temperature granulites (1090-1060 Ma), and the polycyclic history of the basement rocks to the north, with evidence of sinistral strike-slip deforma-tion dated at 1190 – 1130 Ma (the Ji-Paraná shear zone). Other evidence presented by Tohver et al. (2004a) refer to the strong magnetic lineament disclosed by aeromagnetic data, which suggests the continuity of NBB to the east under Serra dos Parecis sedimentary cover. his interpretation, however, contrasts with that of other authors, who suggest that the NBB resulted from intracratonic reactivations during the evolution of Sunsás Belt situated on the southwestern tip of the Amazonian Craton (e.g. Cordani & Teixeira 2007). he similarity of Nova Guarita and Indiavaí poles obtained for geological units situated on opposite sides of NBB sup-ports this latter interpretation (D’Agrella-Filho et al. 2012). Nevertheless, the position of these poles, almost perpendic-ular to NBB, permitted that transcurrent movements along this belt occurred, which might have originated the Ji-Paraná sinistral shear zone previously described.
With regard to the paleogeography of Columbia, the new paleomagnetic data disclosed for Colíder Group (1780 Ma), Nova Guarita dykes (1419 Ma), and Indiavaí Intrusive (1416 Ma) corroborate the model initially pro-posed by Bispo-Santos et al. (2008) (Fig. 5a). In such model, Laurentia, Baltica, North China Craton and proto-Amazo-nian Craton were laterally disposed, forming the core of Columbia Supercontinent (D’Agrella-Filho et al. 2012) (Fig. 5b). West Africa Craton can be included in the model assuming it was linked to the proto-Amazonian Craton (Onstott & Hargraves 1981, Nomade et al. 2003, Johansson 2009, Evans & Mitchell 2011, Bispo-Santos et al. 2014a). However, some adjustments should be done to accommodate geological information taking into account the uncertainties of the available paleomagnetic poles. hus, in the Columbia Supercontinent proposed by D’Agrella-Filho et al. (2012), Sarmatia was rotated 43° counter-clockwise (Fig. 5b), as suggested by Elming
et al. (2010), based on paleomagnetic and geological evi-dence. D’Agrella-Filho et al. (2012) also speculated on
the presence of a triple junction between Fennoscandia, Sarmatia, North China, and Amazonia (see Fig. 13 in D’Agrella-Filho et al. 2012).
According to such model, soon after the formation of Columbia core, around 1850 Ma ago, dextral strike-slip move-ments occurred between North China and Fennoscandia and sinistral ones between North China and Amazonia/Sarmatia unit. Rupture of North China would be consistent with the profusion of 1780-1790 Ma maic dykes and sills exposed in northern Brazil, Venezuela and Guyana, known as the Avanavero Large Igneous Province (LIP – Gibbs 1987, Santos
et al. 2003, Reis et al. 2013), with the felsic and maic dykes from Småland province in southwestern Baltica (Pisarevsky & Bylund 2010); the 1770-1780 Ma gabbros and dolerites belonging to the Ropruchey sills in eastern Fennoscandia (Fedotova et al. 1999); and the profusion of similar in age dykes spread over North China (Kusky et al. 2007).
Although Paleo to Mesoproterozoic paleomagnetic data of the southeastern Amazonian Craton (Brazil-Central Shield) support a model in which Laurentia, Baltica, North China Craton, and Amazonian/West Africa Cratons were laterally displayed, thus forming the core of Columbia Supercontinent (D’Agrella-Filho et al. 2012), in most Columbia models, the Amazonian Craton appears directly linked to Baltica, in a reconstruction called SAMBA connection formally proposed by Johansson (2009).
Recently, a paleomagnetic study was conducted on mafic sills and dykes belonging to the Avanavero LIP, located in northern Roraima State (Guiana Shield). These rocks are very well-dated by the U-Pb method (seven determinations on zircon and baddeleyite), whose 1788 ± 2 Ma mean age is interpreted as the rock
crystallization age (Reis et al. 2013, Bispo-Santos et al. 2014b). A paleomagnetic pole graded with quality fac-tor (Q) five (Tab. 1) was found for the Avanavero event. Studies of magnetic mineralogy, petrography and a pos-itive baked contact test point out to a primary nature of ChRM directions isolated for these rocks (Bispo-Santos et al. 2014b).
he Avanavero pole agrees with coeval poles from Baltica and Laurentia, if SAMBA reconstruction is considered, based on geological and geochronological data (Bispo-Santos et al. 2014b) (Fig. 5C). Furthermore, we can envisage the agglu-tination of these masses, starting from the reconstruction at 2000 Ma ago in Fig. 4, in which the landmass formed by proto-Amazonia, West Africa and Volgo-Sarmatia obliquely collided with Fennoscandia, and other cratonic masses that formed Laurentia.
However, the Avanavero pole is very diferent from the Colider pole, and therefore does not support Columbia’s models suggested by Bispo-Santos et al. (2008) (Fig. 5A),
based on the Colíder pole, and D’Agrella-Filho et al. (2012) (Fig. 5B), according to Paleo- to Mesoproterozoic poles. Two hypotheses could be raised to explain this diference:
1. although the rocks have similar ages, their magnetiza-tions were acquired at diferent times;
2. their magnetizations were obtained during rock crystal-lization at 1780 to 1790 Ma, however, a relative move-ment occurred between the two areas after magnetiza-tion was acquired by rocks.
If we accept the irst hypothesis, four facts lead us to assume that SAMBA model (Johansson 2009) should pre-vail over those proposed by Bispo-Santos et al. (2008) and D’Agrella-Filho et al. (2012). herefore:
1. the Avanavero pole was obtained for anorogenic rocks emplaced in an intracratonic environment (Guiana Shield), whose Hadean-Archean to Paleoproterozoic basement was only partially afected in its southern part by the 1200 Ma K’Mudku event (Cordani et al. 2010);
2. the magnetic and petrographic evidence added to a pos-itive baked contact test obtained for Avanavero rocks suggest that their ChRM directions most likely result from thermo-remanent magnetizations acquired during rock cooling at about 1789 Ma ago;
3. no stability tests were performed for the Colíder rocks; Colíder pole was obtained for 1780-1790 Ma felsic rocks from the southern part of Amazonian Craton, where NW-SE magmatic arcs were being formed along the Jauru Terrain up to the inal collision of Paraguá Terrain at 1320 Ma (Bettencourt et al. 2010). his makes easier to assume that the Colíder pole represents a secondary magnetization;
4. the presently available 1530 Ma paleomagnetic data for Amazonia, Baltica and Laurentia are also consistent with the SAMBA model (Pesonen et al. 2012).
On the other hand, if both magnetic records represent the primary magnetization, a possible explanation for the diference in the paleomagnetic poles from Colíder and Avanavero igneous units could be that after their emplace-ment at 1780 Ma ago, approximately NW dextral strike-slip motions occurred between the northern part of the craton where the Avanavero sills and dykes crop out, and the south-ern of the craton, in which the acid volcanic rocks from Colíder Group are housed in (Bispo-Santos et al. 2014b).
Another interesting fact emerges when the ~1420 Ma Nova Guarita and Indiavaí poles are compared with coeval poles from Baltica and Laurentia, after their rotation to the SAMBA coniguration (see Fig. 12 in Bispo-Santos et al. 2014b). In such case, a diference between these poles is also observed, which is similar to that of the Avanavero-Colíder poles and once more point to NW dextral movements
between the southern part of the Amazonian Craton and the northernmost portions of the Columbia supercontinent. herefore, it suggests that if these strike-slip movements are real, they must have occurred after 1420 Ma.
In this scenario, the recent recognition of the Trincheira ophiolite in southwestern Amazonian Craton (Rondônia State) suggests that collision of the Paraguá Terrain with the proto-Amazonian Craton along the Alto Guaporé Belt occurred between ~1470 and 1320 Ma (Bettencourt et al. 2010, Rizzotto & Hartmann 2012). his collisional event probably originated the NW-SE lineaments (Buiuçu Shear Zone; Almeida et al. 2012) observed to the east of Trincheira ophiolite, where mylonitic rocks were dated at 1466.5 ± 1.4 Ma
(Ar-Ar on muscovite) and 1467.8 ± 0.8 Ma (Ar-Ar on
sericite). hese shear zones are interpreted as the result of the Rondonian-San Ignacio orogeny (Cordani et al. 1979, Tassinari et al. 1996, Almeida et al. 2012) that led to the colli-sion of Paraguá Terrain. In face of these facts, Bispo-Santos et al. (2014b) speculated that if both paleomagnetic poles rep-resent primary ChRM directions, reactivation of these faults could be, at least partly, responsible for the NW-SE dextral movements implied by the available paleomagnetic data.
Furthermore, later tectonic events afected the Amazonian Craton, which may have produced relative movements between the northern Guiana Shield and the Brazil-Central Shield. We highlight the Late Mesoproterozoic intracratonic displacements associated with the Amazonian Craton/Laurentia collision along the Sunsás-Grenville orogenic belts – e.g. the 1200-950 Ma Aguapeí mobile belt; the ca. 1100 Ma NBB; and NE-SW shear zones associated with ca. 1200 Ma K’Mudku event that afected the southern part of the Avanavero event (Reis et al. 2003, Tohver et al. 2004a, Teixeira et al. 2010, Cordani et al. 2010). ENE-WSW to NE-SW shear zones associated with the Rondônia-San-Ignacio rocks in Rondônia State, which were dated at 1300.1 ± 1.4 Ma (plateau Ar-Ar age in muscovite),
may have been caused by Sunsás orogen activity (Almeida
et al. 2012). Also, the polydeformed basement to the north of the NBB is marked by intense shear zones at about 1150 Ma, although mylonitic rocks formed in the tectonic process display a systematic sinistral shear sense in this case (Tohver
et al. 2004a).
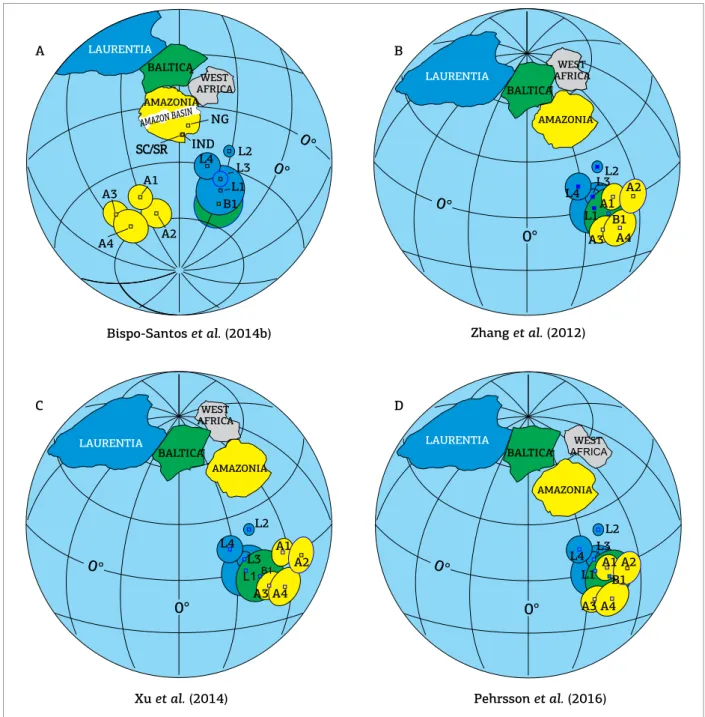
Other models of Columbia, however, are possible, for which smaller mismatches of the Mesoproterozoic poles from Amazonia, Baltica and Laurentia are observed (e.g. Zhang
et al. 2012, Xu et al. 2014, Pehrsson et al. 2016). Recently, D’Agrella-Filho et al. (2016) presented new paleomagnetic
data about the 1440 Ma Salto do Céu maic sills and sedi-mentary rocks cut by the sills. Comparison of selected 1460-1400 Ma poles from Baltica and Laurentia with available Mesoproterozoic poles from Amazonia are shown in Fig. 6 for each reconstruction of Columbia proposed by Bispo-Santos et al.
Figure 6. Comparison of Mesoproterozoic poles from the Amazonian Craton, Laurentia, and Baltica considering the reconstruction of Columbia proposed by (A) Bispo-Santos et al. (2014b); (B) Zhang et al. (2012); (C) Xu et al. (2014); and (D) Pehrsson et al. (2016) (based on D’Agrella-Filho et al. 2016). Mesoproterozoic paleomagnetic poles,
and their conidence circles (α
95): Amazonia – (A1) Rio Branco Sedimentary rocks; (A2) Salto do Céu sills; (A3) Nova Guarita Dykes; (A4) Indiavaí Intrusive (Tab. 1); Baltica – (B1) 1460 Ma mean pole (Bispo-Santos et al. 2014b); Laurentia – (L1) 1460 Ma mean pole; (L2) McNamara pole (1401 ± 6 Ma); (L3) Electra Lake Gabbro (1433 ± 2 Ma); (L4) Laramie Anorthosite (1429 ± 9 Ma) (Bispo-Santos et al. 2014b). Paleomagnetic poles are represented in the same color of the respective cratonic blocks. Euler rotation poles used for paleomagnetic poles and cratonic blocks
as in D’Agrella-Filho et al. (2016). Geographical positions of Salto do Céu sills (SC), Rio Branco sedimentary rocks
(SR), Indiavaí Intrusive (IND) and Nova Guarita Dykes (NG) are shown in (A).
A B C D L2 L4 L3 L1 A2 A1 A3 A4 B1 B1 L1 L4 L2 L3 A1 A2 A4 A3 0° 0° SC/SR NG IND AMAZON BASIN LAURENTIA BALTICA WEST AFRICA AMAZONIA
Bispo-Santos et al. (2014b) Zhang et al. (2012)
L2 L4
L1
L3 A1A2
A3 A4
Xu et al. (2014)
L1 L4 L2 L3 B1 A1 A2 A3 A4
Pehrsson et al. (2016)
B1 0° 0° 0° 0° 0° 0° LAURENTIA BALTICA WEST AFRICA AMAZONIA LAURENTIA LAURENTIA BALTICA BALTICA WEST AFRICA WEST AFRICA AMAZONIA AMAZONIA L2 L4 L3 L1 A2 A1 A3 A4 B1 B1 L1 L4 L2 L3 A1 A2 A4 A3 0° 0° SC/SR NG IND AMAZON BASIN LAURENTIA BALTICA WEST AFRICA AMAZONIA
Bispo-Santos et al. (2014b) Zhang et al. (2012)
L2 L4
L1
L3 A1A2
A3 A4
Xu et al. (2014)
L1 L4 L2 L3 B1 A1 A2 A3 A4
Pehrsson et al. (2016)
(2014b), Zhang et al. (2012), Xu et al. (2014), and Pehrsson et al. (2016), as seen in Figs. 6a to 6d, respectively. he best clus-ter of poles is obtained through the reconstruction of Pehrsson
et al. (2016), in which Amazonia appears rotated counter-clockwise relative to the reconstruction of Bispo-Santos et al. (2014b) (Fig. 6a), and may indicate internal plate rotations inside Columbia. Note this reconstruction is similar to that proposed by Bispo-Santos et al. (2012). Nevertheless, it is clear that new Mesoproterozoic poles from the Amazonian Craton, mainly from the northern Guiana Shield, are required before we decide the best model proposed for Columbia.
THE AMAZONIAN CRATON:
RODÍNIA’S PRODIGAL SON
he Amazonian Craton is one of the largest and most complete fragments of Rodínia’s rupture, and possibly the only one of its descendants to take part in the Western Gondwana. Trying to increase our understanding about the paleogeographic evolution and dynamic interaction between Laurentia and the Amazonian Craton, other paleomagnetic investigations were carried out. Sedimentary rocks belonging
to the Aguapeí Group and maic sills cutting these rocks became the targets of paleomagnetic studies performed in western Mato Grosso State by D’Agrella-Filho et al. (2008) and Elming et al. (2009), respectively. For the study of the Aguapeí Group, redbeds described as belonging to Fortuna Formation (the basal unit) and gray pelitic sedimentary rocks of Vale da Promissão Formation (intermediate unit) were collected close to Vila Bela (next to the Brazil-Bolivia boundary) and Rio Branco (on the other side of the basin) cities, respectively. U-Pb detrital zircon ages ranging from 1453 ± 10 Ma to 1165 ± 27 Ma (n = 89) established the
maximum deposition age for the Fortuna Formation at 1165 Ma (Santos et al. 2001, Leite & Saes 2003).
he paleomagnetic study of Fortuna Formation rocks enabled isolating ChRM directions carried by diagenetic hematite (D’Agrella-Filho et al. 2008). An age of 1149 ± 7 Ma
was assigned to Fortuna Formation pole (Tab. 1), based on U-Pb (SHRIMP) dating of authigenic xenotime rims on detrital zircon grains. This paleomagnetic pole, when compared with coeval poles belonging to Laurentia (D’Agrella-Filho et al. 2008), seems to support the model proposed by Tohver et al. (2004b), which suggests an oblique collision followed by a strike-slip movement between the Amazonian Craton and Laurentia (Fig. 7). A similar model was used to explain the Colombian-Oaxaquian peri-Amazonian fring-ing arc system (Putumayo orogeny) outboard of Amazonia that evolved during the Amazonia transcurrent movement up to its inal collision with Baltica in late Mesoproterozoic times (Ibanez-Mejia et al. 2011).
On the other hand, the gray pelitic sedimentary rocks collected near Rio Branco region disclosed reversed ChRM directions, in general, carried by magnetite. he absence of direct geochronological dating of these rocks did not per-mit to establish the age of the corresponding paleomagnetic pole (D’Agrella-Filho et al. 2008).
Paleomagnetic and geochronological studies were also performed on Aguapeí maic sills (Rio Branco region, Mato Grosso State) cutting the pelitic sedimentary rocks (Elming
et al. 2009). hese sills and dykes belong to Salto do Céu Intrusive Suíte (Araújo-Ruiz et al. 2007), but Elming et al. called them Aguapeí (hereafter we will use the Salto do Céu original name, see also D’Agrella-Filho et al. 2016). In sum-mary, the laboratorial treatments (alternating ield – AF and thermal demagnetization) revealed southwest (northeast) directions with downward (upward) inclinations for ten sites (Dm = 11.3°; Im = -57.9°; α
95 = 8.1°, K = 37), which
yielded a paleomagnetic pole (Salto do Céu pole) located at 64.3°S; 271.0°E (A95 = 9.2º). An age of 981 ± 2 Ma was
determined for one of the sills by 40Ar-39Ar (whole rock).
Assigning this age to Salto do Céu pole, Elming et al. (2009) proposed a paleogeographic reconstruction, showing the
Figure 7. Geodynamical interaction model of the Amazonian Craton and Laurentia between 1200 Ma
and 980 Ma (ater Elming et al. 2009). Amazonian
positions relative to Laurentia (North America in its present position) are shown at 1200 Ma (based on Nova Floresta pole – NF pole in Tab. 1), at 1150 Ma (based on Fortuna Formation pole – FT in Tab. 1), and at 980 Ma (based on Aguapeí sills pole of Elming et al. 2009).
LAURENTIA
BALTICA
AMAZONIA
AMAZONIA AMAZONIA
300O
980 MA
1150 MA
Amazonian Craton position relative to Laurentia at ~980 Ma ago (Elming et al. 2009), which follows the transcurrent model irstly proposed by Tohver et al. (2004a, 2004b) and later supported by D’Agrella-Filho et al. (2008), as in Fig. 7.
Two facts should be highlighted in this reconstruction:
1. Laurentia paleomagnetic poles in the age range between 1000 and 900 Ma come from high-grade metamorphic rocks related to the Grenville event. he ages of these poles were obtained, in general, from 40Ar-39Ar single-mineral
dating (amphibole, biotite, and plagioclase), and it is not always easy to correlate radiometric and rock magneti-zation ages;
2. he paleogeographic reconstruction proposed by Elming et al. (2009) was based on the transcurrent model of Tohver
et al. (2004a, 2004b), which shows that the Amazonian Craton at 980 Ma (based on Salto do Céu pole) rotated approximately 180° to its position at 1200 Ma (based on Nova Floresta pole of Tohver et al. 2002), during the ~3000 km sinistral motion along the Grenvillian margin (see Fig. 7). Although such large rotations may occur, the inal position of the Amazonian Craton to Laurentia is very diferent from that normally admitted in Rodínia reconstructions (see Weil et al. 1998, D’Agrella-Filho et al. 1998, Li et al. 2008, Ibanez-Mejia et al. 2011).
A new U-Pb dating on baddeleyite extracted from Salto do Céu sill (Rio Branco region) has recently yielded an upper intercept age of 1439 ± 4 Ma on the U-Pb concordia
dia-gram, which is interpreted as the crystallization age of the rock (Teixeira et al. 2016). his age contrasts with the previous 981
± 2 Ma Ar-Ar age and enables an alternative interpretation
for Salto do Céu sills pole. he new baddeleyite age correlates well with the U-Pb zircon ones of 1471 ± 8 Ma and 1427 ±
10 Ma, respectively, for a gabbro and a granophyre belong-ing to Rio Branco maic-felsic Suite (Geraldes et al. 2001), suggesting that Salto do Céu sills belong to the same event.
Geraldes et al. (2014) presented a provenance study on 100 detrital zircons extracted from Rio Branco sedimentary rocks at Salto do Céu region (their AG-1 sample). he U-Pb determinations showed four age populations for these zir-cons: 1544, 1655, 1812, and 2515 Ma. he younger popu-lation (age peak of 1544 Ma) may represent detrital zircons derived from the Cachoeirinha event rocks (from 1580 to 1520 Ma), and indicate the maximum depositional age for that unit (Geraldes et al. 2014). he identiication by Ruiz (2005) of xenoliths from these sedimentary rocks inside the Rio Branco igneous rocks (age of 1427 ± 10 Ma) also
suggests they are older than those near Vila Bela, whose detrital zircon ages indicate a maximum of 1126 Ma for them (Santos et al. 2001, Leite & Saes 2003). These results demonstrate that the pelitic sedimentary
rocks previously interpreted as the intermediate unit of Aguapeí Group must in fact be correlated with other sedimentary rocks, probably the Dardanelos Group to the north of the Phanerozoic Serra dos Parecis sed-imentary cover (Lacerda-Filho et al. 2004). In such case, Salto do Céu sills pole (now dated at 1439 Ma) cannot be used to represent the Amazonian Craton position in the context of Rodínia, and the paleogeo-graphic interpretation made by Elming et al. (2009) using this pole should be revised.
Trying to prove the primary nature of the magnetization carried by the sills, recently, D’Agrella-Filho et al. (2016) sampled eight new paleomagnetic sites from Salto do Céu sills and samples from ive proiles of sedimentary rocks close to the contact with the sills for baked contact tests. he results obtained for the sills and sedimentary rocks are similar to those from Elming et al. (2009) and D’Agrella-Filho et al. (2008), respectively, in the previous studies of these rocks. More statistically robust paleomagnetic poles were calculated for the sedimentary rocks (A1 pole in Tab. 1 – now called Rio Branco sedimentary rocks pole) and for the sills (A2 pole in Tab. 1) that supersede older poles. Although the baked contact test was inconclusive, because no difer-ent magnetization direction was disclosed for sedimdifer-entary rocks far from the sills, ages around 1440 Ma for these paleomagnetic poles are supported by the Nova Guarita (1419 Ma) and Indiavaí (1416 Ma) poles. Fig. 6A shows the poles for the sedimentary rocks from Rio Branco area (pole A1), Salto do Céu sills (pole A2), the 1419 Ma Nova Guarita dyke swarm (pole A3), and the 1416 Ma Indiavaí Intrusive (pole A4). All these poles plot close together sug-gesting similar ages for all of them.
Recently, Evans (2013) (followed by Johansson 2014) proposed an alternate scenario for the dynamic interaction between Laurentia, Baltica, and the Amazonian Craton (see Fig. 3 in Evans, 2013) that totally contrasts with that pro-posed by Tohver et al. (2004b), D’Agrella-Filho et al. (2008) and Elming et al. (2009). Due to the polarity ambiguity, Evans (2013) argues that a diferent model may be pro-posed if we use the Amazonian Craton’s anti-poles. In the Evans’ model, after SAMBA rupture in Columbia, Baltica and Amazonian Craton performed clockwise rotations, and docked again with Laurentia, the Amazonian Craton faced to Grenville Belt in the present Labrador region. Partially based on paleomagnetic data, Fig. 8 shows a pos-sible dynamic scenario for Columbia rupture, clockwise rotation of Amazonia and Baltica, and posterior collision of these blocks with Laurentia. Paleomagnetic data suggest that Laurentia and Baltica behaved as a unique block at least up to 1265 Ma (Salminen & Pesonen 2007). Fig. 8B provides the coniguration of SAMBA connection (after Bispo-Santos