Article
Printed in Brazil - ©2013 Sociedade Brasileira de Química0103 - 5053 $6.00+0.00A
*e-mail: [email protected]
Evaluation of the Oxidative Stability of Biodiesel Blends from Soybean,
Tallow and Castor Bean using Experimental Mixture Design
Anaildes L. Carvalho,a Sarah M. F. Santana,a Cristiane S. Silva,b Iuri M. Pepe,b
Marcos A. Bezerra,c Leandro M. Aragão,b Cristina M. Quintellaa,d and
Leonardo S. G. Teixeira*,a,d
aInstituto de Química, Universidade Federal da Bahia, Campus de Ondina,
40170-115 Salvador-BA, Brazil
bLaboratório de Propriedades Óticas (LaPO), Instituto de Física, Universidade Federal da Bahia,
Campus de Ondina, 40170-115 Salvador-BA, Brazil
cLaboratório de Química Analítica, Universidade Estadual do Sudoeste da Bahia,
45200-190 Jequié-BA, Brazil
dInstituto Nacional de Ciência e Tecnologia (INCT) de Energia e Ambiente,
Universidade Federal da Bahia, 40170-115 Salvador-BA, Brazil
Nesse estudo um planejamento experimental de misturas de biodieseis é utilizado para avaliar e otimizar a estabilidade oxidativa de amostras de biodiesel de soja contendo diferentes teores de biodiesel de sebo e de mamona. As misturas de biodieseis foram preparadas com teores que variaram entre 80-86% (v/v) para a soja, 5-15% (v/v) para o sebo e 1-10% (v/v) para a mamona. O período de indução da amostra de biodiesel de soja puro serviu de base para a comparação com a estabilidade das misturas. A estratégia de planejamento experimental de misturas mostrou-se adequada para a formulação de misturas de biodiesel com ótima estabilidade oxidativa. O modelo quadrático obtido na etapa de otimização ajustou-se adequadamente aos dados experimentais, sendo capaz de prever as proporções ótimas para misturas com maior estabilidade oxidativa. O melhor período de indução foi obtido com as seguintes proporções: 82,5% (v/v) de soja, 7,5% (v/v) de sebo e 10,0% (v/v) de mamona.
This study proposes an experimental design of biodiesel constrained mixtures to evaluate and optimize the oxidative stability of soybean biodiesel mixed with different amounts of tallow and castor bean biodiesels. To prepare the biodiesel blends, the proportions of each type of biodiesel were varied, producing mixtures that contained 80-86% (v/v) soybean, 5-15% (v/v) tallow, and 1-10% (v/v) castor bean biodiesel. The induction period of pure soybean biodiesel served as the baseline for comparing the stability of the mixtures. The experimental design strategy was capable of producing the best oxidative stability for biodiesel mixtures. The quadratic model obtained in the optimization stage fits the experimental data well. The higher induction period occurred at the following composition: 82.5% (v/v) soybean, 7.5% (v/v) tallow and 10.0% (v/v) castor bean.
Keywords: biodiesel, oxidative stability, mixture experimental design, soybean, tallow, castor bean
Introduction
Biodiesel is an alternative fuel to petrodiesel with potential to change the worldwide energy matrix and decrease the impact of fossil fuels on the environment.
It is composed of mono-alkyl esters from fatty acids derived from vegetable oil, which may help reduce greenhouse gas emissions and promote the inclusion of
rural communities in the biofuel economy.1,2 In addition,
biodiesel is biodegradable, functions as a lubricant in its pure form and has comparable fuel properties to those
Biodiesel has been marketed as a substitute for petrodiesel and as an additive to fossil fuels. However, biodiesels inherently possess low oxidative stability, which
must be taken into account in any practical application.4
Factors such as humidity, temperature and light exposures, as well as contact with oxygen in the atmosphere, unsaturated compounds and metals, all affect the oxidative stability and quality of the biodiesels. Biodiesels are less resistant to oxidation than typical fossil fuels. Therefore, the presence of biodiesels in petrodiesel may significantly
affect the stability of the mixture.5 As a result, it is important
to conduct evaluation studies and develop technologies that increase the biodiesel resistance to oxidation during long
storage periods.6,7
The physicochemical properties of biodiesels depend on the raw materials that are used. Therefore, one way to increase the resistance to degradation and improve the final product quality is to use a mixture of biodiesels
derived from different forms of biomass.8 Depending on the
raw material, biodiesels will contain varying amounts of unsaturated compounds. These compounds are susceptible to oxidation reactions, which are accelerated by exposure to oxygen and high temperatures, and may result in polymeric compounds that are harmful to internal combustion
engines.4,9 Biodiesel mixtures have been employed to
improve important fuel properties, such as the specific mass, viscosity, flash point, cold filter plugging point (CFPP) and oxidative stability.10-12
Biodiesel from soybean was blended with palm and rapeseed biodiesels having higher oxidation stability,
improving the quality of the final blend.13 Biodiesels from
jatropha and pongamia oils, and palm biodiesel were blended with different ratios and a close relationship was observed between oxidation stability and the fatty acid
methyl ester (FAME) composition.14 Blends of biodiesel
from palm, sacha-inchi, jatropha and castor oils were prepared as a strategy to obtain a biodiesel with a better oxidative stability and the best biodiesel blend was made
of 75% jatropha and 25% castor.15 Sarin et al.16 examined
blends of jatropha and palm biodiesel in order to achieve an optimal blend in terms of oxidative stability. Single, binary, ternary and quaternary mixtures of canola, palm, soybean and sunflower oil methyl esters were prepared, and
fuel properties were measured, including stability.17
Soybean oil is an important raw material for biodiesel production. In Brazil, soybean oil constitutes approximately
85% of the raw material used in biodiesel production.18
However, 75% of the triacylglycerides in soybean oil are formed from unsaturated fatty acids, which are comprised
of more than 50% linoleic acid (C18:2).19 Unsaturated fatty
acids are incorporated into biofuels and reduce the stability
of the fuel. As a result, soybean biodiesel requires additives
to allow the product to meet certain specifications.18
In contrast to soybean oil, animal fat contains a large amount of saturated compounds, which results in greater
product stability.20 Castor bean biodiesel is composed
of approximately 90% ricinoleic acid, which increases
the oxidative stability of this biodiesel.21 Because of the
stability issues with soybean biodiesel and the favorable characteristics of castor bean and tallow biodiesels, the use of blends of these fuels may be a suitable method to improve the stability of mixtures that contain mostly soybean biodiesel. In this way, experimental design methods can provide a convenient approach to identify an ideal mixture composition to yield a product with increased oxidative stability.
Experimental mixture design is used in various fields of science and industry, especially in the chemical industry, to obtain models used to estimate parameters and
optimize various processes.22,23 In addition, experimental
design methods save time and resources because fewer samples and experiments are necessary than with univariate
assessments.24 In studies on biodiesel, although experimental
design has been used for formulations purposes,25 the main
application of this strategy is to investigate the influence of
process variables on the biodiesel production.26-28
Experimental designs, such as mixture designs, are efficient processes for discovering relationships between the response variables and various parameters that influence
these responses.29 In the mixture design approach, the
sample properties are determined by the proportion
of the components (xi) in the mixture, which are not
independent.30 The sum of the fractions of the mixture
components always added to 100%, and if the percentage of one component in the mixture was altered, then the percentage of one or more of the other components also
varies.31 Another relevant characteristic of the independent
variables is that their relative proportions, as opposed to their absolute quantities, affected the product properties. The graphical representation of a ternary mixture is an equilateral triangle, and the vertices correspond to the pure components, the sides correspond to binary mixtures, and
the internal points correspond to ternary mixtures.32
The present study proposes the use of a constrained mixture design to evaluate the influence of each type of biodiesel component (soybean, tallow and castor bean) on the oxidative stability of biodiesel blends. This study also determined the composition with the greatest stability.
Experiment
(Candeias, Brazil) and Comanche Biocombustíveis da Bahia (Simões Filho, Brazil). It is worth emphasizing that soybean biodiesel was a commercial sample with synthetic antioxidants. The castor bean oil was supplied by Bom Brasil (Salvador, Brasil) and the biodiesel was prepared in a batch laboratory-scale transesterification process, according
to the procedure by Berman and Wiesman.33 All biodiesel
samples were obtained from transesterification reactions through methylic route.
Experimental design
In the present study, the induction period (IP) of
biodiesel mixtures (y) was determined using the following
generalized quadratic model:34
(1)
In equation 1, the first summation contains terms representing the linear terms of all components and describes effects related to IP of the pure components in the mixture. In contrast, the second summation describes the binary interactions between biodiesel sample pairs with respect to IP. The constrained mixture design used in this study allowed for the evaluation of the model and
interactions between variables.24 Statistica version 7.0
software was used to analyze the experimental data. Normally, the mixture designs consider only a subregion or a smaller space within the experimental region. This situation occurs when additional constraints in the form of upper and/or lower limits are placed on the component proportions. These types of mixture designs are named
pseudocomponent design and the sum of the values of the
pseudocomponents is equal to 1.29
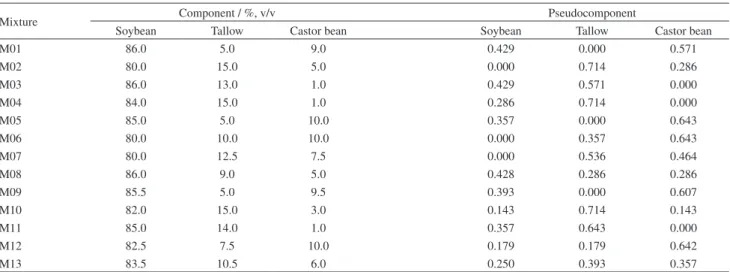
Samples were prepared with different proportions of biodiesel from soybean (the major component), castor bean and tallow, which are shown in Table 1. It was used a constrained mixture design because soybean biodiesel must be present in the greatest proportion in the blends. In this design, the maximum concentration of 86, 15 and 10% (v/v) was established for soybean, tallow, and castor bean biodiesels, respectively. The minimum concentration of soybean, tallow and castor bean biodiesels was 80, 5 and 1% (v/v), respectively. The pseudocomponents were calculated as:
(2)
where xi’: pseudocomponent, x
i: real concentration of
component and Ci: lower limit of the component. Table 1
shows the volume percent proportions of the mixtures along with their pseudocomponent values.
Determination of the oxidative stability
The oxidative stability of the biodiesel samples was
determined according to the EN 14112 standard,35 using
a Metrohm Rancimat 743 unit (Herisau, Switzerland). During the procedure, 3 g of each sample were placed in a Rancimat reaction vial, and the oxidation was induced
by passing air over the sample (10 L h-1) at a constant
temperature of 110 °C. These conditions accelerated the formation of oxidized compounds, and the resulting gases were directed into a measuring cell containing deionized water. The conductivity of the water in the measuring cell
Table 1. Experimental design matrix
Mixture Component / %, v/v Pseudocomponent
Soybean Tallow Castor bean Soybean Tallow Castor bean
M01 86.0 5.0 9.0 0.429 0.000 0.571
M02 80.0 15.0 5.0 0.000 0.714 0.286
M03 86.0 13.0 1.0 0.429 0.571 0.000
M04 84.0 15.0 1.0 0.286 0.714 0.000
M05 85.0 5.0 10.0 0.357 0.000 0.643
M06 80.0 10.0 10.0 0.000 0.357 0.643
M07 80.0 12.5 7.5 0.000 0.536 0.464
M08 86.0 9.0 5.0 0.428 0.286 0.286
M09 85.5 5.0 9.5 0.393 0.000 0.607
M10 82.0 15.0 3.0 0.143 0.714 0.143
M11 85.0 14.0 1.0 0.357 0.643 0.000
M12 82.5 7.5 10.0 0.179 0.179 0.642
was continuously monitored, and a sudden increase in the conductivity of the solution (water plus volatile component) occurred after the absorption of volatile acidic compounds into the water. The time until the sudden increase in conductivity was called the induction period (IP). After the induction period, the oxidation rate, peroxide index, oxygen absorption and formation of volatile compounds,
all rapidly increased.36 Rancimat analyses of each mixture
sample were done in duplicate.
Results and Discussion
Analysis of responses
The proportions of soybean, tallow and castor bean biodiesel were varied to optimize the oxidative stability within the constrained mixture design. IP of the pure soybean biodiesel sample was 9.5 h and served as the baseline to compare the stability of the mixtures. The tallow and castor bean biodiesel samples had an IP of 21.0 and 87.6 h, respectively. As shown in Table 2, most of the mixtures possessed greater IP than the pure soybean biodiesel sample.
Samples M04, M06, M07, M10, M11 and M12 displayed the highest IP. These samples contained large proportions of tallow or castor bean biodiesel, and M06 and M07 contained some of the lowest proportions of soybean biodiesel. These findings indicate that tallow and castor bean biodiesels tend to increase the oxidative stability and that soybean biodiesel tends to decrease the oxidative stability. The latter claim is supported by samples M01 and M05, which have the lowest IP and greatest proportion of soybean biodiesel.
Samples may behave differently from what is expected due to interactions between the components of the mixture, which are not necessarily linear or additive in nature. In
other words, when a response is obtained that is greater than expected from the mixture composition, there is a positive synergistic effect among the components of the blend. When a response is lower than expected, an antagonistic effect dominates the mixture.
The significance of the observed effects was verified using the analysis of variance (ANOVA) method along
with the significance levels represented by the p-value. The
ANOVA results were used to generate a Pareto chart, which estimated the effects of individual factors and interactions between the concentrations of soybean, tallow and castor bean biodiesel components (Figure 1). The lengths of the bars are proportional to the absolute values estimated for the individual effects and interactions, and the graph presents a comparison of the relative importance of each of the components in the system.
Figure 1 shows that the tallow biodiesel and castor bean biodiesel exerted significant positive effects on the IP of the mixture. This increased as the concentration of tallow or castor bean biodiesel was increased. Soybean biodiesel also exerted significant effect, however with negative influence on IP. Furthermore, Figure 1 also demonstrates that the interaction between soybean and tallow biodiesel (A × B) affect IP, confirming a synergistic effect. Moreover, the interactions between tallow and castor beans (B × C), and soybeans and castor beans (A × C) were not significant.
The experimental data were fit by the quadratic model shown in equation 3:
y = –57.3A + 11.3B + 25.2C + 144.8AB +
83.7AC + 4.42BC (3)
In this expression, y is IP; A, B and C represent the
concentrations of biodiesel from soybean, tallow and
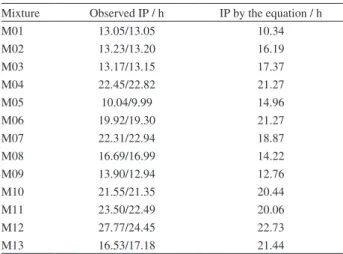
Table 2. Induction period (IP) of the biodiesel samples obtained by the Rancimat analysis and quadratic model
Mixture Observed IP / h IP by the equation / h
M01 13.05/13.05 10.34
M02 13.23/13.20 16.19
M03 13.17/13.15 17.37
M04 22.45/22.82 21.27
M05 10.04/9.99 14.96
M06 19.92/19.30 21.27
M07 22.31/22.94 18.87
M08 16.69/16.99 14.22
M09 13.90/12.94 12.76
M10 21.55/21.35 20.44
M11 23.50/22.49 20.06
M12 27.77/24.45 22.73
M13 16.53/17.18 21.44
castor bean, respectively; and AB, AC and BC represent the interactions between the variables.
Table 2 compares the experimentally observed IP with the value that was calculated using equation 3. Figure 2a shows the surface described by the quadratic model, and Figure 2b shows the associated contour map. These figures show that IP decreased in samples with the greatest proportion of soybean biodiesel. In addition, greater proportions of tallow and castor bean biodiesel tend to increase IP of the mixtures.
The established restrictions have delimited an asymmetrical experimental region and some predicted values may be discordant from that obtained experimentally. However, considering the errors inherent to the system and the response surface (Figure 2a), it is possible to establish that the optimum proportion indicated by the equation has better induction period. Figure 2a shows that the response surface has the same behavior profile of the experimental results.
The negative value of the first term of the equation 3 indicates that the increase of the proportion of soybean
biodiesel decreases the response y (IP). However, the main
effects of the second and third terms of the equation are positive and indicate that the increase of the proportion of tallow and castor bean biodiesels contributes to increase the IP of the mixture. The high value of AB coefficient means that the simultaneous presence of tallow and soybean biodiesel results in higher responses than expected; and it is possible to infer that the mixture of biodiesel from tallow and soybean has a synergistic effect. This synergistic effect of soybean and tallow biodiesel is very interesting as these two biofuels are the most used ones in Brazil’s energetic matrix.
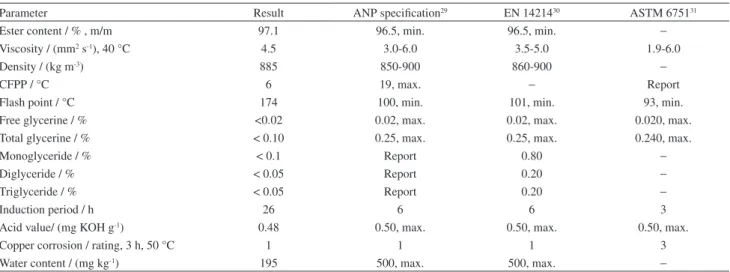
The higher IP occurred at the following composition: 82.5% (v/v) soybean, 7.5% (v/v) tallow, and 10.0% (v/v) castor bean. A biodiesel sample prepared with this proportion has been analysed and its physicochemical parameters are shown in Table 3. All results are within Brazilian
Regulatory Agency for Oil, Gas and Biofuels (ANP),37
EN 1421438 and ASTM 675139 quality standards, and as
shown in Table 3, this mixture possessed good quality.
Figure 2. (a) Response surface of the quadratic model obtained for the ternary biodiesel mixtures. (b) Contour map of the global response from the simultaneous optimization of the induction period of the biodiesel samples.
Table 3. Physicochemical properties of 82.5% (v/v) soybean, 7.5% (v/v) tallow and 10.0% (v/v) castor bean biodiesel
Parameter Result ANP specification29 EN 1421430 ASTM 675131
Ester content / % , m/m 97.1 96.5, min. 96.5, min. −
Viscosity / (mm2 s-1), 40 °C 4.5 3.0-6.0 3.5-5.0 1.9-6.0
Density / (kg m-3) 885 850-900 860-900
−
CFPP / °C 6 19, max. − Report
Flash point / °C 174 100, min. 101, min. 93, min.
Free glycerine / % <0.02 0.02, max. 0.02, max. 0.020, max.
Total glycerine / % < 0.10 0.25, max. 0.25, max. 0.240, max.
Monoglyceride / % < 0.1 Report 0.80 −
Diglyceride / % < 0.05 Report 0.20 −
Triglyceride / % < 0.05 Report 0.20 −
Induction period / h 26 6 6 3
Acid value/ (mg KOH g-1) 0.48 0.50, max. 0.50, max. 0.50, max.
Copper corrosion / rating, 3 h, 50 °C 1 1 1 3
Water content / (mg kg-1) 195 500, max. 500, max.
Conclusions
Experimental mixture design proved to be an efficient method to evaluate the influence of soybean, tallow and castor bean biodiesels on the oxidative stability of biodiesel blends. This study has shown that the addition of tallow and castor bean biodiesel tends to improve the induction period of biodiesel samples that mostly consist of soybean biodiesel. This finding encourages further studies on the production of different biodiesel blends to improve the final product quality. In general, the experimental mixture design has proven useful in determining the optimal composition of soybean biodiesel mixtures with respect to induction period.
Acknowledgments
The authors thank the Fundação de Amparo à Pesquisa do Estado da Bahia (FAPESB) and the Conselho Nacional de Desenvolvimento Científico e Tecnológico (CNPq) for financial support.
References
1. Pinto, A. C.; Guarieiro, L. L. N.; Rezende, M. J. C.; Ribeiro, N. M.; Torres, E. A.; Lopes, W. A.; Pereira, P. A. P.; de Andrade, J. B.; J. Braz. Chem. Soc.2005, 16, 1313. 2. Mendonça, D. R.; Andrade, H. M. C.; Guimarães, P. R. B.;
Vianna, R. F.; Meneghetti, S. M. P.; Pontes, L. A. M.; Teixeira, L. S. G.; Fuel Process. Technol.2011, 92, 342. 3. Souza, A. G.; Danta, H. J.; Silva, M. C. D.; Santos, I. M. G.;
Fernandes Jr., V. J.; Sinfrônio, F. S. M.; Teixeira, L. S. G.; Novák, C; J. Therm. Anal. Calorim.2007,90, 945.
4. Jain, S.; Sharma, M. P.; Biomass Bioenergy2011, 35, 4008. 5. Dunn, R. O.; Knothe, G.; J. Am. Oil Chem. Soc.2003,80, 1047. 6. Quintella, C. M.; Teixeira, L. S. G.; Korn, M. G. A.; Costa
Neto, P. R.; Torres, E.; Castro, M. P.; Jesus, C. A. C.; Quim. Nova2009, 32, 793.
7. Luo, M.; Zhang, R.-Y.; Zheng, Z.; Wang, J.-L.; Ji, J.-B.; J. Braz. Chem. Soc.2012, 23, 241.
8. McCormick, R. L.; Westbrook, S. R.; Energy Fuels
2010, 24, 690.
9. Ferrari, R. A.; Oliveira,V. S.; Scabio, A.; Sci. Agric.
2005, 62, 291.
10. Zuleta, E. C.; Baena, L.; Rios, L. A.; Calderón, J. A.; J. Braz. Chem. Soc.2012, 23, 2159.
11. Joshi, H.; Moser, B. R.; Toler, J.; Walker, T.; Biomass Bioenergy
2010, 34, 14.
12. Teixeira, L. S. G.; Couto, M. B.; Souza, G. S.; Andrade Filho, M.; Assis, J. C. R.; Guimarães, P. R. B.; Pontes, L. A. M.; Almeida, S. Q.; Teixeira, J. S. R.; Biomass Bioenergy
2010, 34, 438.
13. Park, J. Y.; Kim, D. K.; Lee, J. P.; Park, S. C.; Kim, Y. J.; Lee, J. S.; Bioresour. Technol.2008,99, 1196.
14. Sarin, A.; Arora, R.; Singh, N. P.; Sarin, R.; Malhotra, R. K.; Energy2010,35, 3449.
15. Zuleta, E. C.; Rios, L. A.; Benjumea, P. N.; Fuel Process. Technol.2012,102, 96.
16. Sarin, R.; Sharma, M.; Sinharay, S.; Malhotra, R. K.; Fuel
2007,86, 1365.
17. Moser, B. R.; Energy Fuels2008, 22, 4301.
18. Alberici, R. M.; Simas, R. C.; Abdelnur, P. V.; Eberlin, M. N.; Souza, V.; Sá, G. F.; Daroda, R. J.; Energy Fuels2010, 24, 6522. 19. Meneghetti, S. M. P.; Meneghetti, M. R.; Serra, T. M.;
Barbosa, D. C.; Wolf, C. R.; Energy Fuels2007, 21, 3746. 20. Goodrum, J. W.; Geller, D. P.; Adams, T. T.; Biomass Bioenergy
2003, 24, 249.
21. Berman, P.; Nizri, S.; Wiesman, Z.; Biomass Bioenergy
2011, 35, 2861.
22. Giese, E. C.; Dekker, R. F. H.; Scarminio, I. S.; Barbosa, A. M.; Silva, R.; Biochem. Eng. J.2011, 53, 239.
23. Soares, D. X.; Scarminio, I. S.; Bruns, R. E.; Anal. Chim. Acta
2011, 702, 288.
24. Barros Neto, B.; Scarminio, I. S.; Bruns, R. E.; Como Fazer Experimentos: Aplicações na Ciência e na Indústria, 4th ed.;
Bookman: São Paulo, Brasil, 2010.
25. Maia, E. C. R.; Borsato, D.; Moreira, I.; Spacino, K. R.; Rodrigues, P. R. P.; Gallina, A. L.; Fuel Process. Technol.
2011,92, 1750.
26. Silva, N. L.; Garnica, J. A. G.; Batistella, C. B.; Maciel, M. R. W.; Maciel Filho, R.; Bioresour. Technol.2011, 102, 2672. 27. Kılıç, M.; Uzun, B. B.; Pütün, E.; Pütün, A. E.; Fuel Process.
Technol.2013, 111, 105.
28. Brito, J. Q. A.; Silva, C. S.; Almeida, J. S.; Korn, M. G. A.; Korn, M.; Teixeira, L. S. G.; Fuel Process. Technol.2012, 95, 33. 29. Karbasi, A.; Moradian, S.; Tahmassebi, N.; Ghodsi, P.; Prog.
Org. Coat.2006,57, 175.
30. Ferreira, S. L. C.; Bruns, R. E.; Silva, E. G. P.; Santos, W. N. L.; Quintella, C. M.; David, J. M.; de Andrade, J. B.; Breitkreitz, M. C.; Jardim, I. C. S. F.; Barros Neto, B. B.; J. Chromatogr., A2007, 1158, 2.
31. Bezerra, M. A.; Castro, J. T.; Macedo, R .C.; Silva, D. G.; Anal. Chim. Acta2010,670, 33.
32. Leardi, R.; Anal. Chim. Acta2009, 652, 161.
33. Berman, P.; Nizri, S.; Wiesman, Z.; Bioresour. Technol.
2011,35, 2861.
34. Garcia, L. M. Z.; Oliveira, T. F.; Soares, P. K.; Bruns, R. E.; Scarminio, I. S.; Chemom. Intell. Lab. Syst.2007, 103, 1. 35. EN 14112: Fat and Oil Derivatives - Fatty Acid Methyl Esters
(FAME), Determination of Oxidation Stability (Accelerated Oxidation Test), Europe, 2003.
37. Agência Nacional do Petróleo, Gás Natural e Biocombustíveis (ANP), Resolução ANP No. 14, de 15/05/2012, Brasil, http:// nxt.anp.gov.br/nxt/gateway.dll/leg/resolucoes_anp/2012/ maio/ranp%2014%20-%202012.xml?fn=document-frameset. htm$f=templates$3.0, accessed in July 2013.
38. EN 14214: Automotive Fuels - Fatty Acid Methyl Esters (FAME) for Diesel Engines, Requirements and Test Methods, Europe, 2009.
39. ASTM D6751-11b: Standard Specification for Biodiesel Fuel Blend Stock (B100) for Middle Distillate Fuels, USA, 2011.