Article
J. Braz. Chem. Soc., Vol. 26, No. 10, 1981-1987, 2015. Printed in Brazil - ©2015 Sociedade Brasileira de Química 0103 - 5053 $6.00+0.00
A
*e-mail: [email protected]
Determination of Essential, Non-Essential, and Potentially Toxic Elements in
Graviola (
Annona muricata
L.) Pulp by ICP OES and GF AAS
Gislayne A. R. Kelmer,a Angerson N. Nascimentob and Pedro V. Oliveira*,a
aInstituto de Química, Universidade de São Paulo, 05508-000 São Paulo-SP, Brazil
bUniversidade Federal de São Paulo, Campus Diadema, 09972-270 Diadema-SP, Brazil
The determination of essential (B, Ca, Co, Cu, Cr, Fe, K, Li, Mg, Mn, P, S, Se, Si, V, and Zn), non-essential (Al, Ba, Sn, Sr, and Ti), and potentially toxic (As, Cd, and Pb) elements in graviola pulp by inductively coupled plasma optical emission spectrometry (ICP OES) and graphite furnace atomic absorption spectrometry (GF AAS) is proposed. Samples were digested in a closed-vessel microwave oven. The accuracy of the proposed method was checked by citrus leaves standard reference analysis. Limits of quantification (LOQ) were in the range of 0.039 µg g-1 (Ti) to
22 µg g-1 (K) for ICP OES and 0.011 µg g-1 (Cd) to 0.62 µg g-1 (Se) for GF AAS. According to
the recommended dietary reference intake (DRI), graviola pulp can be considered a good source of B, Cu, K, Mg, and Mn. For all analysed samples the concentrations of As, Cd, and Pb were below the LOQ.
Keywords: fruit, graviola, element, emission spectrometry, atomic absorption
Introduction
Fruits and nuts from the vast Brazilian territory, especially those coming from the north and northeast of Brazil, have been marketed and applied for different purposes. They can be consumed, used to prepare foods and beverages, used in different cosmetics formulations, and in pharmaceutical industry. In general, the composition of fruits and nuts is rich in unsaturated fats, proteins, fibres, sterols, phytochemicals, and essential and non-essential elements.1-4 Some of these have stimulated
the interest of the scientific community due to the high concentrations of essential elements (e.g., selenium in the Brazil nut) or substances with anti-cancer activity (e.g., graviola).5 However, for many fruits and nuts the elemental
composition remains practically unknown. Besides other nutrients, information about elemental composition is important to organise chemical composition tables, to assist the balance of diets, and to increase the commercial value of these products.6,7
Graviola (Annona muricata L.) is a fruit originating from the tropical regions of South America and Central America. The fruit has a dark green rind and aromatic white pulp. The increasing demand for the fruit has
been attributed to its organoleptic characteristics. These can be consumed in natura or used to prepare juices, ice cream, jams, jellies, creams, and yogurts.8 Identified
in the composition of graviola were alkaloids, amides, steroids, flavonoids, muricins, acetogenins, and neurotoxic substances.9-11 Among these groups of substances, the
acetogenins have been highlighted due to the variety of biological actions, such as cytotoxic, antiparasitic, and pesticidal.12
Graviola has been widely used in popular medicine and is indicated for diverse purposes such as abscesses, anti-parasites, asthma, hypertension, soothing, and tumours, and has been marketed in various dosage forms (powders, liquids, and capsules). There is some exaggeration about graviola’s power in curing some cancers. However, studies have been carried out to decipher what is myth and what is reality in this context.13-15 Recent studies have demonstrated
the action of the acetogenins as anti-cancerous agents that inhibit the nicotinamide adenine dinucleotide (NADH) oxidase of the plasma membranes of cancer cells.5
Inductively coupled plasma optical emission spectrometry (ICP OES) is a multi-element technique that allows the determination of major, minor, and trace elements in complex food matrices.16,17 When an axial view configuration is
and charge-injection device (CID) detector improves the sensitivity for the majority of elements. However, this sensitivity gain is not enough to determine some elements at trace level, demanding more sensitive techniques.
Graphite furnace atomic absorption spectrometry (GF AAS) is a well-recommended technique for trace element determinations, having excellent sensitivity and selectivity in diverse matrices. The simultaneous GF AAS (SIMAAS) used in this work can detect simultaneously up to six elements at trace and ultra-trace levels. The simultaneous capabilities provide advantages for the GF AAS, such as reduced cost of analysis and increased analytical frequency compared to the analytical mono-element techniques.18 Nevertheless, the capability of
multi-element determination in comparison with the ICP OES, is considerably reduced and restricted to only six elements.
The complex organic composition of graviola pulp requires a well-prepared sample treatment to guarantee the conversion of the interest elements in free inorganic forms, avoiding chemical and spectral interferences during analysis by ICP OES and GF AAS methods. Normally, the conversion of a solid sample in a clear solution involves digestion with strong and concentrated acids, alone or combined with oxidant reagents, such as H2O2. HNO3 is
the acid most commonly used for the digestion of organic matrices due to its simple manipulation, easy purification, and high oxidative capacity, especially at high pressures and temperatures. Procedures involving the use of diluted acids in sample preparation by digestion in closed vessels have been successfully applied to obtain lower blank values, improving detection limits, reducing costs and waste, and providing higher analyst security. Additionally, the procedure using diluted acid mixture avoids excessive dilution of the final solution, improving the capacity to detect low concentrations of elements in the sample.17,19
Considering the importance of graviola as a constituent of several foods and the fact that the elemental composition is practically unknown, especially in micronutrients, the present work proposes methods for the determination of Al, B, Ba, Ca, Co, Cu, Cr, Fe, K, Li, Mg, Mn, P, S, Si, Sn, Sr, Ti, V, and Zn by ICP OES and As, Cd, Pb, and Se by simultaneous GF AAS in graviola pulp, following digestion using diluted oxidant mixture in a closed-vessel microwave oven.
Experimental
Instrumentation
An ICP OES, model iCAP 6300 Duo (Thermo Fisher Scientific, Cambridge, England), equipped with axially
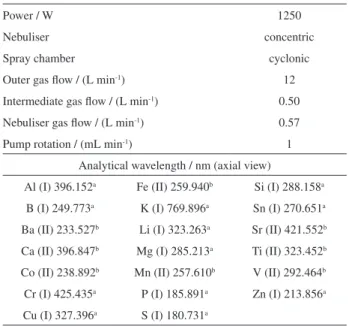
and radially viewed plasma, a CID detector, an echelle polychromator for measurements from 166.25 to 847.0 nm, and a radiofrequency source of 27.12 MHz was used. Argon at 99.998% (v/v) (Air Liquide Brasil S/A, São Paulo, Brazil) was used to purge the optical polychromator and to form the plasma. The sample introduction system was composed of a cyclonic-type spray chamber and a concentric nebuliser. The injector tube diameter of the torch was 2.0 mm. The instrumental parameters selected for analysis are shown in Table 1.
A SIMAAS, model SIMAA-6000® (PerkinElmer Life
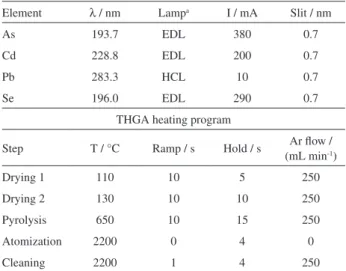
and Analytical Sciences, Shelton, CT, USA), equipped with a longitudinal Zeeman-effect background corrector, echelle optical arrangement, standard transversely-heated graphite atomizer (THGA) tube with integrated pyrolytically coated platform and solid-state detector was used for the simultaneous determination of As, Cd, Pb, and Se. An AS-72 autosampler (PerkinElmer) was used for taking and delivering the analytical solutions from polypropylene cups to the graphite tube. Argon at 99.998% (v/v) (Air Liquide Brasil S/A) was used both as protective and purge gas. The instrumental parameters of SIMAA-6000® are shown
in Table 2.
The digestion of the samples and standard reference material were carried out in a closed-vessel microwave oven (Multiwave 3000, Anton Paar, Austria), using a diluted oxidant mixture. This instrument is equipped with 16 fluoropolymer vessels and a ceramic vessel jacket that support a maximum temperature of 240 °C and pressure
Table 1. Instrumental parameters for multi-elemental determinations by ICP OES
Power / W 1250
Nebuliser concentric
Spray chamber cyclonic
Outer gas flow / (L min-1) 12
Intermediate gas flow / (L min-1) 0.50
Nebuliser gas flow / (L min-1) 0.57
Pump rotation / (mL min-1) 1
Analytical wavelength / nm (axial view)
Al (I) 396.152a Fe (II) 259.940b Si (I) 288.158a
B (I) 249.773a K (I) 769.896a Sn (I) 270.651a
Ba (II) 233.527b Li (I) 323.263a Sr (II) 421.552b
Ca (II) 396.847b Mg (I) 285.213a Ti (II) 323.452b
Co (II) 238.892b Mn (II) 257.610b V (II) 292.464b
Cr (I) 425.435a P (I) 185.891a Zn (I) 213.856a
Cu (I) 327.396a S (I) 180.731a
of 4 MPa. The internal temperature and pressure were monitored continuously in only one controlling vessel, using a sensor-protecting glass tube that enters directly into contact with the digested solution. The external temperature is controlled in all vessels using an infrared (IR) sensor that measures each digestion vessel through ports in the rotor base.
A knife mill Grindomix GM 200 (Retsch, Haan, Germany) was used to homogenise the graviola pulp samples for 5 min.
Reagents and samples
All solutions were prepared with analytical-reagent grade and high-purity deionised water, with final resistivity of 18.2 MΩ cm, provided by a Milli-Q® water purification
system (Millipore, Bedford, MA, USA). Analytical grades of 65% (m/m) HNO3 and 30% (m/m) H2O2 (Merck, Darmstadt,
Germany) were used to prepare the oxidant mixture for sample and standard reference material (SRM) digestion.
Titrisol® standard reference solutions containing
1000 ± 2 mg L-1 of Al, As, B, Ba, Ca, Cd, Co, Cu, Cr, Fe, K,
Li, Mg, Mn, P, Pb, S, Se, Si, Sn, Sr, Ti, V, and Zn (Merck) were diluted to prepare the analytical reference solutions in 0.1% (v/v) HNO3.
The analytical curves were prepared with the following reference solutions: (i) blank 0.1% (v/v) HNO3;
(ii) 0.2-1.6 µg L-1 of Cd, 5-40 µg L-1 of Pb, 10-80 µg L-1 of
As and Se; (iii) 0.5-10 mg L-1 of Sr; (iv) 0.5-20 mg L-1 of
Al, B, Ba, Co, Cu, Fe, Mn, Ti, V, and Zn; (v) 1-50 mg L-1
of Cr, Li, and Sn; (vi) 1-100 mg L-1 of Ca, K, Mg, and Si;
and (vii) 5-300 mg L-1 of P and S. All these solutions were
prepared in 0.1% (v/v) HNO3.
Graviola fruits from Northeastern Brazil (Bahia State) were purchased in a supermarket in São Paulo City. The used samples were of “Crioula” variety, with heart-shaped fruit, weighing between 1.5 and 3 kg. The fruit had a dark green rind and aromatic white pulp. Three different fruits were used and 3 sub-samples for analysis obtained from each one.
Citrus leaves SRM (SRM 1572) from the National Institute of Standards and Technology (NIST, Gaithersburg, MD, USA) was used to check the accuracy of the analytical methods.
Sample preparation
Graviola fruits were rinsed with tap and distilled water, and the pulp separated from the seeds with a ceramic knife. The rind and seeds were discarded. The pulp was homogenised in a knife mill for five minutes, dried in an oven at 50 °C until constant mass, and ground with an agate mortar and pestle. A mass of each sample of around 200 mg was digested using a diluted oxidant mixture (2 mL HNO3 + 1 mL H2O2 + 3 mL H2O). The heating program
was performed in three steps (temperature in °C; ramp in min; hold in min): 1 (140; 5; 1); 2 (180; 4; 5); and 3 (220; 4; 10). There was a fourth step for cooling down the system through forced ventilation for 20 min. After the digestion, the samples and blank solutions were transferred to plastic flasks and diluted to 10 mL with deionised water. The digestion procedure was done in triplicate for each of the sub-samples.
SRM 1572 was prepared using the same procedure described for the graviola pulp.
ICP OES and SIMAAS operation conditions
The performance of ICP OES was evaluated using an aqueous solution of 2.0 mg L-1 of Mg in 0.1% (v/v) HNO
3
to obtain robust operating conditions based on the evaluation of the ratio Mg (II) (280.270 nm) / Mg (I) (285.213 nm), as previously proposed in the literature.20 To obtain robust
conditions, the applied radio frequency power was varied from 950 to 1350 W, the nebuliser gas-flow was varied from 0.28 to 0.85 L min-1, and the auxiliary gas-flow was varied
from 0.5 to 1.5 L min-1. The choice of the best wavelengths
for element determinations was carried out by scans in a wide range, using standard reference solutions and graviola solution after microwave digestion. The wavelength scans of graviola solution were compared with those obtained using analytical reference solutions, containing 10 and 50 mg L-1 of Table 2. Instrumental operating conditions and THGA heating program
for simultaneous determination of As, Cd, Pb, and Se by SIMAAS
Element λ / nm Lampa I / mA Slit / nm
As 193.7 EDL 380 0.7
Cd 228.8 EDL 200 0.7
Pb 283.3 HCL 10 0.7
Se 196.0 EDL 290 0.7
THGA heating program
Step T / °C Ramp / s Hold / s Ar flow / (mL min-1)
Drying 1 110 10 5 250
Drying 2 130 10 10 250
Pyrolysis 650 10 15 250
Atomization 2200 0 4 0
Cleaning 2200 1 4 250
analytes. The higher signal/noise ratio and non-overlapping spectral lines of other elements or concomitant were the criteria used for the selection of appropriate wavelengths (Table 1). Background emission was corrected using instrument software. The average between the left and right backgrounds was measured around the element peak and used to obtain the solutions’ corrected emission intensity.
For ICP OES, the limits of quantification (LOQ) were taken as 10 times the limits of detection (LOD). The estimation of the LOD for each element was calculated using the background equivalent concentration (BEC) and signal-to-background ratio (SBR): BEC = Crs / SBR; SBR = Irs – Iblank / Iblank; LOD = 3 × BEC × RSD / 100; where Crs is the concentration of element in the reference solution, Irs and Iblank are the emission intensities of the element in the reference and blank solutions, respectively, after background correction, and RSD is the relative standard deviation for ten consecutive measurements of blank solution.17,21 The LOD were converted into concentration
(µg g-1), based on the mass of 200 mg of graviola and final
volume of 10 mL.
The best operating conditions for SIMAAS were established in order to determine simultaneously As, Cd, Pb, and Se. The pyrolysis and atomization curves were obtained in the presence of 250 µg of W + 250 µg of Rh as the permanent chemical modifier.22 The heating program
for SIMAAS is shown in Table 2. Volumes of 10 µL of the reference solutions and samples were delivered onto the integrated platform of the pyrolytic graphite tube.
In this case, the LOD were calculated considering the variability of 10 consecutive measurements of blank solution, according to 3sblank / b (sblank = standard deviation
of the blank and b = calibration curve slope). The LOQ were adopted as 3 × LOD.
Results and Discussion
Analytical performance of ICP
The operating conditions of ICP OES may influence the robustness of the method, which is related to the ability of the equipment to accept variations in the sample matrix without significantly altering the analytical signals and, consequently, the results. The ratio Mg (II) / Mg (I) of the intensities of the ionic emission line (Mg II: 280.270 nm) and atomic emission line (Mg I: 285.213 nm) was proposed to evaluate and find the robustness of ICP OES. A ratio value above 10 indicates that the ICP OES should be particularly robust to matrix effects. On the other hand, a ratio below 4 corresponds to a high susceptibility to the occurrence of matrix effects during analysis.20
For axially viewed plasma, the Mg (II) / Mg (I) ratio should be multiplied by a factor ε, calculated from the ratio of the values of background signals in the two wavelengths (Sbackground at 280.270 nm / Sbackground at 285.213 nm) in order
to correct optical deviations.23 In this work, the value
of factor ε was set at 1.8. Thus, robust conditions were achieved with a power of 1250 W, 0.57 L min-1 of nebuliser
gas flow, and 0.5 L min-1 of auxiliary gas flow, with the ratio
Mg (II) / Mg (I) equal to 10.7. The best wavelength and the optimum instrumental parameters are shown in Table 1.
Analytical parameters of the methods
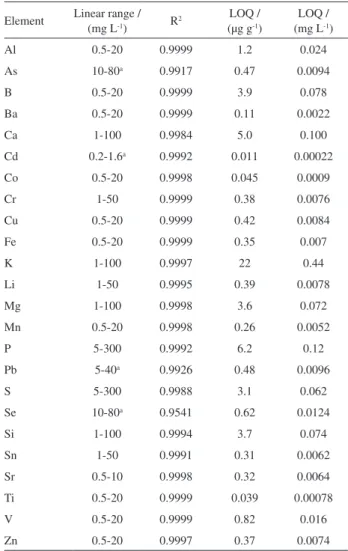
Parameters of the analytical calibration curves, such as linear range, correlation coefficient (R2), and LOQ, are
presented in Table 3. Considering sample mass of 200 mg and final volume of 10 mL, LOQ (10 × LOD) for ICP OES were in the range of 0.039 µg g-1 (Ti) to 3.9 µg g-1 (B) for
Table 3. Parameters of the analytical calibration curves by ICP OES and SIMAAS
Element Linear range / (mg L-1) R2
LOQ / (µg g-1)
LOQ / (mg L-1)
Al 0.5-20 0.9999 1.2 0.024
As 10-80a 0.9917 0.47 0.0094
B 0.5-20 0.9999 3.9 0.078
Ba 0.5-20 0.9999 0.11 0.0022
Ca 1-100 0.9984 5.0 0.100
Cd 0.2-1.6a 0.9992 0.011 0.00022
Co 0.5-20 0.9998 0.045 0.0009
Cr 1-50 0.9999 0.38 0.0076
Cu 0.5-20 0.9999 0.42 0.0084
Fe 0.5-20 0.9999 0.35 0.007
K 1-100 0.9997 22 0.44
Li 1-50 0.9995 0.39 0.0078
Mg 1-100 0.9998 3.6 0.072
Mn 0.5-20 0.9998 0.26 0.0052
P 5-300 0.9992 6.2 0.12
Pb 5-40a 0.9926 0.48 0.0096
S 5-300 0.9988 3.1 0.062
Se 10-80a 0.9541 0.62 0.0124
Si 1-100 0.9994 3.7 0.074
Sn 1-50 0.9991 0.31 0.0062
Sr 0.5-10 0.9998 0.32 0.0064
Ti 0.5-20 0.9999 0.039 0.00078
V 0.5-20 0.9999 0.82 0.016
Zn 0.5-20 0.9997 0.37 0.0074
microconstituents and in the range of 3.6 µg g-1 (Mg) to
22 µg g-1 (K) for macro constituents. For SIMAAS, the
LOQ (3 × LOD) were in the range of 0.011 µg g-1 (Cd) to
0.62 µg g-1 (Se). These values are in close accordance with
others previously obtained in our group.17,22
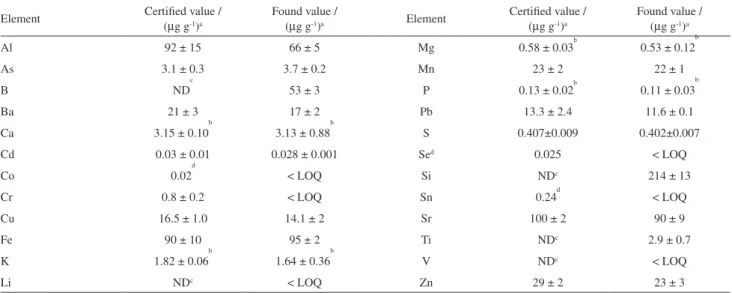
The comparison between the experimental and certified values for all analytes in the certified reference material (SRM 1572) is presented in Table 4. To check the concordance of the results, Student’s t-test was applied for all elements, except for B, Co, Cr, Li, Si, Sn, and V, whose values were below the LOD or were not determined. Where it was possible to determine elements in the certified reference material, the determined values are in agreement with the recommended values at a confidence level of 95% (Student’s t-test), except for Al, Zn, and Cr, where the agreement was at a confidence level of 98%.
Elemental composition in graviola pulp
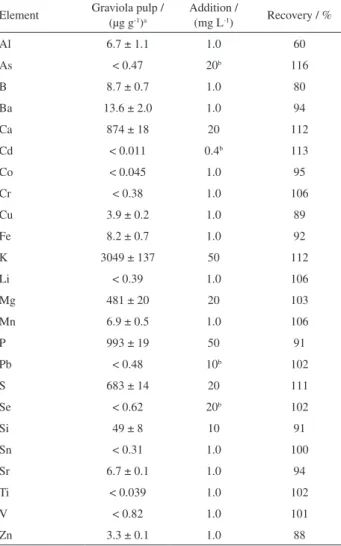
Table 5 shows the concentrations of 24 elements determined in the graviola pulp by ICP OES and SIMAAS. It is important to emphasise that these concentrations are related to the analysis of three different samples and each sub-sample was analysed in triplicate. The humidity content determined after drying in an oven at 50 °C was around 80%.
Among the elements determined in the graviola pulp, K showed the highest concentration (3049 µg g-1),
followed by P (993 µg g-1), Ca (874 µg g-1), S (683 µg g-1),
and Mg (481 µg g-1). The presence of P and S at high
concentrations can be related to the presence of protein, whose concentrations are around 0.8% (m/m).24 A relatively
high concentration of Al (6.7 µg g-1), B (8.7 µg g-1),
Ba (13.6 µg g-1), Si (49 µg g-1), and Sr (6.7 µg g-1), were
found. These are considered non-essential elements for human beings. High concentrations of Ba and Sr were also found in Brazil nut. The presence of these elements (Ba and Sr) in Brazil nut and graviola may be related to the amount found in the soil of Northern and Northwestern Brazil and the physiological characteristics of the plants.25,26
The values found for all elements analysed by SIMAAS are below the LOQ (0.47 µg g-1 for As, 0.011 µg g-1 for Cd,
0.48 µg g-1 for Pb, and 0.62 µg g-1 for Se). These results
indicate that these graviola samples are not contaminated with As, Cd, and Pb, and are not a good source of Se.
The recoveries were obtained for additions of the elements before digestion in the microwave oven (Table 5). These good recoveries demonstrate the good performance of the sample preparation procedure and confirm that the determinations by ICP OES or SIMAAS were performed in the absence of matrix-effects and spectral interferences. The recoveries for ICP OES ranged from 80 to 112% and for SIMAAS from 102 to 116%, except for Al, that presented an acceptable value of 60%. Even for the SRM 1572 analysis, the recovery for Al was not so good (71%). These results are in agreement with literature that report recoveries up to 45% for Al in spinach leaves, using axial view ICP OES.27
Table 6 shows the content of macro and micronutrients in 100 g of edible graviola pulp in comparison with literature data for this fruit. The K concentrations found in this work are comparable with the values obtained using the Brazilian Table of Food Composition (TACO, Tabela Brasileira de Composição de Alimentos).24 On the
Table 4. Results of the certified reference material (SRM 1572, citrus leaves) analysis by ICP OES and SIMAAS
Element Certified value / (µg g-1)a
Found value /
(µg g-1)a Element
Certified value / (µg g-1)a
Found value / (µg g-1)a
Al 92 ± 15 66 ± 5 Mg 0.58 ± 0.03b 0.53 ± 0.12
b
As 3.1 ± 0.3 3.7 ± 0.2 Mn 23 ± 2 22 ± 1
B ND
c
53 ± 3 P 0.13 ± 0.02b 0.11 ± 0.03
b
Ba 21 ± 3 17 ± 2 Pb 13.3 ± 2.4 11.6 ± 0.1
Ca 3.15 ± 0.10
b
3.13 ± 0.88 b
S 0.407±0.009 0.402±0.007
Cd 0.03 ± 0.01 0.028 ± 0.001 Sed 0.025 < LOQ
Co 0.02
d
< LOQ Si NDc 214 ± 13
Cr 0.8 ± 0.2 < LOQ Sn 0.24d < LOQ
Cu 16.5 ± 1.0 14.1 ± 2 Sr 100 ± 2 90 ± 9
Fe 90 ± 10 95 ± 2 Ti NDc 2.9 ± 0.7
K 1.82 ± 0.06
b
1.64 ± 0.36 b
V NDc < LOQ
Li NDc < LOQ Zn 29 ± 2 23 ± 3
other hand, half the concentration was found in the fruits cultivated in Colombia.28 The P concentration is about
three times higher than those previously reported,28 and
when compared with data from TACO, this difference is greater. The concentrations of Ca and Mg are approximately double of those found in this work, Mn and Cu are about 10 times higher, and Fe and Zn are closer to those previously reported.24,28 Several factors may contribute to
the differences found in this study in comparison with data previously reported, such as soil composition, climatic conditions, and differences in genetic and agricultural practices.28
Dietary reference intake (DRI)
The reference values of nutrient intakes considered adequate in planning and assessing diets for healthy people during a day, is termed the dietary reference intake (DRI). The regulations of the Food and Drug Administration (FDA) established nutrition labelling criteria for most food. However, there is no report for graviola pulp. The DRIs considering tolerable upper intake levels per day for some essential elements of human nutrition have been established in the range: B (3 to 20 mg), Ca (1,000 to 3,000 mg), Cu (1 to 10 mg), Fe (40 to 45 mg), K (400 to 5,100 mg), Mg (65 to 350 mg), Mn (2 to 11 mg), P (3,000 to 4,000 mg), and Zn (4 to 40 mg).29 These values were established depending on
the life stage of groups of people: infants, children, males, females, pregnancy and breastfeeding.
Taking into account the concentrations of the elements shown in Table 5 and the amount of consumed graviola pulp as 100 g, the DRIs were calculated for all elements considered to be nutrients. In this context, the amount of these elements ingested per day could be 870 µg for B, 87.4 mg for Ca, 390 µg for Cu, 820 µg for Fe, 304.5 mg for K, 48.1 mg for Mg, 690 µg for Mn, 99.3 mg for P, 68.3 mg for S, 4.9 mg for Si, and 330 µg for Zn. For all these elements, if 100 g of graviola are consumed, the amount of the macro and microconstituents are below the DRIs.
The results provide information that can be useful to evaluate the contribution of graviola with macro and microconstituents to the recommended daily intake (RDI) values for adults.30 According to the results, graviola pulp
can be considered a source of Cu and Mn, supplying 43 and 30% of DRI per 100 g of pulp, respectively, as well as a good source of Mg and P, with contributions from 19 to 14%, respectively.
The presence of B as a microconstituent should be considered carefully because this element has essential roles in human physiology,31 however, the dietary reference Table 5. Determination of essential, non-essential, and potentially toxic
elements in graviola pulp (n = 3)
Element Graviola pulp / (µg g-1)a
Addition /
(mg L-1) Recovery / %
Al 6.7 ± 1.1 1.0 60
As < 0.47 20b 116
B 8.7 ± 0.7 1.0 80
Ba 13.6 ± 2.0 1.0 94
Ca 874 ± 18 20 112
Cd < 0.011 0.4b 113
Co < 0.045 1.0 95
Cr < 0.38 1.0 106
Cu 3.9 ± 0.2 1.0 89
Fe 8.2 ± 0.7 1.0 92
K 3049 ± 137 50 112
Li < 0.39 1.0 106
Mg 481 ± 20 20 103
Mn 6.9 ± 0.5 1.0 106
P 993 ± 19 50 91
Pb < 0.48 10b 102
S 683 ± 14 20 111
Se < 0.62 20b 102
Si 49 ± 8 10 91
Sn < 0.31 1.0 100
Sr 6.7 ± 0.1 1.0 94
Ti < 0.039 1.0 102
V < 0.82 1.0 101
Zn 3.3 ± 0.1 1.0 88
aMean ± standard deviation (n = 3); bµg L-1; <: below the limit of quantification.
Table 6. Content of macro and micronutrients in graviola compared with literature data
Study Composition / (mg per 100 g edible portion)
K P Ca Mg Mn Fe Cu Zn
1 305 99 87 48 0.69 0.82 0.39 0.33
2 250 19 40 23 0.08 0.20 0.04 0.10
3 523 30 38 25 0.07 0.38 0.10 0.11
intake varies considerably for children aged 1 to 8 years (3 to 6 mg per day) and for adults (up to 20 mg per day). For Si there is no DRI due to lack of data of adverse effects in age groups from infants to adults.
Conclusions
By using ICP OES and SIMAAS, it was possible to access information about the concentration of 24 elements in graviola pulp with good precision and accuracy. Diluted oxidant mixture was very efficient to digest the organic matrix, avoiding excessive final dilution of the sample and, consequently, loss of sensitivity. The multi-elemental determination revealed the presence of some elements that are non-essential (Al, Ba, and Sr) for human beings.
Based on the values of DRI for infants, children, males, females, pregnancy and breastfeeding, graviola pulp can be considered a good source of B, Cu, K, Mg, and Mn. On the other hand, graviola pulp is not a source of Se, and potentially toxic elements, such as As, Cd, and Pb.
Acknowledgments
The authors are grateful to the Conselho Nacional de Desenvolvimento Científico e Tecnológico (CNPq) and Fundação de Amparo à Pesquisa do Estado de São Paulo (FAPESP) for financial support. P. V. O. and G. A. R. K. are thankful to CNPq for the research and fellowship support.
References
1. Vallilo, M.; Tavares, M.; Aued-Pimentel, S.; Campos, N.; Moita, N. J.; Food Chem.1999, 66, 197.
2. Kris‐Etherton, P. M.; Zhao, G.; Binkoski, A. E.; Coval, S. M.; Etherton, T. D.; Nutr. Rev.2001, 59, 103.
3. Kannamkumarath, S. S.; Wuilloud, R. G; Caruso J. A.; J. Agric. Food Chem.2004, 52, 5773.
4. Rodushkin, I.; Engström, E.; Sörlin, D.; Baxter, D.; Sci. Total Environ.2008, 392, 290.
5. Paul, J.; Gnanam, R.; Jayadeepa, R. M; Arul, L.; Curr. Top. Med. Chem.2013, 13, 1666.
6. Almeida, M. M. B.; de Sousa, P. H. M.; Arriaga, A. M. C.; do Prado, G. M.; Magalhães, C. E. D. C.; Maia, G. A.; de Lemos, T. L. G.; Food Res. Int.2011, 44, 2155.
7. Cardoso, L. D. M.; Martino, H. S. D.; Moreira, A. V. B.; Ribeiro, S. M. R.; Pinheiro- Sant’Ana, H. M.; Food Res. Int.2011, 44, 2151.
8. Sacramento, C. D.; Faria, J. C.; Cruz, F. L. D.; Barreto, W.; Gaspar, J. W.; Leite, J. B. V.; Rev. Bras. Frutic.2003, 25, 329.
9. Augusto, F.; Valente, A. L. P.; Tada, E. D. S.; Rivellino, S. R.;
J. Chromatogr. A.2000, 873, 117.
10. Mohanty, S.; Hollinshead, J.; Jones, L.; Jones, P. W.; Thomas, D.; Watson, A. A.; Watson, D. G.; Gray, A. I.; Molyneux, R. J.; Nash, R. J.; Nat. Prod. Commun.2008, 3, 31. 11. Sun, S.; Liu, J.; Kadouh, H.; Sun, X.; Zhou, K.; Bioorg. Med.
Chem. Lett.2014, 24, 2773.
12. Alali, F. Q.; Liu, X.-X.; McLaughlin, J. L.; J. Nat. Prod.1999,
62, 504.
13. Cassileth, B.; Oncology2008, 22, 1643.
14. Dai, Y.; Hogan, S.; Schmelz, E. M.; Ju, Y. H.; Canning, C.; Zhou, K.; Nutr. Cancer2011, 63, 795.
15. Barbalho, S. M.; Souza, M. D. S. S.; Bueno, P. C. D. S.; Guiguer, E. L.; Farinazzi-Machado, F. M. V.; Araújo, A. C.; Meneguim, C. O.; Silveira, E. P.; Oliveira, N. S.; da Silva, B. C.; J. Med. Food2012, 15, 917.
16. Dolan, S. P.; Capar, S. G.; J. Food Compos. Anal.2002, 15, 593. 17. Naozuka, J.; Vieira, E. C.; Nascimento, A. N.; Oliveira, P. V.;
Food Chem.2011, 124, 1667.
18. Correia, P.; Nomura, C.; Oliveira, P. V.; Analytica2003, 5, 52. 19. Araújo, G. C.; Gonzalez, M. H.; Ferreira, A. G.; Nogueira,
A. R. A.; Nóbrega, J. A.; Spectrochim. Acta, Part B 2002, 57, 2121. 20. Mermet, J.-M.; Poussel, E.; Appl. Spectrosc.1995, 49, 12A. 21. Poussel, E.; Mermet, J.-M.; Spectrochim. Acta, Part B1996,
51, 75.
22. Nomura, C. S.; Correia, P. R.; Oliveira, P. V.; Oliveira, E.;
J. Braz. Chem. Soc.2004, 15, 75.
23. Stepan, M.; Musil, P.; Poussel, E.; Mermet, J.; Spectrochim. Acta, Part B2001, 56, 443.
24. http://www.unicamp.br/nepa/taco/ accessed in July 2015. 25. Parekh, P.; Khan, A.; Torres, M.; Kitto, M.; J. Food Compos.
Anal. 2008, 21, 332.
26. Goncalves, A. M.; Fernandes, K. G.; Ramos, L. A.; Cavalheiro, E. T. G.; Nobrega, J. A.; J. Braz. Chem. Soc.2009, 20, 760. 27. Trevisan, L. C.; Silva, F. V.; Nogueira, A. R. A.; Nóbrega, J. A.;
Microchem. J.2007, 86, 60.
28. Leterme, P.; Buldgen, A.; Estrada, F.; Londoño, A. M; Food Chem. 2006, 95, 644.
29. http://www.nap.edu/topic/287/food-and-nutrition accessed in July 2015.
30. http://portal.anvisa.gov.br/wps/wcm/connect/18849700474578 11857dd53fbc4c6735/RDC_269_2005.pdf?MOD=AJPERES accessed in July 2015.
31. Hunt, C. D.; J. Trace Elem. Med. Biol.2012, 26, 157.
Submitted: March 23, 2015
Published online: July 17, 2015