Article
Printed in Brazil - ©2012 Sociedade Brasileira de Química0103 - 5053 $6.00+0.00
A
*e-mail: [email protected]
Three New Labdanes Isolated from
Eragrostis viscosa
N’Soki N. Sebastião,a Nelson Fernandes,b Liliana Vieira,b António J. G. Mendonça,c
Jorge F. Gaspar,d Celia Martins,d José Rueff,d Carlos Diakanamwae and
Dina I. M. D. de Mendonça*,b
aChemistry Department, Agostinho Neto University, Av. 4 de Fevereiro nº 7, Luanda, Angola
bTextile and Paper Materials Center and Chemistry Department, University of Beira Interior,
6200-001 Covilhã, Portugal
cCICS-UBI - Health Sciences Research Centre, University of Beira Interior,
Av. Infante D. Henrique, 6200-506 Covilhã, Portugal
dGenetics Department, Faculty of Medical Sciences, New University of Lisbon,
1349-008 Lisboa, Portugal
eBiology Department, Agostinho Neto University, Av. 4 de Fevereiro nº 7, Luanda, Angola
Três novos labdanos com anel 8α,15-epoxi [8α,15-epoxilabdan-16β-oato de metila, 8α,15-epoxilabdan-16β-ol e 8α,15-epoxi-16-norlabdan-13β-ol] e cinco compostos conhecidos [8α,15-epoxi-16-norlabdan-13-ona, ácido 8α,15-epoxilabdan-16β-oico, β-(3’’,4’’-di-hidroxi)-(E)-cinamoiloxilup-20(29)-eno, 3-(2’,3’,4’,6’-tetra-O-acetil-β-D-glucopiranosiloxi)-β-sitosterol e 16-acetoxi-8α,15-epoxilabdano] foram isolados dos extratos de tolueno e diclorometano de partes aéreas da Eragrostis viscosa. A estrutura dos compostos foi atribuída a partir dos seus dados espectroscópicos e da análise de difração de raios X do 8α,15-epoxilabdan-16β-ol. Os compostos 16-acetóxi-8α,15-epoxilabdano, 8α,15-epoxi-16-norlabdan-13-ona e 8α,15-epoxilabdan-16β-ol não apresentam genotoxicidade e mutagenicidade, as quais foram avaliadas usando o teste dos micronúcleos e o teste de Ames, respetivamente. A citotoxicidade dos mesmos compostos foi avaliada usando o teste do MTT sendo o 8α,15-epoxilabdan-16β-ol o mais citotóxico de todos os compostos analisados. Foram também avaliadas a capacidade antioxidante, o valor peróxido e o conteúdo em fenóis totais de extratos de E. viscosa.
Three new labdanes with 8α,15-epoxy ring [methyl 8α,15-epoxylabdan-16β-oate, 8α,15-epoxylabdan-16β-ol and 8α,15-epoxy-16-norlabdan-13β-ol] and five known compounds [8α,15-epoxy-16-norlabdan-13-one, 8α,15-epoxylabdan-16β-oic acid, 3β-(3’’,4’’-dihydroxy)-(E)-cinnamoyloxylup-20(29)-ene, 3-(2’,3’,4’,6’-tetra-O -acetyl-β-D-glucopyranosyloxy)-β-sitosterol and 16-acetoxy-8α,15-epoxylabdane] were isolated from toluene and dichloromethane extracts of aerial parts of Eragrostis viscosa. The structures of all the compounds were established based on their spectroscopic data and X-ray diffraction analysis of 8α,15-epoxylabdan-16β-ol. It was also studied the genotoxicity of E. viscosa, particularly compounds 16-acetoxy-8α,15-epoxylabdane, 8α,15-epoxy-16-norlabdan-13-one and 8α,15-epoxilabdan-16β-ol, using a cytokinesis-block micronucleus assay and the Ames test to assess mutagenicity. Both assays were negative. Cytotoxicity was also analyzed using an MTT assay, and 8α,15-epoxy-16β-ol was shown to be the most cytotoxic of the compounds tested. E. viscosa extracts were also tested to determine their antioxidant capacities, peroxide values and total phenolic contents.
Keywords: Eragrostis viscosa, 8α,15-epoxylabdanes, mutagenic activity, cytotoxic activity,
Introduction
Eragrostis species (Poaceae, Eragrostoideae tribe) are well known for their nutritive value.1,2 Nevertheless, cattle refuse to eat Eragrostis viscosa (Retz.) Trin., which is used in folk medicine as a poison against snakes.
Some of the most important fodders from this genus include E. nigra, E. tef and E. curvula. However, studies conducted on these plants have primarily addressed their nutritive values, not their chemical compositions.1,3,4 In our research on Angolan plants,5-7 our group previously reported the isolation of labdanes containing a novel 8,15-epoxide.6 Now, it is reported the isolation of new 8α,15-epoxylabdanes 6 and 7 along with known compounds
16-acetoxy-8α,15-epoxylabdane (2),6 8α ,15-epoxy-16-norlabdan-13-one (3)6 and 8α ,15-epoxylabdan-16β-oic acid (4) (Figure 1).6 These compounds were
isolated by a maceration of the aerial parts of E. viscosa at room temperature in dichloromethane, and were characterized by the techniques Fourier transform IR spectroscopy, 1H and 13C nuclear magnetic resonance (NMR), 2D NMR, electron ionization mass spectrometry (HREIMS) and X-ray diffractometry (XRD) of 6. A new
8α,15-epoxylabdane 1 was isolated from the toluene
extract along with the known compounds 8α ,15-epoxy-16-norlaban-13-one (3),6 8α,15-epoxylabdan-16β-oic acid (4),6 3β -(3’’,4’’-dihydroxy)-(E)-cinnamoyloxylup-20(29)-ene (5)8 and
3-(2’,3’,4’,6’-tetra-O-acetyl-β-D-glucopyranosyloxy)-β-sitosterol (8) (Figure 1).8 The
known compounds were identified on the basis of their spectral data and comparison with appropriate reported data.
Our group tested the genotoxicity of E. viscosa, particularly compounds 2, 3 and 6, using an MTT
(3-(4,5-dimethylthiazol-2-yl)-2,5-diphenyl tetrazolium bromide) assay as a biomarker of cytotoxicity, the cytokinesis-block micronucleus (MN) assay in hamster V79 cells as a biomarker of cytogenetic damage, and the Ames test to detect potential mutagenic damage was tested. The antioxidant capacities, peroxide values and total phenolic contents of some extracts of E. viscosa are also presented.
Experimental
General experimental procedures
Optical rotations were obtained using a Bellingham + Stanley Ltd ADP 220 polarimeter. HREIMS measurements were conducted on a VG Autospec M and recorded at 70 eV. IR spectra were measured in a Unicam Mattson 5000 FTIR. X-ray diffraction analyses were performed in a Bruker SMART CCD 1000 with Mo Kα radiation (λ = 0.71073 Å). NMR spectra were recorded in a Bruker Avance II at 600 MHz (1H NMR) or 150.9 MHz (13C NMR) in CDCl3. Chemical shifts (d) are given in ppm and are referenced to the residual CHCl3, using 7.26 ppm for the 1H peak and 77.0 ppm for the 13C peak. Two-dimensional
experiments were performed with standard Bruker software. Column chromatography was performed on silica gel 60 (70-230 mesh, Merck, Darmstadt, Germany) using a hexane-EtOAc gradient.
Plant material
The aerial parts of E. viscosa were collected in the outskirts of Lubango (Huíla), Angola, in July 2003 and were identified by the staff of the Lubango Herbarium. A voucher specimen (No. 3666) was deposited at the Lubango Herbarium, Angola.
Extraction and isolation
The dried aerial parts (400 g) that were collected in 2003 were successively extracted with hexane (hexane 2 extract), toluene (producing 8.4 g of toluene extract) and ethyl acetate in a Soxhlet apparatus for 24 h. The hexane 1 extract was obtained from plants collected in 2001.6 A total of 200 g of the dried aerial parts collected in 2003 was macerated in dichloromethane for one week to yield 30 g of crude extract. The dichloromethane crude extract afforded 18 g of material after being dewaxed with methanol. The toluene extract was separated into 5 fractions (hexane/EtOAc 95:5, 8:2, 6:4, 1:1 and ethyl acetate). The fraction eluted with 95:5 hexane/EtOAc was separated on a silica gel column with a hexane/EtOAc gradient to yield methyl 8α,15-epoxylabdan-16β-oate (1) (8 mg) and
8α,15-epoxy-16-norladban-13-one (3) (20 mg). The
fraction eluted with 8:2 hexane/EtOAc was separated on a silica gel column with a hexane/EtOAc gradient to yield 8α,15-epoxylabdan-16β-oic acid (4) (70 mg). The
fraction eluted with 1:1 hexane/EtOAc was separated on a silica gel column with a hexane/EtOAc gradient to yield 3β
20(29)-ene (5) (12 mg). The fraction eluted with
EtOAc was separated on a silica gel column with a hexane/EtOAc gradient to yield 3-(2’,3’,4’,6’-tetra-O-acetyl-β-D-glucopyranosyloxy)-β-sitosterol (8)
(35 mg). A sample of the dichloromethane extract (8.5 g), obtained from maceration was separated into 7 fractions (hexane/EtOAc 95:5, 9:1, 8:2, 7:3, 6:4, 1:1 and ethyl acetate). The fraction eluted with 8:2 hexane/EtOAc was separated on a silica gel column with a hexane/EtOAc gradient to yield 16-acetoxy-8α,15-epoxylabdane (2) (470 mg) and
8α,15-epoxy-16-norlabdan-13-one (3) (17 mg). The
fraction eluted with 6:4 hexane/EtOAc was separated on a silica gel column with a hexane/EtOAc gradient to yield 8α,15-epoxylabdan-16β-oic acid (4) (720 mg). The
fraction eluted with 1:1 hexane/EtOAc was separated on a silica gel column with a hexane/EtOAc gradient to yield 8α,15-epoxylabdan-16β-ol (6) (23 mg) and 8α ,15-epoxy-16-norlabdan-13β-ol (7) (55 mg).
Methyl 8α,15-epoxylabdan-16β-oate (1)
Colorless oil; [α] D25 +55.2º (c 0.12, CHCl3); IR νmax/cm-1 2926, 2868, 1738, 1452, 1385, 1271, 1165, 1084, 756; 1H NMR (CDCl
3, 600 MHz) and 13C NMR (CDCl3, 150.9 MHz): see Table 1; HR-TOF-EIMS (pos.) m/z 336.2664 [M]+ (calcd. for C
21H36O3, 336.2664).
8α,15-Epoxylabdan-16β-ol (6)
Colorless oil; [α]D25 +21.2º (c 0.5, CHCl3); IR νmax/cm-1 3422, 2940, 1461, 1388, 1076, 1024, 757; 1H NMR (CDCl
3, 600 MHz) and 13C NMR (CDCl
3, 150.9 MHz): see Table 1; HR-TOF-EIMS (pos.) m/z 308.2714 [M]+ (calcd. for C20H36O2, 308.2715).
8α,15-Epoxy-16-norlabdan-13β-ol (7)
Colorless oil; [α] D25 +25.2º (c 0.16, CHCl3); IR νmax/cm-1: 3426, 2936, 1462, 1389, 1072, 756 cm-1; 1H NMR (CDCl
3, 600 MHz) and 13C NMR (CDCl
3, 150.9 MHz): see Table 1;
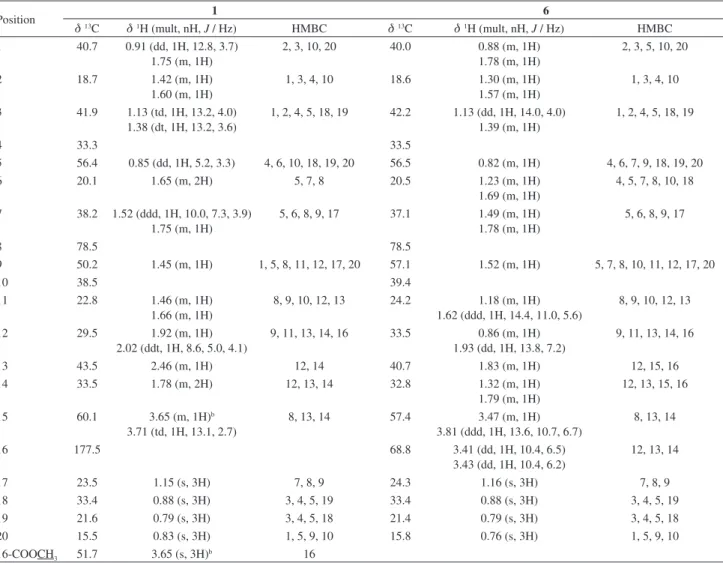
Table 1.1H and 13C NMR data and HMBC correlations of compounds 1 and 6a
Position 1 6
d13C d1H (mult, nH, J / Hz) HMBC d13C d1H (mult, nH, J / Hz) HMBC
1 40.7 0.91 (dd, 1H, 12.8, 3.7) 1.75 (m, 1H)
2, 3, 10, 20 40.0 0.88 (m, 1H)
1.78 (m, 1H)
2, 3, 5, 10, 20
2 18.7 1.42 (m, 1H)
1.60 (m, 1H)
1, 3, 4, 10 18.6 1.30 (m, 1H)
1.57 (m, 1H)
1, 3, 4, 10
3 41.9 1.13 (td, 1H, 13.2, 4.0) 1.38 (dt, 1H, 13.2, 3.6)
1, 2, 4, 5, 18, 19 42.2 1.13 (dd, 1H,14.0, 4.0) 1.39 (m, 1H)
1, 2, 4, 5, 18, 19
4 33.3 33.5
5 56.4 0.85 (dd, 1H, 5.2, 3.3) 4, 6, 10, 18, 19, 20 56.5 0.82 (m, 1H) 4, 6, 7, 9, 18, 19, 20
6 20.1 1.65 (m, 2H) 5, 7, 8 20.5 1.23 (m, 1H)
1.69 (m, 1H)
4, 5, 7, 8, 10, 18
7 38.2 1.52 (ddd, 1H, 10.0, 7.3, 3.9) 1.75 (m, 1H)
5, 6, 8, 9, 17 37.1 1.49 (m, 1H) 1.78 (m, 1H)
5, 6, 8, 9, 17
8 78.5 78.5
9 50.2 1.45 (m, 1H) 1, 5, 8, 11, 12, 17, 20 57.1 1.52 (m, 1H) 5, 7, 8, 10, 11, 12, 17, 20
10 38.5 39.4
11 22.8 1.46 (m, 1H)
1.66 (m, 1H)
8, 9, 10, 12, 13 24.2 1.18 (m, 1H) 1.62 (ddd, 1H, 14.4, 11.0, 5.6)
8, 9, 10, 12, 13
12 29.5 1.92 (m, 1H)
2.02 (ddt, 1H, 8.6, 5.0, 4.1)
9, 11, 13, 14, 16 33.5 0.86 (m, 1H) 1.93 (dd, 1H, 13.8, 7.2)
9, 11, 13, 14, 16
13 43.5 2.46 (m, 1H) 12, 14 40.7 1.83 (m, 1H) 12, 15, 16
14 33.5 1.78 (m, 2H) 12, 13, 14 32.8 1.32 (m, 1H)
1.79 (m, 1H)
12, 13, 15, 16
15 60.1 3.65 (m, 1H)b
3.71 (td, 1H, 13.1, 2.7)
8, 13, 14 57.4 3.47 (m, 1H)
3.81 (ddd, 1H, 13.6, 10.7, 6.7)
8, 13, 14
16 177.5 68.8 3.41 (dd, 1H, 10.4, 6.5)
3.43 (dd, 1H, 10.4, 6.2)
12, 13, 14
17 23.5 1.15 (s, 3H) 7, 8, 9 24.3 1.16 (s, 3H) 7, 8, 9
18 33.4 0.88 (s, 3H) 3, 4, 5, 19 33.4 0.88 (s, 3H) 3, 4, 5, 19
19 21.6 0.79 (s, 3H) 3, 4, 5, 18 21.4 0.79 (s, 3H) 3, 4, 5, 18
20 15.5 0.83 (s, 3H) 1, 5, 9, 10 15.8 0.76 (s, 3H) 1, 5, 9, 10
16-COOCH3 51.7 3.65 (s, 3H)b 16
aSpectra were recorded at 600 and 150.9 MHz for 1H and 13C NMR, respectively; 2D NMR experiments recorded in accordance; coupling constants are
HR-TOF-EIMS (pos.) m/z 294.2561 [M]+ (calcd. for C19H34O2, 294.2559).
Hydrolysis of 2
First, 15 mL of a 4% solution of KOH/MeOH were added to 150 mg of 2. The mixture was left for 2 h at room
temperature, diluted with water (15 mL) and left for an additional 2 h at room temperature. MeOH was evaporated under vacuum and the aqueous solution was extracted with Et2O. The organic layer was washed with H2O until a pH 7 was obtained, dried over Na2SO4, filtered and evaporated under vacuum to yield 6 (111 mg), whose NMR spectra and
optical rotation data were identical to those of the natural alcohol.
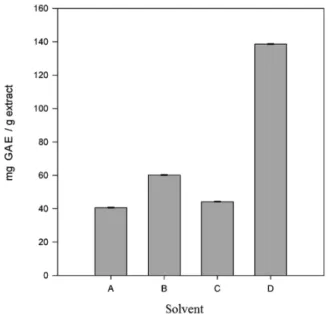
Determination of total phenolic contents
The total phenolic contents of extracts from E. viscosa were determined using the Folin-Ciocalteu reagent according to the method previously reported by Matkowski and Piotrowska9 with minor modifications. A total of 400 µL of a 0.05 mg L-1 methanolic extract solution was reacted with 2 mL of the Folin-Ciocalteu reagent (0.2 mol L-1) for 8 min at room temperature. The reaction was then neutralized with 7.5% sodium carbonate and allowed to stand for 90 min at room temperature. Absorbance was measured at 765 nm with a Pharmacia Biotech spectrophotometer Ultrospec U/V 3000. Quantification was done based on a standard curve with gallic acid. Results were expressed as mg of gallic acid equivalents (GAE) per g of dry extract. The absorbance versus concentration curve is described by the equation y = 0.012x − 0.018 (R2 = 0.9922), in which y: absorbance and x: concentration.
ABTS assay
The assay was performed with a Pharmacia Biotech spectrophotometer Ultrospec U/V 3000 using the ABTS (total antioxidant capacity) method described elsewhere10 with minor modifications. ABTS•+ radical
cations were generated by reacting 7 mmol L-1 ABTS with 140 mmol L-1 potassium persulfate. The reaction mixture was allowed to stand in the dark for 16 h at room temperature and was used within 1 day. The ABTS•+
solution was diluted with 50% ethanol to an absorbance of 0.700 ± 0.050 at 734 nm. Measurements were taken on a mixture of 3 mL of the ABTS•+ solution and 30 µL
of the 0.05 mg L-1 methanolic extract solutions over a period of 15 min (reading times 1 s, 5 s, 1, 3, 5, 10 and
15 min), and each set of measurements was taken at least three times and in triplicate. Inhibition (I, %) was calculated as follows:
(1)
where A0 is the absorbance of the control (methanol), and At is the absorbance of the mixture. A 0.05 mg L-1 Trolox® solution was used as a reference standard.
DPPH assay
The DPPH (1,1-diphenyl-2-picrylhydrazyl) radical scavenging assay was performed according to the method reported by Villaño et al.11 with some modifications. Briefly, 200 µL of either the 0.05 mg L-1 methanolic extract solutions or methanol (control) were added to 2.7 mL of a 40 µmol L-1 solution of DPPH in methanol. Mixtures were shaken vigorously, and the absorbance was measured using a Pharmacia Biotech spectrophotometer Ultrospec U/V 3000 over a period of 15 min (reading times 1 s, 5 s, 1, 3, 5, 10 and 15 min). Antiradical activity was expressed as an inhibition percentage (I, %) and calculated using the equation (1).
Oil oxidation
To determine the peroxide values, 20 mL of sunflower oil and 2 mL of the extracts (0.01 g mL-1) were oxidized by heating at 80 ºC for eight days. The control sample was made from 20 mL of sunflower oil and 2 mL of methanol.
Peroxide value assay
The peroxide value assay was conducted as described in Method Cd 8-53 of the AOCS Official Methods and Recommended Practices of the American Oil Chemists’ Society12 with minor modifications. Briefly, 2.5 g of sample were swirled in 15 mL of a 3:2 acetic acid-chloroform solution until dissolved. At this point, 0.25 mL of a saturated KI solution was added, the mixture was shaken for 1 min and an additional 15 mL of distilled water were added. The mixture was then titrated with 0.1 mol L-1 sodium thiosulfate standardized with a fresh solution of I3−prepared from KIO3 plus KI.
MTT cytotoxicity assay
of Ham’s F-10 medium supplemented with 10% newborn calf serum and 1% penicillin/streptomycin solution. Various doses of compounds 2, 3 and 6 (25, 50 and 250 µg per well)
were added, and the cells were incubated for 3 h. The medium was removed, and the cells were incubated for an additional 3 h with MTT (0.5 mg mL-1). The cells were washed carefully with phosphate buffered saline (PBS), then 200 µL of DMSO (dimethyl sulfoxide) was added to each well. The absorbance of the converted dye was measured at 595 nm in a Zenith 3100 microplate reader. Cytotoxicity was assessed by comparing the absorbance values of the treated cells with those of the control cells. Three independent experiments were performed.
Ames assay
Mutagenicity testing was conducted by the plate incorporation assay described by Maron and Ames13 using Salmonella typhimurium strains TA 98, TA 100 and TA 102 in the presence or absence of S9 mix.13 At least two independent experiments were performed for each assay.
Cytokinesis-block micronucleus assay (CBMN)
Approximately 5 × 10⁵ V79 Chinese hamster cells were cultured for 24 h in 25 cm2 culture flasks and then exposed to compounds 2, 3 and 6 at concentrations of 10,
25 or 50 µg mL-1. Cyclophosphamide (2.0 µg mL-1) and mitomycin C (2.5 µg mL-1) were used as positive controls for the experiments with and without S9 mix, respectively. At 24 h after the genotoxic treatment, the cells were washed with fresh culture medium, and cytochalasin-B (Cyt-B) was added to produce a final concentration of 4.5 µg mL-1. The cells were incubated for an additional 16 h, harvested by trypsinization, rinsed and submitted to a mild hypotonic treatment as described elsewhere.14 The centrifuged cells were placed onto dry slides, and smears were made. After air-drying, the slides were fixed with cold methanol for 30 min. One day later, the slides were stained with Giemsa (4% (v/v) in 0.01 mol L-1 sodium phosphate buffer, pH 6.8) for 10 min. For each experimental point, 1000 binucleate V79 cells (BN) with well-preserved cytoplasms were scored. Micronuclei were identified under a light microscope using a magnification of 1250 × according to the criteria proposed by Caria et al.15 It was evaluated the MN/BN value, which represents the average number of micronuclei per binucleated cell, and the percentage MNBN, which represents the fraction of cytokinesis-blocked (binucleated) cells with micronuclei, regardless of the number of micronuclei per BN cell.16 The decrease in cell proliferation was also measured in
these assays by determining the frequency of binucleate cells (BN, %). For this index, the number of nuclei in 1000 cells with well-preserved cytoplasms was determined at a magnification of 500×. At least two independent experiments were performed for each assay.
Statistical analysis
All the values presented throughout the text and tables correspond to mean values and respective standard deviations (SD) from all experiments. The statistical analysis was carried out with student’s t-test. All analyses were performed with the SPSS statistical package (version 17; Chicago, USA).
Crystal data for 6
Monoclinic crystals of 6 were formed by a slow
crystallization from 4:1 hexane/EtOAc. Operations were performed on a Bruker SMART CCD 1000 diffractometer using graphite-monochromated Mo Kα radiation at 293(2) K with 5287 reflections obtained (2175 independent, Rint = 0.0384), measured at θmax = 28.02º from a crystal of size 0.48 × 0.30 × 0.18 mm3 (C
20H36O2), yielding the following parameters: a = 9.5115(18), b = 7.0325(13), c = 14.496(3),
α = 90º, β = 104.630(4)º, γ = 90º, V = 938.2(3) Å3, dcalcd = 1.092 mg m-3, Z = 2, and spatial group P2(1). The structure was solved by a direct method and refined anisotropically to give R1 = 0.0619 and wR2 = 0.01591 for 2175[R(int) = 0.0384] independently observed reflections (I > 2σ(I), θ≤ 25º) with a goodness-of-fit = 0.989.
Results and Discussion
Compound 1 was obtained as a colorless oil with an
[α]D25 value of +55.2º (c 0.012, CHCl3). The HR-TOF-EIMS analysis of 1 revealed a molecular ion peak at m/z 336.2664
that corresponds to a molecular formula of C21H36O3 (calculated at 336.2664), which includes four degrees of unsaturation. The IR spectrum showed the presence of a methyl ester (1738 and 1385 cm-1) and an ether (1084 cm-1).
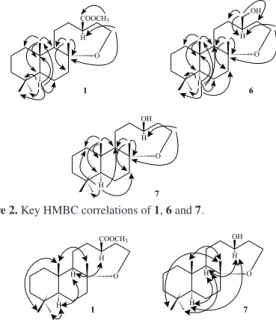
The 1H NMR spectrum of compound 1 showed signals corresponding to four tertiary methyl groups at dH 1.15, 0.88, 0.83 and 0.79 (s, each 3H), a methoxy group at dH 3.65 (s, 3H) and one diastereotopic oxymethylene at dH 3.71 (td, 1H, J 13.1, 2.7 Hz) and 3.65 (m, 1H, H-15) that had COSY (correlation spectroscopy) correlations with H-14 and HMBC (heteronuclear multiple bond correlation) correlations from H-15 to C-8 and C-14.
ester), nine methylenes, three methines and four quaternary carbons (one as part of a methyl ester) from the DEPT (distortionless enhancement by polarization transfer) spectrum. The 13C NMR chemical shifts of four methyl groups (dC 33.4, 23.5, 21.6 and 15.5), one methylene (dC 60.1), three methines (dC 56.4, 50.2 and 43.5) and three quaternary carbons (dC 78.5, 38.5 and 33.3) were very similar to those from an epoxylabdane scaffold. The other 13C and 1H NMR, 1H-1H COSY, HSQC (heteronuclear single
quantum coherence) and HMBC data (Table 1, Figure 2) were also consistent with such structure.17 The H-15/C-8 HMBC correlation, the presence of an ether (1067 cm-1) and the lack of an OH absorption in the IR spectrum, coupled with the four degrees of unsaturation, confirmed the presence of a 8α,15-epoxylabdane6 in which C-16 is part of a methyl ester (dC 177.5, 51.7). The NOESY (nuclear Overhauser effect spectroscopy) correlations (H-5/Me-18, H-9 and H-9/H-13) indicated that H-5, H-9, H-13 and Me-18 were all on the α face of the molecule, which means that C-9 and C-16 were β oriented (Figure 3). Additional NOESY correlations (Me-19/Me-17, Me-20) suggested that these methyl groups were also β oriented (Figure 3). Thus the structure of compound 1 was established as methyl
8α,15-epoxylabdan-16β-oate(Figure 1).
Compound 6 was obtained as a colorless oil with an
[α]D25 value of +21.2º (c 0.50, CHCl3).The HR-TOF-EIMS analysis showed a molecular ion peak at m/z 308.2714 (calculated at 308.2715), suggesting a tricyclic structure with a molecular formula of C20H36O2. The IR spectrum revealed bands corresponding to a hydroxyl group (3420 cm-1) and an ether (1026 cm-1).
The spectral (1H and 13C NMR) characteristics of compound 6 were very similar to those of 1, suggesting
that 6 is a derivative of 1. Differences in the 1H NMR
spectrum of 6 include the absence of the methyl ester
group and the presence of a hydroxyl group. The 1H NMR spectrum of the compound showed signals for four methyl groups at dH 1.16, 0.88, 0.79, and 0.76 (each 3H, s) and one diastereotopic oxymethylene at dH 3.81 (ddd, 1H, J 13.6, 10.7, 6.7 Hz) and 3.47 (m, 1H, H-15) that presented COSY correlations with H-14. The HMBC correlations (H-15/C-8, C-14) were in good agreement with the presence of an 8,15-epoxy ring, and another oxymethylene at dH 3.43 (dd, 1H, J 10.4, 6.2 Hz) and 3.41 (dd, 1H, J 10.4, 6.5 Hz) showed a COSY correlation with H-13 and HMBC correlations (H-16/C-13, C-12, C-14) that established position 16 as the new oxymethylene.
The 13C NMR DEPT spectrum showed 20 carbons, which were interpreted as four methyls, ten methylenes, three methines and three quaternary carbons. The 13C NMR chemical shifts of the four methyls (dC 33.4, 24.3, 21.4 and 15.8), two of the methylenes (dC 68.8 and 57.4), the three methines (dC 57.1, 56.5 and 40.7) and the three quaternary carbons (dC 78.5, 39.4 and 33.5), along with the 1H NMR, 1H-1H COSY, HSQC and HMBC data (Table 1, Figure 2),
were found to be consistent with an 8,15-epoxylabdane structure similar to compound 1. The 1H-1H COSY correlations (H-16/H-13) and the HMBC correlations (H-16/C-12, C-13, C-14) established the structure of 6 as
an 8α,15-epoxylabdane in which C-16 bears a hydroxyl group. Complete assignments for the NMR spectra of compound 6 were achieved by 1H-1H COSY, HSQC and
HMBC (Table 1). The structure of compound 6 was
established as 8α,15-epoxylabdan-16-ol (Figure 1). The hydrolysis of 2 (with a 4% solution of KOH/MeOH,
at room temperature, 2 h) led to the isolation of a product whose NMR spectra and optical rotation data were identical with those of the natural alcohol 6. Colorless crystals of the
hydrolysis product (6) were obtained by slow crystallization
in 4:1 hexane/EtOAc and were found to have a melting point of 119-120 ºC. The relative stereochemistry for compound 6 at C-5, C-8, C-9 and C-16 was established by
single crystal X-ray diffraction analysis of the hydrolysis product, which was determined to be 8α ,15-epoxylabdan-16β-ol (Figure 4).
Compound 7 was obtained as a colorless oil with an
[α]D25 value of +25.2º (c 0.16, CHCl3).The HR-TOF-EIMS presented a molecular ion peak at m/z 294.2561 (calculated at 294.2559), suggesting a tricyclic structure with a molecular formula of C19H34O2. The IR spectrum revealed bands characteristic of a hydroxyl group (3426 cm-1) and an ether (1072 cm-1).
Figure 2. Key HMBC correlations of 1, 6 and 7.
The 1H NMR spectrum of 7 displayed features similar to those of 6 (Table 2), except that the H-16 signal was
absent and the H-13 signal was 2.00 ppm downfield compared to the same signal in compound 6. The
deshielding of H-13 may be explained by the presence of a geminal hydroxyl group. The concomitant downfield shift of the C-13 signal to dC 71.53 (Dd ca. 31 ppm) is also indicative of an hydroxyl group located at C-13. NOESY correlations (H-9/H-5, Me-18 and H-13/H-9, H-5, Me-18) indicated that H-5, H-9, H-13 and Me-18 were on the
α-face of the molecule; consequently, C-9 and C-13-OH were β oriented (Figure 3). Additional NOESY correlations (Me-17/Me-19, Me-20) suggested that these methyl groups were also β oriented. Thus, the structure of compound 7
was established as 8α,15-epoxy-16-norlabdan-13β-ol. Our group has already reported a related 8α ,15-epoxy-16-norlabdan-13-one from the same plant.6
Earlier studies on this plant6 were conducted with an extract obtained by Soxleht extraction and doubts remained if the 8,15-epoxy ring was an artifact of the extraction process. However, the same scaffold was isolated from the extract obtained by maceration at room temperature with a different solvent. Therefore, the 8,15-epoxylabdanes can be confirmed as natural products and not artifacts.
A genotoxicity analysis of the induction of micronuclei by compounds 2, 3 and 6 is presented in Table 3, which
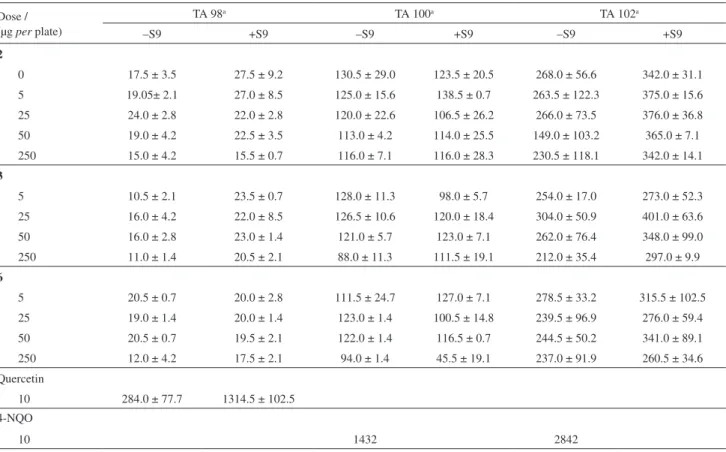
shows the frequency of micronucleated binucleated cells (MNBN, %), the number of micronuclei per binucleated cell (MN/BN) and the decrease in cell proliferation due to the frequency of binucleated cells (%). These compounds showed no statistically significant increase in genotoxicity. No mutagenic activity was observed in the Ames test (Table 4) on all the strains tested in the presence or the absence of S9 mix. The cytotoxicities of compounds 2, 3 and 6 were analyzed in V79 cells by the MTT assay. The
data in Table 5 shows that cytotoxicity was evident at the lowest concentration tested. From the three compounds,
6 was the most cytotoxic, resulting in less than 50%
survival at an exposure of 25 µg per well. At the highest
concentration tested (250 µg per well), cell viability for all compounds was below 9%, and compound 6 exhibited
the highest overall cytotoxicity in V79 cells. According to the micronucleus assay, none of the three compounds are genotoxic in V79 cells at the concentrations tested, indicating that genotoxic activity is apparently not the main reason for their cytotoxicity.
The hexane (1 and 2), dichloromethane and ethyl acetate extracts of E. viscosa were tested by the DPPH and ABTS methods to measure their antioxidant capacities; the peroxide values and the total phenolic contents were also determined. The extracts have a very low antioxidant capacity with respect to both DPPH (Figure 5) and ABTS radicals (Figure 6) when compared to a 0.05 mg mL-1 Trolox® solution. The antioxidant capacities of the extracts tested were also expressed in TEAC (Trolox®
Figure 4. Molecular structure of 6 generated by X-ray diffraction.
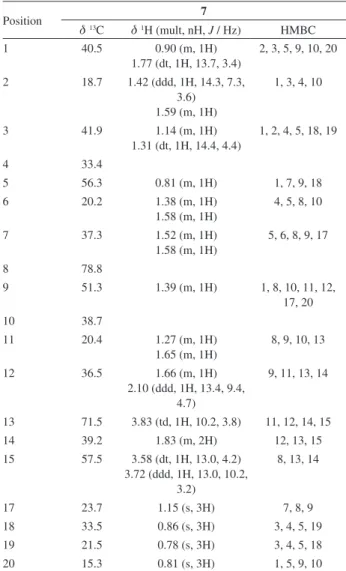
Table 2.1H and 13C NMR data and HMBC correlations of compound 7a
Position 7
d13C d1H (mult, nH, J / Hz) HMBC
1 40.5 0.90 (m, 1H)
1.77 (dt, 1H, 13.7, 3.4)
2, 3, 5, 9, 10, 20
2 18.7 1.42 (ddd, 1H, 14.3, 7.3, 3.6)
1.59 (m, 1H)
1, 3, 4, 10
3 41.9 1.14 (m, 1H)
1.31 (dt, 1H, 14.4, 4.4)
1, 2, 4, 5, 18, 19
4 33.4
5 56.3 0.81 (m, 1H) 1, 7, 9, 18
6 20.2 1.38 (m, 1H)
1.58 (m, 1H)
4, 5, 8, 10
7 37.3 1.52 (m, 1H)
1.58 (m, 1H)
5, 6, 8, 9, 17
8 78.8
9 51.3 1.39 (m, 1H) 1, 8, 10, 11, 12,
17, 20
10 38.7
11 20.4 1.27 (m, 1H)
1.65 (m, 1H)
8, 9, 10, 13
12 36.5 1.66 (m, 1H)
2.10 (ddd, 1H, 13.4, 9.4, 4.7)
9, 11, 13, 14
13 71.5 3.83 (td, 1H, 10.2, 3.8) 11, 12, 14, 15
14 39.2 1.83 (m, 2H) 12, 13, 15
15 57.5 3.58 (dt, 1H, 13.0, 4.2) 3.72 (ddd, 1H, 13.0, 10.2,
3.2)
8, 13, 14
17 23.7 1.15 (s, 3H) 7, 8, 9
18 33.5 0.86 (s, 3H) 3, 4, 5, 19
19 21.5 0.78 (s, 3H) 3, 4, 5, 18
20 15.3 0.81 (s, 3H) 1, 5, 9, 10
aSpectra were recorded at 600 and 150.9 MHz for 1H and 13C NMR,
Table 4. Mutagenic activity of compounds 2, 3 and 6 in the Ames assay in the presence and absence of metabolic activation (S9) (Salmonella typhimurium
strains TA 98, 100 and 102)
Dose / (µg per plate)
TA 98a TA 100a TA 102a
–S9 +S9 –S9 +S9 –S9 +S9
2
0 17.5 ± 3.5 27.5 ± 9.2 130.5 ± 29.0 123.5 ± 20.5 268.0 ± 56.6 342.0 ± 31.1
5 19.05± 2.1 27.0 ± 8.5 125.0 ± 15.6 138.5 ± 0.7 263.5 ± 122.3 375.0 ± 15.6
25 24.0 ± 2.8 22.0 ± 2.8 120.0 ± 22.6 106.5 ± 26.2 266.0 ± 73.5 376.0 ± 36.8
50 19.0 ± 4.2 22.5 ± 3.5 113.0 ± 4.2 114.0 ± 25.5 149.0 ± 103.2 365.0 ± 7.1
250 15.0 ± 4.2 15.5 ± 0.7 116.0 ± 7.1 116.0 ± 28.3 230.5 ± 118.1 342.0 ± 14.1
3
5 10.5 ± 2.1 23.5 ± 0.7 128.0 ± 11.3 98.0 ± 5.7 254.0 ± 17.0 273.0 ± 52.3
25 16.0 ± 4.2 22.0 ± 8.5 126.5 ± 10.6 120.0 ± 18.4 304.0 ± 50.9 401.0 ± 63.6
50 16.0 ± 2.8 23.0 ± 1.4 121.0 ± 5.7 123.0 ± 7.1 262.0 ± 76.4 348.0 ± 99.0
250 11.0 ± 1.4 20.5 ± 2.1 88.0 ± 11.3 111.5 ± 19.1 212.0 ± 35.4 297.0 ± 9.9
6
5 20.5 ± 0.7 20.0 ± 2.8 111.5 ± 24.7 127.0 ± 7.1 278.5 ± 33.2 315.5 ± 102.5
25 19.0 ± 1.4 20.0 ± 1.4 123.0 ± 1.4 100.5 ± 14.8 239.5 ± 96.9 276.0 ± 59.4
50 20.5 ± 0.7 19.5 ± 2.1 122.0 ± 1.4 116.5 ± 0.7 244.5 ± 50.2 341.0 ± 89.1
250 12.0 ± 4.2 17.5 ± 2.1 94.0 ± 1.4 45.5 ± 19.1 237.0 ± 91.9 260.5 ± 34.6
Quercetin
10 284.0 ± 77.7 1314.5 ± 102.5
4-NQO
10 1432 2842
Values are presented as the mean ± standard error (n = 2). Quercetin and 4-NQO were used as positive controls. Values are not significant (p > 0.05).
aNumber of revertents; 4-NQO: 4-nitroquinoline-1-oxide.
Table 3. Effect of compounds 2, 3 and 6 on the frequency of micronucleated binucleated cells (MNBN, %) in V79 Chinese hamster cells in the presence (+S9) and absence (−S9) of metabolic activation
Test compound / (µg mL-1)
MN/BN MNBN / % BN / %
−S9 +S9 −S9 +S9 −S9 +S9
2
0 0.003 ± 0.001 0.002 ± 0.001 0.300 ± 0.071 0.167 ± 0.058 40.950 ± 14.213 37.400 ± 2.263 10 0.005 ± 0.001 0.000 ± 0.000 0.450 ± 0.071 0.000 ± 0.000 34.600 ± 1.980 49.950 ± 5.586
25 0.004 ± 0.000 0.003 ± 0.000 0.400 ± 0.000 0.003 ± 0.000 37.700 ± 2.687 48.950 ± 15.344
3
10 0.004 ± 0.000 0.001 ± 0.001 0.467 ± 0.115 0.100 ± 0.141 39.250 ± 16.617 35.900 ± 4.243
50 0.006 ± 0.002 0.002 ± 0.001 0.450 ± 0.071 0.133 ± 0.115 45.900 ± 9.617 40.350 ± 7.707
6
10 0.003 ± 0.001 0.002 ± 0.002 0.250 ± 0.071 0.167 ± 0.153 35.400 ± 1.414 37.600 ± 2.546 25 0.003 ± 0.000 0.001 ± 0.001 0.300 ± 0.000 0.100 ± 0.100 37.600 ± 7.495 33.750 ± 1.626
Mytomicin C
2.5 µg mL-1 0.154 ± 0.022 − 10.475 ± 1.790 − 25.000 ± 4.243 −
Cyclophosphamide
2.0 µg mL-1 − 0.036 ± 0.022 − 2.100 ± 0.265 − 38.600 ± 0.141
Table 5. Effect of compounds 2, 3 and 6 on cell viability of V79 Chinese hamster cells using the MTT assay
Dose / (µg per well)
Viabilitya / %
2 3 6
25 88.6 ± 21.4 66.5 ± 26.6 43.0 ± 12.5
50 48.7 ± 39.9 37.6 ± 23.0 35.0 ± 4.1
250 4.2 ± 4.6 10.8 ± 13.0 8.3 ± 5.9
aViability is expressed as percentage values relative to control cells. Results
are expressed as mean value viability ± standard deviations (SD) (n = 3). In each independent experiment, four replicate cultures were used.
Figure 5. Percentage of inhibition for the DPPH assay (n = 9 ± standard error (SE)) E. viscosa extracts in different solvents. A: dichloromethane;
B: hexane 1; C: hexane 2; D: ethyl acetate; Trolox® 0.05 mg mL-1 as
positive control.
Figure 6. Percentage of inhibition for the ABTS assay (n = 9 ± SE) by E. viscosa extracts in different solvents. A: dichloromethane; B: hexane 1;
C: hexane 2; D: ethyl acetate; Trolox® 0.05 mg mL-1 as positive control.
Figure 7. TEAC value for E. viscosa extracts in different solvents. A: dichloromethane; B: hexane 1; C: hexane 2; D: ethyl acetate. equivalent antioxidant capacity) values (Figure 7), which are defined as the concentration of Trolox® that has the same activity as 1 mmol L-1 of the antioxidant substance investigated. Unfortunately, the TEAC values may not correlate exactly with the antioxidant capacities. There may be a high TEAC value for a compound with a relatively low antioxidant capacity because the products of the reaction of ABTS•+ with a given compound can
also react with ABTS•+, contributing to an increase in the
Conclusions
T h e p r e s e n t p h y t o c h e m i c a l i nve s t i g a t i o n of aerial parts of E. viscosa (Retz.) Trin. afforded three new 8α,15-epoxylabdanes 1, 6 and 7 along
with known compounds 8α ,15-epoxy-16-norlabdan-13-one (3), 8α,15-epoxylabdan-16β-oic acid (4),
3β-(3’’,4’’-dihydroxy)-(E)-cinnamoyloxylup-20(29)-ene (5), 3-(2’,3’,4’,6’-tetra-O-acetyl-β
-D-glucopyranosyloxy)-β-sitosterol (8) and 16-acetoxy-8,15-epoxylabdane (2).
Genotoxicity, mutagenicity and cytotoxicity were tested for compounds 2, 3 and 6, genotoxic and mutagenic assays
were negative but all compounds proved to be cytotoxic and compound 6 was shown to be the most cytotoxic of the
compounds tested.
Antioxidant capacity of the hexane (1 and 2), dichloromethane and ethyl acetate extracts of E. viscosa were tested but all extracts presented a very low antioxidant capacity. The ethyl acetate extract had the highest phenolic content of all extracts and dichloromethane and ethyl acetate extracts present the best protection to sunflower oil from oxidation.
Supplementary Information
Crystallographic data (excluding structure factors) for the structure in this work was deposited in the Cambridge Crystallographic Data Centre as supplementary publication number CCDC 860140. 1D and 2D NMR spectra data associated with this article are available free of charge at http://jbcs.sbq.org.br as a PDF file.
Acknowledgements
This work was partially funded by the projects POCTI/ QUI/39380/2001 and FCOMP-01-0124-FEDER-007430 (under COMPETE with FEDER funding) of the Fundação para a Ciência e Tecnologia (FCT) and the Textile and Paper Materials Center. One of the authors (N’S. N. Sebastião) gratefully acknowledges a GRICES PhD scholarship and INABE (Angola) for financial support.
References
1. Pant, C. S.; Dhami, K. S.; Asian J. Chem.2003, 15, 225. 2. Tulloch, A. P.; Phytochemistry1982, 21, 661.
3. Bultosa, G.; Taylor, J. R. N.; Starch/Stärke2003, 55, 304. 4. Gargano, A. O.; Aduriz, M. A.; Arelovich, H. M.; Amela, M. I.;
Trop. Grasslands2001, 35, 161.
5. dos Santos, A. F.; Lopes, L. A.; Mata, R. C. S.; de Mendonça, D. I. M. D.; Sant’Ana, A. E. G.; Bioresour. Technol.2007, 98, 135.
6. Sebastião, N’S. N.; Cordeiro, I. J. S.; dos Santos, A. F.; Gaspar, J. F.; Martins, C.; Rueff, J.; Diakanamwa, C.; Sant’Ana, A. E. G.; de Mendonça, D. I. M. D.; Phytochemistry2010, 71, 798. 7. Borges, C. M. P.; Diakanawma, C.; de Mendonça D. I. M. D.;
J. Braz. Chem. Soc.2010, 21, 1121.
8. Ahmad, V. U.; Rahman, A.; Handbook of Natural Products Data: Pentacyclic Triterpenoids, vol. 2; Elsevier Science B.V.: Amsterdam, The Netherlands, 1994, p. 1187.
9. Matkowski, A.; Piotrowska, M.; Fitoterapia2006, 77, 346. 10. Re, R.; Pellegrini, N.; Proteggente, A.; Pannala, A.; Yang, M.;
Rice-Evans, C.; Free Radical Biol. Med.1999, 26, 1231.
Figure 8. Total phenolic concentration determined by the Folin-Ciocalteau
method for E. viscosa extracts in different solvents. A: dichloromethane; B: hexane 1; C: hexane 2; D: ethyl acetate.
Figure 9. Peroxide value for E. viscosa extracts in different solvents,
11. Villaño, D.; Fernández-Pachón, M. S.; Moyá, M. L.; Troncoso, A. M.; García-Parrilla, M. C.; Talanta2007, 71, 230.
12. American Oil Chemists’ Society, AOCS Official Method Cd 8-53 In Official Methods and Recommended Practices of the AOCS; Firestone, D., ed; AOCS: Champaign, USA, 2003. 13. Maron, D. M.; Ames, B. N.; Mutat. Res.1983, 113, 173.
14. van Hummelen, P.; Kirsch-Volders, M.; Mutagenesis1990, 5, 203.
15. Caria, H.; Chaveca, T.; Laires, A.; Rueff, J.; Mutat. Res.1995,
343, 85.
16. Oliveira, N. G.; Castro, M.; Rodrigues, A. S.; Gonçalves, I. C.; Cassapo, R.; Fernandes, A. P.; Chaveca, T.; Toscano-Rico, J. M.; Rueff, J.; Mutagenesis2001, 16, 369.
17. Ziegler, G.; Spiteller, G.; Flavour Fragance J. 1992, 7, 141.
18. Arts, M. J. T. J; Haenen, G. R. M. M; Voss, H. P.; Bast, A.; Food Chem. Toxicol.2004, 42, 45.