Article
Printed in Brazil - ©2016 Sociedade Brasileira de Química0103 - 5053 $6.00+0.00*e-mail: [email protected], [email protected]
Soil Organic Carbon Determination Using NIRS: Evaluation of Dichromate
Oxidation and Dry Combustion Analysis
as Reference Methods in Multivariate
Calibration
Karla K. Beltrame,a André M. Souza,*,b Maurício R. Coelho,b Thayane C. B. Winkler,b
Wyrllen E. Souzaa and Patrícia Valderrama*,a
aUniversidade Tecnológica Federal do Paraná, UTFPR, CP 271,
87301-899 Campo Mourão-PR, Brazil
bEmpresa Brasileira de Pesquisa Agropecuária, EMBRAPA Solos,
22460-000 Rio de Janeiro-RJ, Brazil
Dichromate oxidation and dry combustion analysis were evaluated as reference methods to determine organic carbon in Brazilian soils using near infrared spectroscopy (NIRS) as an alternative. The main objective of this study was to evaluate which of the reference methods could provide a calibration model with higher predictive ability. A total of 161 soil samples obtained from horizons in full profiles (Parque Estadual da Mata Seca, Minas Gerais State, Brazil) were used. Models were mean centered and built from partial least squares. The dichromate oxidation method presented a lower accuracy when compared to dry combustion analysis as reference for NIRS. Figures of merit such as sensitivity, analytical sensitivity, detection and quantification limits, adjust and linearity presented results very similar. A paired t-test was applied to the figures of merit results and with 95% confidence did not show significant differences between the two methods used as reference for NIRS. The non-parametric Mann Whitney test showed that the samples provided with the partial least squares (PLS) model when the reference method was the dichromate oxidation or dry combustion analysis come from the same population, indicating that the reference methods employed for multivariate calibration from NIRS provide the same results practically.
Keywords: soil carbon stock, figure of merit, PLS, non-parametric test, paired t-test, routine
soil analysis
Introduction
Soil organic carbon (SOC) is crucial for the function of ecosystems and agriculture.1 The SOC is one of the
most important components of agricultural development, especially with regard to increased agricultural productivity. In Brazil, research in soil fertility and the scientific and technological innovations contributed to the efficient use of corrective and fertilizer in agriculture.2
In addition, the recent adoption by the Brazilian government to the ‘ABC program’ (Agriculture Low Carbon), which aims to fund projects producers to adopt conservation systems with positive balance of carbon stock in soil, increases the need to monitor the soil carbon changes.3
Soil analysis laboratories, located in Brazil, determine
SOC based on analytical methods usually employed in the form of dichromate oxidation of carbon, with varying adaptations,3 or dry combustion analysis.
The Brazilian Agricultural Research Corporation (EMBRAPA) has created a near infrared (NIR) spectroscopy network to develop, validate and implement this technique as a routine method for determination of several chemical parameters in agricultural matrices as soil4 and SOC is an
interest parameter to be determined. Previous research employed NIR5 and visible-NIR6-8 spectroscopy to SOC
monitoring. However, with the best of our knowledge, there is no manuscript that describes the comparison of dichromate oxidation and dry combustion analysis as reference method for NIR determination of SOC.
potentiality of a dichromate oxidation method compared to dry combustion analysis to produce this model.
Experimental
Materials and methods
A total of 161 soil samples obtained from horizons in full profiles were used in this research. These samples origin was Parque Estadual da Mata Seca in the state of Minas Gerais, Brazil. The soil samples were dried at 40 °C for 48 hours, a rubber mallet was used to break clusters, granulometry of the sample was controlled by passing these through a sieve with ground to a size fraction < 2 mm.
These samples were analyzed according to elemental analysis using the methodologies proposed by Nelson and Sommers,9 and by dichromate oxidation of carbon, with
adaptations.10 For the dichromate oxidation method, 0.5 g
of soil sample was transferred to a 250.0 mL Erlenmeyer flask, to which was added 10.0 mL of 0.4 mol L-1 potassium
dichromate solution. After this procedure, a test tube (25.0 mm of diameter and 250.0 mm of height) completed with water was put into the Erlenmeyer flask containing the soil and potassium dichromate solution. This combination formed a system condenser. The system was heated using an electric plate until light boiling for five minutes. After cooling, 80.0 mL of distilled water, 2.0 mL of orthophosphoric acid and 3.0 drops of diphenylamine indicator was added to the system. The chemical reaction involved the organic matter oxidation with potassium dichromate in orthophosphoric acid is:
2 Cr2O72−(aq) + 3 CO(s) + 16 H+(aq)→ 4 Cr3+(aq) + 3 CO2(g) +
8 H2O(l)
The system was titrated using an ammonium ferrous sulfate solution 0.1 mol L-1 until the color changed from
blue to green. The reaction is based on the titration of the dichromate excess after oxidation with ammonium ferrous sulfate solution:
Cr2O72−(aq) + 6 Fe2+(aq) + 14 H+(aq)→ 2 Cr3+(aq) + 6 Fe3+(aq) +
7 H2O(l)
A blank sample (solution without the presence of the analyte) was also titrated. The SOC was calculated by equation 1, where 0.6 is a factor derived from volume in mL of dichromate, total volume of solution in mL, equivalent mass of carbon in g, and mass of soil sample in kg. The equation 1 is adopted by EMBRAPA,10 and is an
adaptation of the original equation proposed in Walkley and Black method.11
(1)
For dry combustion analysis, 25 mg of soil sample was analyzed on a PerkinElmer 2400 elemental analyzer under the following conditions: combustion temperature: 925 oC,
reduction temperature: 640 ºC, minimum purity gas: He (99.995%), O2 (99.995%) and N2 (99.0%) and pressure of
1.5, 1 and 4 bar, respectively.
Precision, at level of repeatability, was assessed for both reference methods by analysis of six samples with two replicates each, in measurements made in the same day. The results were determined as the mean of the standard deviation,12 these values are important to evaluate the
partial least squares (PLS) models performance as stated by ASTM E 1655-05.13
The NIR spectra for the soil samples were acquired using PerkinElmer equipment, equipped with diffuse reflectance accessory (NIRA). The equipment and integrating sphere are equipped with DTGS/AsInGa detectors, respectively. The spectra were acquired in the region 4000-10000 cm-1,
spectral resolution of 4 cm-1, 64 scans, at the percentage
of reflectance mode.
Development of calibration models and validation
The multivariate calibration models were developed based on partial least squares (PLS) regression,14 frequently
used in NIR spectroscopy.15 External validation was used
in this study to check the performance of the PLS model. Then, the samples in the external validation set had not been used for the calibration development. Soil samples were divided into calibration set (105 samples) and validation set (56 samples) by the Kennard-Stone algorithm.16 Mean
centered spectra, even as first derivative were used for data preprocessing. The first derivative was implemented using Savitzky-Golay algorithm.17 The optimum model
dimension was determined by the minimum root mean squares error for cross validation (RMSECV) for the calibration samples, obtained by 10 samples contiguous block cross validation.
The ASTM E-1655-0513 suggests evaluate outliers
in calibration and validation sets according to leverage and unmodeled residuals in spectral data. Martens and Naes18 proposes evaluate also unmodeled residuals in
leverage, unmodeled residuals in spectral data, and unmodeled residuals in the dependent variable.19
Methods for outliers identification were applied independently for each model. Thus, different samples, in each case, were identified as outliers, which produced optimized models with different numbers of samples into calibration and validation sets. Thus, it was not possible to apply a parametric test (as paired t-test) to compare the prediction results obtained from both models. Then, the non-parametric Mann Whitney test was applied to the prediction results from models to verify if the results come from the same population.20
The performance of the PLS models were evaluated by figures of merit determination, such as: accuracy, sensitivity, analytical sensitivity, detection and quantification limits, adjust and linearity. The figures of merit were calculated according to previous research.12,19,21 To evaluate differences
between the models produced with dichromate oxidation or dry combustion analysis as reference method, the results of figures of merit for both models were subjected to a paired t-test.22
Results and Discussion
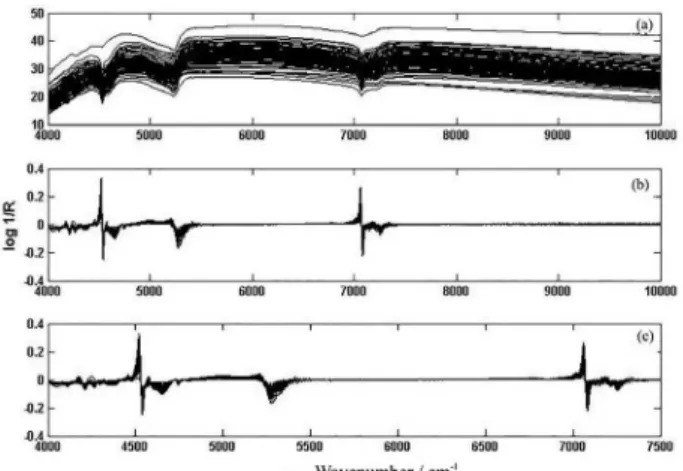
The NIR spectra of the soil samples are shown in Figure 1a. The spectral baseline was corrected by Savitzky-Golay algorithm,17 through first derivative
(15 points and second order polynomial),23 as shown
in Figure 1b. The spectral region after 7500 cm-1
was removed due this region not present relevant information. The Figure 1c presents the NIR spectra of soil samples, in the range used to build the models, after first derivative. According to Peng et al.,24 the important
wavelengths (λ) in the near infrared spectral region for SOC content estimations are 1400 and 1900-2450 nm, that in wavenumber (ν = 1/λ) correspond to 7142.8 and 5263.2-4081.6 cm-1, in agreement with the NIR region
used in the models development.
The first step in the model development was outlier detection. This procedure can improve model quality. Outliers can be defined as observations showing some type of departure from the bulk of the data. They may occur for many different reasons, such as laboratory error, objects from another population and instrument error, for example.25 The outliers detection resulted in 93 calibration
samples for both models and 50 and 44 validation samples for models using dichromate oxidation and dry combustion analysis as reference method, respectively.
Due to the difference presented between the number of validation samples, it was not possible to apply a parametric test (as F-test,26 or paired t-test) to compare
the prediction results obtained from both models. Then, the non-parametric Mann Whitney test was applied and showed that the samples provided with the PLS model, when the reference method was dichromate oxidation and samples provided with the PLS model when the reference method was dry combustion analysis come from the same population. This test was a preliminary assessment to verify differences between the two reference methods.
The optimum model dimension was determined by the minimum RMSECV for the calibration samples, obtained by contiguous block cross validation of 10 samples. Five latent variable, for both models, were necessary to retain a significant variance in the data.
The figures of merit for first order multivariate calibration were described in earlier papers,12,19,21,25,27 and
are not described in detail here. The results for the figures of merit obtained from PLS models are shown in the Table 1. Accuracy values, represented by root mean square error of calibration (RMSEC) and prediction (RMSEP), showed an adequate dimensionality of the models, so the number of latent variables used in the models were properly chosen. It is possible to conclude that because an ideal multivariate calibration model will show close values of RMSEC and RMSEP due to the random errors fit in the model.28
Furthermore, the RMSEC and RMSEP showed that the estimated values of the multivariate models are in agreement with the reference methods that presented precision 7.0358 and 9.4692 g kg-1 for dry combustion and dichromate
oxidation methods, respectively. According to ASTM E1655-05,13 the accuracy of a component concentration or
property value estimated by a multivariate infrared analysis is highly dependent on the accuracy and precision of the reference values used in the calibration. The expected agreement between the infrared estimated values and those obtained from a single reference measurement can never exceed the repeatability of the reference method, since, even
if the infrared estimated the true value, the measurement of agreement is limited by the precision of the reference values. The accuracy presented by the PLS model when the reference method was dry combustion analysis was higher than when dichromate oxidation was the reference method to NIR calibration, this was expected since the dry combustion presented a precision (in the repeatability level) better than the dichromate oxidation method.
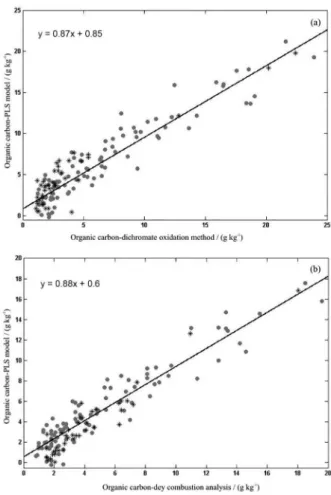
Another way to confirm the achieved accuracy is the adjust or fit to the models, represented by the plot of the SOC determined by reference methods against SOC determined by PLS model. It is possible to observe the slope, the intercept, shown in Figure 2, and the determination coefficient (R-squared), presented in Table 1. The R-squared values were close to 0.9 in both models indicating a proper fit and reinforce the accuracy results achieved.
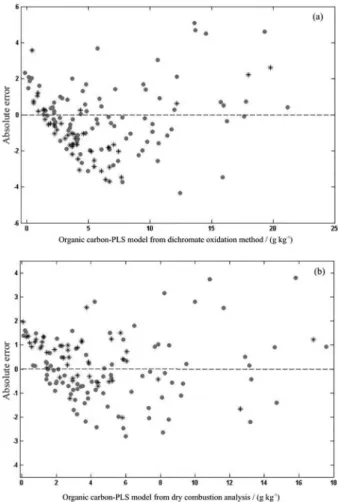
Figure 3 shows the residuals plot of the calibration and validation samples. The residuals distribution seems to present a random behavior, which reinforces that the data fit to a linear model.
To confirm the random distribution of these residuals, appropriate statistical tests were performed in order to check normality (Jarque-Bera test),29 homoscedasticity
(Brown-Forsythe test),30 and no correlation (Durbin-Watson
test),31 all with 95% confidence. The results were presented
in Table 1 and all results indicated the randomness of the residuals. For Jarque-Bera test, when JBSTAT < CRITVAL, the null hypothesis (residuals are normally distributed with unspecified mean and standard deviation) can be accepted at significance level of 95%. The associated probability for the F-test, performed by Brown-Forsythe test, is equal or larger than 0.05. Therefore, the assumption of
homoscedasticity was met. The value of Durbin-Watson test calculated 1.9241 and 2.1799 when dichromate oxidation and dry combustion were reference methods, respectively,
Table 1. Figures of merit for the PLS calibration models
Figure of merit
Dichromate oxidation as reference method
(5 VLs)
Dry combustion analysis as reference method
(5 VLs)
Accuracy / (g kg-1) RMSEC
a 1.9427 1.4901
RMSEPb 1.9795 1.0430
Sensitivity / (g kg-1)-1 0.0106 0.0125
Analytical sensitivity-1 /(g kg-1) 0.1326 0.1124
Limit of detection / (g kg-1) 0.4377 0.3710
Limit of quantification / (g kg-1) 1.3262 1.1244
Fit (R-squared) 0.8710 0.8829
Linearity
Jarque-Bera test JBSTAT = 3.7077
CRITVAL = 4.9697
JBSTAT = 2.2675 CRITVAL = 4.8465
Brown-Forsythe test F = 0.4844 F = 0.6181
Durbin-Watson test 1.9241 2.1799
Bias (systematic errors) t = 3.1496
t49/95% = 1.6766
t = 3.3207
t43/95% = 1.6811 aRMSEC: root mean square error of calibration (RMSEC); bRMSEP: root mean square error of prediction.
are within the acceptable limits (1.50-2.50),27 ensuring
independence of residuals. However, by applying a bias test (systematic errors test) proposed by ASTM E1655-0513 in
the residuals of validation sets for both models, it is verified that the bias presented at this residuals are significant (results in Table 1). If the t value calculated is greater than the tabulated t value, there is a 95% probability that the estimate from the multivariate model will not give the same average results as the reference method,13 this shows that
the average error is not zero and suggests a small sampling error. Statistically, the bias test does not mean that the data show significant systematic errors, but that the average error is different from zero. If the average errors are calculated and subtracted from each of the error values, and the bias test proposed by ASTM is applied again, then the t value calculated (tdichromate oxidation = 1.5656 × 10⁻¹⁶ and tdry combustion
= 4.4455 × 10⁻¹⁶) is smaller than the tabulated t value. The
results show that the average error now is zero and the bias present in the models is not significant. This can easily occur with real and complex samples (as soil samples in this case).
The results for sensitivity are somehow complex to judge because of the preprocessing adopted in PLS. However, the analytical sensitivity is simpler and more informative to compare and to judge the sensitivity of an inverse multivariate calibration method and was calculated by relationship between the sensitivity and the instrumental noise. The inverse of the analytical sensitivity (analytical sensitivity-1) allows one to establish a minimum
concentration difference that is discernible by the model in the range of concentrations where it was applied,12,28
considering the spectral noise representing the large source of error.25 Thus, considering the instrumental noise as the
only source of uncertainty, it is possible to distinguish samples with organic carbon concentrations in order of 0.1 g kg-1 when both methods were used as reference to
the NIR calibration.
Limits of detection and quantification12,32 for the
models show coherent results with the measured quantities. Therefore, the PLS models are appropriate to quantify organic carbon, since their ranges are between 1.25-23.90 g kg-1 and 0.80-19.6 g kg-1, respectively, when
the dichromate oxidation and dry combustion analysis was the reference method.
Due to the results of figures of merit shown in Table 1 being very similar, a paired t-test was applied to these results in order to evaluate significant differences between the methods used as reference in the multivariate calibration. In this test, the t value calculated was 1.801, while the theoretical t value for this case is 2.447 with six degrees of freedom at the 95% confidence level. Thus, there are no significant differences between the figures of merit for the PLS models when the dichromate oxidation or dry combustion analysis was used to build the NIR calibration. These results suggest that, dichromate oxidation and dry combustion analysis as reference method for multivariate calibration from NIR produce models with no significant differences in the prediction ability.
Conclusions
Determination of organic carbon were accessed by PLS model based on NIR spectroscopy. The models using dichromate oxidation and dry combustion analysis as reference methods for NIR calibration presented feasible and acceptable results, and no significant differences in the prediction ability was observed. The NIR-PLS procedure to organic carbon determination in soil samples present the advantage of minimal sample preparation and possibility to extend to other parameters using the same NIR spectra. This work was a preliminary study, so in future researches this investigation will be amplified to a larger
number of representative Brazilian soil samples, with a bigger range of SOC concentration aiming to achieve even more conclusive results.
Acknowledgments
The authors acknowledge the EMBRAPA-SOILS for financial support (MP3 03.12.03.010.00.00), equipment and reagents. Karla Karine Beltrame thanks UTFPR-Campo Mourão for the TCC fellowship.
References
1. Knadel, M.; Thomsen, A.; Schelde, K.; Greve, M. H.; Comput. Electron. Agric.2015, 114, 134.
2. Novais, R. F.; Alvarez, V. H.; Barros, N. F.; Fontes, R. L. F.; Cantarutti, R. B.; Neves, J. C. L.; Fertilidade do Solo,1a ed.;
Sociedade Brasileira de Ciência do Solo: Viçosa, Brasil, 2007. 3. Sato, J. H.; de Figueiredo, C. C.; Marchao, R. L.; Madari, B.
E.; Benedito, L. E. C.; Busato, J. G.; Souza, D. M.; Sci. Agric. 2014, 71, 302.
4. https://www.agropediabrasilis.cnptia.embrapa.br/web/rede-nir, accessed in January 2016.
5. Cambule, A. H.; Rossiter, D. G.; Stoorvogel, J. J.; Smaling, E. M. A.; Geoderma2012, 183-184, 41.
6. Vohland, M.; Besold, J.; Hill, H.; Frund, H. C.; Geoderma2011,
166, 198.
7. Gao, Y.; Cui, L.; Lei, B.; Zhai, Y.; Shi, T.; Wang, J.; Chen, Y.; He, H.; Wu, G.; Appl. Spectrosc.2014, 68, 712.
8. Shi, T.; Chen, Y.; Liu, H.; Wang, J.; Wu, G.; Appl. Spectrosc. 2014, 68, 831.
9. Nelson, D. W.; Sommers, L. E. In Methods of Soil Analysis, Part 3-Chemical Methods;Sparks, D. L., ed.; American Society of Agronomy-Soil Science Society of America: Madison, USA, 1996, ch. 34.
10. Claessen, M. E. C.; Barreto, W. O.; Paula, J. L.; Duarte, M. N.;
Manual de Métodos de Análise de Solo; Centro Nacional de Pesquisa de Solos-EMBRAPA: Rio de Janeiro, Brasil, 1997. 11. Walkley, A.; Black, I. A.; Soil Sci.1934, 37, 29.
12. Valderrama, P.; Braga, J. W. B.; Poppi, R. J.; Quim. Nova2009,
32, 1278.
13. ASTM: Standards Practices for Infrared, Multivariate, Quantitative Analysis-E1655-05, West Conshohocken: Pennsylvania, USA, 2005.
14. Geladi, P.; Kowalski, B. R.; Anal. Chim. Acta1986, 185, 1. 15. Nawi, N. M.; Chen, G.; Jensen, T.; J. Near Infrared Spectrosc.
2013, 21, 289.
16. Kennard, R. W.; Stone, L. A.; Technometrics1969, 11, 137. 17. Savitzky, A.; Golay, M. J. E.; Anal. Chem.1964, 36, 1627. 18. Martens, H.; Naes, T.; Multivariate Calibration; Wiley: New
York, USA, 1996.
19. Valderrama, P.; Braga, J. W. B.; Poppi, R. J.; J. Agric. Food Chem.2007, 55, 8331.
20. Wijnand, H. P.; van de Velde, R.; Comput. Meth. Prog. Bio. 2000, 63, 21.
21. Valderrama, P.; Braga, J. W. B.; Poppi, R. J.; J. Braz. Chem. Soc.2007, 18, 259.
22. Miller, J.; Miller, J. C.; Statistic and Chemometrics for Analytical Chemistry; Pearson Education: Canada, 2010. 23. http://cbcs2013.hospedagemdesites.ws/anais/arquivos/2726.
pdf accessed in January 2016.
24. Peng, X.; Shi, T.; Song, A.; Chen, Y.; Gao, W.; Remote Sens. 2014, 6, 2699.
25. Valderrama, P.; Romero, A. L.; Imamura, P. M.; Magalhães, I. R. S.; Bonato, P. S.; Poppi, R. J.; Anal. Bioanal. Chem.2010,
397, 181.
26. Kuzmanovski, I.; Aleksovska, S.; Chemom. Intell. Lab. Syst. 2003, 67, 167.
27. Botelho, B. G.; Mendes, B. A. P.; Sena, M. M.; Quim. Nova 2013, 36, 1416.
28. Santos, D. A.; Março, P. H.; Valderrama, P.; BrJAC-Braz. J. Anal. Chem. 2013, 12, 495.
29. Jarque, C. M.; Bera, A. K.; Int. Stat. Rev.1987, 55, 163. 30. Souza, S. V. C.; Junqueira, R. G.; Anal. Chim. Acta2005, 552,
25.
31. Durbin, J.; Watson, G. S.; Biometrika1951, 38, 159. 32. Boqué, R.; Rius, F. X.; Chemom. Intell. Lab. Syst.1996, 32, 11.
Submitted: October 16, 2015