Article
J. Braz. Chem. Soc., Vol. 24, No. 10, 1561-1569, 2013. Printed in Brazil - ©2013 Sociedade Brasileira de Química 0103 - 5053 $6.00+0.00
A
*e-mail: [email protected]
Simultaneous Determination of Chlorpyrifos and Carbaryl by
Spectrophotometry and Boosting Partial Least Squares
Vali Zare-Shahabadi,*,a Fatemeh Abbasitabar,b Morteza Akhondc and Mojtaba Shamsipourd
aYoung researchers club, Mahshahr Branch, Islamic Azad University, Mahshahr, Islamic Republic of Iran
bYoung researchers club, Marvdasht Branch, Islamic Azad University, Marvdasht, Iran
cDepartment of Chemistry, Shiraz University, Shiraz, Iran
dDepartment of Chemistry, Razi University, Kermanshah, Iran
Resíduo de pesticida tem sido uma séria ameaça à saúde humana. Métodos de detecção rápida são necessários para os vários tipos de pesticidas. Este estudo investigou a viabilidade da combinação da espectrofotometria com o método dos mínimos quadrados parciais por boosting (boosting-PLS) para determinação simultânea de clorpirifos e carbaril, dois dos mais importantes pesticidas na agricultura. Estudou-se o efeito do pH sobre os espectros de absorbância de cada componente, sendo pH 5 o ideal. Para construir os modelos boosting-PLS, trinta e seis misturas binárias foram usadas e para validar os modelos resultantes, vinte misturas binárias foram empregadas. Resultados por boosting-PLS foram comparados com aqueles obtidos por full-spectrum PLS e algoritmo PLS acoplado a busca tabu (TS) como ferramenta de seleção de comprimento de onda. Apesar da melhoria pelas abordagens por boosting e seleção de comprimento de onda, a capacidade de previsão do algoritmo PLS, boosting-PLS mostrou-se superior aos demais modelos. Boosting-PLS não só é viável como também pode evitar a seleção de comprimento de onda.
Residue of pesticide has posed a serious threat to human health. Fast detection methods are necessary for the various types of pesticide. This study investigated the feasibility of the combination of spectrophotometry and boosting partial least squares method (boosting-PLS) for the simultaneous determination of chlorpyrifos and carbaryl, two of the most important pesticides in agriculture. Effect of pH on the absorbance spectra of each component was studied and pH 5 was selected as optimum. To build boosting-PLS models, thirty six binary mixtures were used and to validate the resulted models, twenty binary mixtures were employed. Results for boosting-PLS were compared to ones obtained for full-spectrum PLS and PLS algorithm coupled with tabu search (TS) as wavelength selection tool. In spite of the improvement by both boosting and wavelength selection approaches, the prediction ability of PLS algorithm, the boosting-PLS is superior to the other models. Boosting-PLS is not only feasible but also can avoid doing wavelength selection in such a task.
Keywords: chlorpyrifos, carbaryl, partial least squares, tabu search, boosting regression
Introduction
A wide variety of pollutants from industrial, agricultural and other human activities can contaminate aquatic environments. Among environmental pollutants, pesticides are of relevant concern due to their toxicity and prevalence of their use. For example, chlorpyrifos [O,O-diethyl O-(3,5,6-trichloro-2-pyridinyl)
Another widely used pesticide is carbaryl. Carbaryl (1-napthyl methylcarbamate), as a broad spectrum insecticide, is one of the most widely used carbamate insecticides. It is used greatly in agriculture, including home gardens where it generally is applied as a dust. Carbaryl is not considered to be a persistent compound because it is readily hydrolyzed in alkaline medium.4 It is currently registered in the US EPA for controlling beetles and 90 other insects that cause problems in trees and ornamentals.5,6
Although, these pesticides have relatively low persistence in the environment, they have high acute toxicity to human health and ecosystems.7,8 Therefore, the determination of these pesticides is of great interest, forcing different researchers to develop methods to analyze them.
Chromatographic techniques have been the most extensively applied to simultaneous analysis of carbaryl and chlorpyrifos,9-13 although spectrophotometry combined with derivative spectra and with differential kinetic degradation has also been employed.11-15
Spectrophotometry is a relatively easy method for simultaneous determination of variety components. It needs less expensive instrumentation and provides high sensitivity. One of the main drawbacks of the spectrophotometric methods is its poor selectivity due to the high degree of spectral overlapping. Nowadays, quantitative spectrophotometry has been greatly improved by the use of a variety of multivariate statistical methods, particularly the partial least squares regression (PLS).16,17
Multivariate calibration techniques, e.g., PLS, have been devised for the analysis of mixtures with overlapping spectra.18 The great advantage of multivariate calibration approaches is their capability of improving determinations in terms of selectivity.19-23A difficulty when applying PLS in multivariate calibration is that overfitting may occur.24 Moreover, it has been shown that a variable selection in PLS is necessary for obtaining a parsimonious and robust model.25 A variable selection procedure allows the informative part of the spectrum related to the variation of the analyte concentration to be modeled and other parts of the spectrum related to the variation of concentration of other compounds and/or background variations to be discarded. Consequently, in practice, the wavelength selection continues to be the process of interest due to the increase in the prediction capacity. Different strategies for wavelength selection in multivariate calibration models have been proposed in the literature, including the use of ant colony optimization,26-28 tabu search (TS)29 and genetic algorithm (GA).30
Unlike the traditional calibration techniques based on a single model, which sometimes results in unsatisfactory accuracy and robustness, ensemble is based on the concept of building a series of model. For example, in
boosting, samples in the training set are picked out with the probability obtained by the previous model. For a specific sample, if the prediction from the previous model is poor, the probability of the sample will increase so as to be trained more intensively. The final prediction is made by weighted median of the collected numerous models. The main advantage of such ensemble techniques is that they increase the accuracy and robustness of the calibration. Such learning concepts have been introduced into the field of chemometrics and shown that the ensemble model is more robust and less sensitive to overfitting.31-34 Previously, boosting-PLS approach was employed in quantitative structure-activity/property relationships35 and in the determination of some active chemicals in near-IR region.35-40
The aim of the present work was to develop simple, rapid, economical, accurate, precise and reproducible spectrophotometric methods for determination of carbaryl and chlorpyrifos. Due to the advantages of boosting, the combination of boosting-PLS and spectrophotometry for simultaneous determination of these pesticides was investigated. To our knowledge, this work is the first report on application of boosting-PLS for pesticide determination. Two other approaches including full-spectrum PLS and tabu search (TS)-PLS were used for comparison.
Tabu search is a meta-heuristic optimization method
which was used by Hageman et al.29 to solve the
wavelength selection problem. TS process is initiated with a randomly selected solution (i.e., a subset of wavelengths). For each solution, a PLS model is built based on the selected wavelengths and the corresponding root mean squared error (RMSE) is calculated via cross-validation method as:
(1)
where ^x
i is the predicted concentration of interested
component in the ith mixture, x
i is the real concentration, and
m is the number of samples in the training set.
a local optimum, TS uses a tabu list containing solutions or steps which are tabu. In this work, four tabu lists were employed, including select tabu list, deselect tabu list, move to tabu list and move from tabu list. The lengths of all tabu lists were optimized by trial and error.
The original concept of boosting was proposed by Schapire42 and has intensively been developed.43 There are two methods used to establish the boosting regression model. The first one is by forward stage-wise additive modeling, which modifies the target values to effectively fit residuals.35 The second one is by changing sample weights to emphasize those which were poorly regressed on previous stages of the fitting process.38 In this work, the second approach is used. Anyway, at the end of boosting, there is an ensemble with T models at the hand which are used to predict analyte concentration in a test sample. Considering a training set containing m samples, the boosting procedure used in this study consists of the following steps:
Step 1: initially, assign equal weights to each sample in the training data set:
(2)
Step 2: for iterations t = 1, 2, …, T: (i) Calculate probability for each sample:
(3)
(ii) According to probability distribution p, select m' samples (m' < m) from the training set in order to generate a so-called boosting set.
(iii) Develop a PLS model on the basis of the boosting set. Determine the number of latent variables by the cross-validation on the current boosting set.
(iv) Use the developed PLS model to predict the
concentration of the interested analyte in all m' samples. (v) Calculate a square loss for each sample in the boosting set as:
(4)
Here, the denominator represents the maximum residual between all predicted and real concentrations.
(vi) Compute an average loss and from
that a confidence index (CI) for the PLS model:
(5)
This CI is ranging from 0 to 1. Low CI means high confidence in the prediction.
(vii) Update weights of the samples by the following equation:
(6)
Note that the weight-updating scheme implies that, the smaller the loss, the more the weight is reduced. In the other words, the weights of the unsatisfactory predicted samples are increased. This causes to pick up this sample as a member of the next boosting set with higher probability.
(viii) Renormalized w, so that .
(ix) t = t + 1. If t≤T, repeat steps i-viii; otherwise stop. After T iterations, there are T PLS models.
Step 3: the performance of the boosting-PLS is evaluated by a test set. For a sample j of the test set, the final prediction is the combined prediction obtained from the T PLS models as shown in equation 7.
(7)
where s is the normalized inverse of the Mahalanobis distance between a test sample and tth boosting set.
Experimental
Reagents and solutions
All reagents were of analytical reagent grade. Bidistilled water was used throughout. Stock solutions of carbaryl and chlorpyrifos were prepared separately by dissolving 0.05 g of either carbaryl or chlorpyrifos in DMF (dimethylformamide) and diluting to 50 mL with DMF. Working solutions were prepared immediately before use by further dilution of the standard solutions in water.
Citrate buffer (0.15 mol L-1) was prepared and pH was adjusted to pH 5 by using concentrated HCl or NaOH.
Apparatus, software and data processing
Procedure
To find the linear concentration range of each pesticide, one-component calibration was performed. Different volumes of a stock solution of the desired pesticide were injected, by means of a micro-syringe, into a cell that contained 2.0 mL citrate buffer solution (pH 5.0) and the absorbance spectra were recorded over the 250-375 nm spectral range versus a solvent blank. The linear dynamic range for each compound was determined by regressing absorbance at the corresponding λ
maxversus concentration. Two sets of standard solutions are necessary for multivariate calibration. One, called training set, is used to develop model and the other to evaluate the model. In the present study, the training set contained 36 standard solutions and the test set contained 20 standard solutions. Although, the concentrations of the analytes in both data sets were within the linear concentration range of that pesticide, the compositions of the most concentrated solutions were selected so that the absorbance values were not exceeded the highest absorbance reading of the instrument. The composition of the training set was chosen by 6 level full factorial design, whereas the composition of the test set was chosen randomly. To prepare each solution, aliquots of carbaryl or chlorpyrifos solutions containing appropriate amount of these pesticides were added to a series of 10.0 mL volumetric flasks followed by addition of 2 mL of citrate buffer solution (pH 5), diluted to the mark with double distilled water. UV spectra of the mixtures were recorded in the wavelength range of 250-375 nm versus a solvent blank, and digitized absorbance was sampled at 1.0 nm intervals.
Results and Discussion
Spectral characterization of the analytes
The chemical structures of carbaryl and chlorpyrifos are shown in Figure 1. The absorbance spectra of each chemical are shown in Figure 2. As can be seen, carbaryl and chlorpyrifos have highly overlapped spectra. Due to overlapping spectra, mixtures of these chemicals cannot be analyzed by conventional univariate method. Multivariate calibration method such as PLS gives a solution to such problem.
Optimization of the experimental conditions
The experimental conditions for quantitative estimation of both pesticides were optimized via a number of preliminary experiments. The influence of pH on the
spectrum of each compound at a constant concentration was studied separately in the pH range of 1-6 because carbaryl hydrolyzes in neutral and basic solutions.4 Hydrochloric acid and sodium hydroxide were used for the pH adjustment. It was found that the system is almost independent of pH within the range of 1.0-6.0. However, to prevent hydrolysis of both carbaryl and chlorpyrifos, pH 5 was selected as optimum pH value. A solution of 0.15 mol L-1 citrate buffer was used for the adjusting pH.
One-component calibration
To find the linear range of each component, calibration graphs were obtained. The absorption spectra were recorded over 250-375 nm against a solvent blank. For each pesticide, the calibration curve was constructed with several points as absorbances at its λ
max versus sample concentration and the graph was evaluated by linear regression analysis. The calibration curves were linear between 1.60 and 45.0 µg mL-1 for carbaryl and 1.50 and 50.0 µg mL-1 for chlorpyrifos. The characteristic parameters for the regression equations of individual calibration by absorption UV spectra are given in Table 1.
Multivariate calibration
The first step in simultaneous determination of binary mixtures by multivariate calibration methods involves the
Figure 1. Chemical structures of carbaryl and chlorpyrifos.
construction of a training set. In this study, a training set consisting of thirty six binary mixtures according to 6-levels full factorial design was prepared. Calibration models were constructed with the aid of the following chemometrics methods: PLS, TS-PLS and boosting-PLS. The resulted models were validated against a randomly selected test set containing twenty binary mixtures (Figure 3).
To build full-spectrum PLS model, leave-one-out cross-validation (LOO-CV) was used to optimize the number of latent variables (LVs). The LOO procedure is iterative, and, it consists of several steps in each iteration. At each iteration, one sample is leaved out from the training set. A PLS model with predefined number of latent variables (factors) is built based on the remaining samples. Then concentration of the hold-out sample is predicted by the model. This procedure was iteratively run for each sample for each number of factors. The error was expressed as the prediction residual error sum of squares of cross validation (PRESS-CV) which is given by:
(8)
where ^x
i is the predicted concentration of interested
component in ith mixture by the model, x
i is the real
concentration, and m is the number of mixtures in
calibration set.
In boosting-PLS, the two parameters that should be optimized were the ensemble size (the number of boosting cycles) and boosting set size (the number of samples in each boosting set). Again, the number of LVs for each boosting set was determined by the LOO-CV procedure. In TS-PLS, four parameters need to be optimized: the length of the tabu list for the select, deselect, move from and move to operators. These parameters were optimized by trial and error. For each generated solution in TS, the number of LVs was determined by leave-six-out cross validation (L6O-CV) procedure.
Plots of PRESS-CV versus the number of latent
variables for both pesticides are pictured in Figure 4. As may be seen, the optimal number of factors was 2 for both pesticides. The results of full-spectrum PLS are summarized in Tables 2 and 3. As can be seen in Table 3, the RMSE and R2 values for both training and test sets were used as indexes to evaluate performance of the models.
In another trial, tabu search was used to select more informative wavelengths to build PLS model. Figure 5 shows the selected wavelengths in three different runs of TS in the analysis of chlorpyrifos. Note that several wavelengths were selected from last part of the spectra where the absorbance signals are low. In order to evaluate the usefulness of this last part of the spectrum, PLS was applied on the last thirty two wavelengths and the results revealed R2 values equal to 0.985 and 0.972 for training and test sets, respectively. This result clearly demonstrates that this part of the spectrum is informative and also indicates the ability of TS to choose the proper wavelengths.
The results of the analysis for chlorpyrifos and carbaryl by TS-PLS are summarized in Tables 2 and 3. In Table 3, it is obvious that TS-PLS resulted in more accurate models in
Table 1. Parameters of the linear regression equations for each pesticide
Parameter Carbaryl Chlorpyrifos
Sample number 26 17
Linear range / (µg mL-1) 1.60-45.00 1.50-50.00
Intercept −0.0004 0.0033
Slope 0.030 0.044
Correlation coefficient 0.998 0.996
Limit of detection / (µg mL-1) 1.01 0.89
Figure 3. Composition of training and test sets.
Figure 4. Plots of log (PRESS) versus number of latent variables for
Table 2. Composition of the binary mixture samples in the test set and their predicted values by various PLS modelings
Actual value in the test set / (µg mL-1)
Predicted values by
Full-spectrum PLS TS-PLS Boosting-PLS
Cha Caa Ch Ca Ch Ca Ch Ca
14.52 17.81 13.02 16.90 16.50 17.54 14.21 19.21
37.89 5.40 37.60 4.30 37.39 3.87 37.81 5.45
9.76 29.38 8.13 27.59 10.31 28.06 9.80 30.92
25.35 9.44 27.18 7.97 25.94 11.15 26.62 8.88
23.62 3.56 26.54 4.62 25.49 4.32 22.85 4.33
15.70 32.99 12.88 35.66 16.26 34.89 14.72 31.97
6.78 16.68 6.99 16.44 7.75 15.94 6.37 16.09
2.51 30.27 0.04 30.31 2.35 31.71 4.03 29.21
16.93 18.26 18.74 21.15 18.55 19.66 17.34 17.71
8.30 28.83 11.24 31.53 7.06 27.63 9.73 27.94
28.02 2.54 25.42 3.90 27.36 3.56 29.11 2.82
15.08 41.12 17.72 44.03 16.79 42.14 17.05 39.71
32.23 36.34 29.34 38.16 33.62 35.47 33.24 36.62
28.33 33.97 29.43 33.64 27.71 32.56 29.16 33.28
22.39 36.89 24.09 38.18 21.04 35.43 23.42 37.05
8.04 18.24 8.24 17.45 8.19 17.13 9.32 19.60
36.45 28.39 38.76 27.86 36.95 29.58 38.41 27.17
11.26 26.58 13.65 27.96 10.01 26.15 13.11 26.73
35.25 24.60 36.01 25.23 35.04 24.06 35.91 24.12
9.75 13.54 7.57 13.58 9.93 14.86 11.67 13.72
aCh and Ca refer to chlorpyrifos and carbaryl, respectively.
Table 3. Statistical parameters of the different PLS modeling
Component Model RMSEtraining RMSEtest R2
training R2test
Chlorpyrifos
full-spectrum PLS 0.8273 1.8491 0.9958 0.9660
TS-PLS 0.4578 1.0738 0.9987 0.9907
boosting-PLS 0.4526 0.9627 0.9989 0.9928
Carbaryl
full-spectrum PLS 0.9195 1.4138 0.9960 0.9867
TS-PLS 0.5434 1.0791 0.9986 0.9888
boosting-PLS 0.5446 0.7776 0.9975 0.9947
comparison with the case when entire set of data were used without wavelength selection. For TS-PLS, the RMSEtest values in determination of chlorpyrifos and carbaryl were improved by 41.93 and 23.67%, respectively, compared to full-spectrum PLS.
Figure 6 shows the influence of the ensemble size and the number of samples in each boosting set on the predictive power of boosting-PLS in the analysis of chlorpyrifos. As indicated in Figure 6, when the ensemble size is smaller than 18, the R2 value drops especially when the number of samples in each boosting set is lower than 10. Regardless of number of samples, increasing the ensemble size causes the decrease in the fluctuation of the R2 values. The best results obtained when the ensemble size and the number of samples were 35 and 25, respectively.
The predicted concentrations of chemicals in the test set by boosting-PLS are given in Table 2. The statistical
parameters of the resulted boosting-PLS are collected in Table 3. In Table 3, it can be found that the precision of boosting-PLS was superior to full-spectrum PLS and even TS-PLS. The boosting-PLS model performance was improved by 47.94 and 10.35% compared to full-spectrum PLS and TS-PLS, in determination of chlorpyrifos, respectively.
Application
Figure 5. Absorbance spectra of samples in the training set and the selected wavelength in the analysis of chlorpyrifos by TS in three different runs (a-c)
Figure 6. The influence of the ensemble size and number of samples on R2
training of the boosting-PLS model.
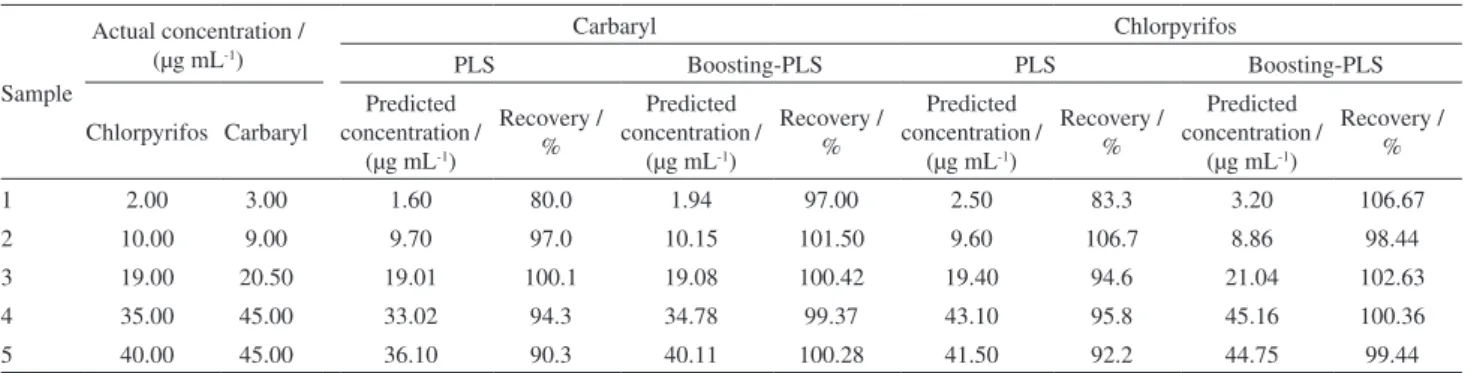
Table 4. Results for the determination of the different concentrations of carbaryl and chlorpyrifos spiked in tap watera
Sample
Actual concentration / (µg mL-1)
Carbaryl Chlorpyrifos
PLS Boosting-PLS PLS Boosting-PLS
Chlorpyrifos Carbaryl
Predicted concentration /
(µg mL-1)
Recovery / %
Predicted concentration /
(µg mL-1)
Recovery / %
Predicted concentration /
(µg mL-1)
Recovery / %
Predicted concentration /
(µg mL-1)
Recovery / %
1 2.00 3.00 1.60 80.0 1.94 97.00 2.50 83.3 3.20 106.67
2 10.00 9.00 9.70 97.0 10.15 101.50 9.60 106.7 8.86 98.44
3 19.00 20.50 19.01 100.1 19.08 100.42 19.40 94.6 21.04 102.63
4 35.00 45.00 33.02 94.3 34.78 99.37 43.10 95.8 45.16 100.36
5 40.00 45.00 36.10 90.3 40.11 100.28 41.50 92.2 44.75 99.44
The good agreement between these obtained results and the actual values indicates the successful applicability of the boosting-PLS approach for the simultaneous determination of carbaryl and chlorpyrifos.
Conclusion
Spectrophotometric methods in conjugation with chemometric tools such as multivariate calibration, e.g., PLS, provided simple analysis methods with high efficiency and low time consumption. These techniques are widely used for quantitative analysis of multicomponent mixtures with overlapping spectra. In this work, three chemometric tools including PLS, tabu search-PLS and boosting-PLS were used in the simultaneously determination of chlorpyrifos and carbaryl. The results revealed that the boosting-PLS approach is the best in terms of several performance measures. It seems that in a sense, using boosting-PLS can avoid doing a wavelength selection before modeling, therefore making a calibration more convenience. However, it is worthy to note that these conclusions are valid only for this data set. So, further investigations have to be made before any general conclusion can be drawn.
Acknowledgment
This work was extracted from a research project entitled “Comparison of various wavelength selection methods in simultaneous determination of carbaryl and chlorpyrifos”. Financial assistance from the Islamic Azad University-Mahshahr Branch is gratefully acknowledged.
References
1. Mostafalou, S.; Abdollahi, M.; Toxicol. Appl. Pharmacol.2013,
268, 157.
2. Hodgson, E.; A Textbook of Modern Toxicology, 3rd ed.; John
Wiley & Sons, Inc.: New Jersey, USA, 2004.
3. Zhang, Y.; Hou, Y.; Chen, F.; Xiao, Z.; Zhang, J.; Hu, X.;
Chemosphere2011, 82, 1109.
4. Zhu, S. H.; Wu, H. L.; Xia, A. L.; Han, Q. J.; Zhang, Y.; Yu, R. Q.; Talanta2008, 74, 1579.
5. Hastings, F. L.; Holsten, E. H.; Shea, P. J.; Werner, R. A.;
Environ. Entomol.2001, 30, 803.
6. Boran, H.; Altinok, I.; Capkin, E.; Tissue Cell2010, 42, 158. 7. United States Environmental Protection Agency (US
EPA); Preliminary Cumulative Risk Assessment of the Organophosphorus Pesticides; US EPA: Washington, DC, USA, 2001.
8. Weichenthal, S.; Moase, C.; Chan, P.; Environ. Health Perspect.
2010, 118, 1117.
9. Rossi, S.; Dalpero, A. P.; Ghini, S.; Colombo, R.; Sabatini, A. G.; Girotti, S.; J. Chromatogr., A2001, 905, 223.
10. Chowdhury, M. A. Z.; Banik, S.; Uddin, B.; Moniruzzaman, M.; Karim, N.; Gan, S. H.; Int. J. Environ. Res. Public Health
2012, 9, 3318.
11. Jiang, Y.; Li, X.; Xu, J.; Pan, C.; Zhang, J.; Niu, W.; Food Addit. Contam.2009, 26, 859.
12. Soleas, G. J.; Yan, J.; Hom, K.; Goldberg, D. M.; J. Chromatogr., A
2000, 882, 205.
13. Ma, X.; Li, C.; Tao, C.; Liu, W.; Zheng, S.; Rapid Commun. Mass Spectrom.2001, 15, 15.
14. Espinosa-Mansilla, A.; Muñoz de la Peña, A.; Salinas, F.; Zamoro, A.; Anal. Chim. Acta1992, 258, 47.
15. Espinosa-Mansilla, A.; Salinas, F.; Zamoro, A.; J. Agric. Food. Chem.1995, 43, 146.
16. Ni, Y.; Chen, J.; Kokot, S.; J. AOAC Int.2011, 94, 1210. 17. Khoshayand, M. R.; Abdollahi, H.; Moeini, A.; Shamsaie, A.;
Ghaffari, A.; Abbasian, S.; Drug Test. Anal.2010, 2, 430. 18. Shariati-Rad, M.; Hasani, M.; J. Chemom.2010, 24, 45. 19. Moradi, R.; Jameh-Bozorghi, S.; Niazi, A.; APCBEE Procedia
2012, 3, 65.
20. Ghasemi, J.; Niazi, A.; Talanta2005, 65, 1168.
21. Abbaspour, A.; Mirzajani, R.; Spectrochim. Acta, Part A2006,
64, 646.
22. Hemmateenejad, B.; Abbaspour, A.; Maghami, H.; Miri, R.; Panjehshahin, M. R.; Anal. Chim. Acta2006, 575, 290. 23. Niazi, A.; Yazdanipour, A.; J. Hazard. Mater. 2007, 146,
421.
24. Zhang, M. H.; Xu, Q. S.; Massart, D. L.; Anal. Chim. Acta2004,
504, 279.
25. Ghasemi, J.; Niazi, A.; Ghobadi, S.; J. Chin. Chem. Soc.2005,
52, 1049.
26. Abbasitabar, F.; Zare-Shahabadi, V.; SAR QSAR Environ. Res.
2011, 23, 1.
27. Zare-Shahabadi, V.; Abbasitabar, F.; J. Comput. Chem.2010,
31, 2354.
28. Shamsipur, M.; Zare-Shahabadi, V.; Hemmateenejad, B.; Akhond, M.; Anal. Chim. Acta2009, 646, 39.
29. Hageman, J. A.; Streppel, M.; Wehrens, R.; Buydens, L. M. C.;
J. Chemom.2003, 17, 427.
30. Devos, O.; Duponchel, L.; Chemom. Intell. Lab. Syst.2011,
107, 50.
31. Mevik, B.-H.; Segtnan, V. H.; Næs, T.; J. Chemom.2004, 18, 498.
32. Galvão, R. K. H.; Araújo, M. C. U.; Martins, M. D. N.; José, G. E.; Pontes, M. J. C.; Silva, E. C.; Saldanha, T. C. B.; Chemom. Intell. Lab. Syst.2006, 81, 60.
33. Shinzawa, H.; Jiang, J.-H.; Ritthiruangdej, P.; Ozaki, Y.;
J. Chemom.2006, 20, 436.
35. Zhang, M. H.; Xu, Q. S.; Massart, D. L.; Anal. Chem.2005,
77, 1423.
36. Shao, X.; Bian, X.; Cai, W.; Anal. Chim. Acta2010, 666, 32. 37. Shinzawa, H.; Jiang, J. H.; Ritthiruangdej, P.; Ozaki, Y.;
J. Chemom.2006, 20, 436.
38. Tan, C.; Wang, J.; Wu, T.; Qin, X.; Li, M.; Vib. Spectrosc.2010,
54, 35.
39. Yan-Kun, L.; Anal. Methods2012, 4, 254.
40. Zhang, Q.; Li, Q.; Zhang, G.; Anal. Methods2012, 4, 2039.
41. Shamsipur, M.; Zare-Shahabadi, V.; Hemmateenejad, B.; Akhond, M.; QSAR Comb. Sci.2009, 28, 1263.
42. Schapire, R. E.; Machine Learning1990, 5, 197.
43. Freund, Y.; Schapire, R. E.; J. Comput. System Sci.1997, 55, 119.