Brazilian Journal of Physics, vol. 34, no. 2A, June, 2004 425
Numerical Simulation of the Kinetics of the Selective Catalytic
Reduction of NO by NH
3
J. P. Bodanese and M. Santos
Centro de Ensino de S˜ao Jos´e, Universidade do Vale do Itaja´ı, 88.122-000, S˜ao Jos´e, SC, Brazil
Received on 5 September, 2003
In this work we study a model of a catalytic reaction among three monomers in order to understand the kinetics of the selective catalytic reduction of NO by ammonia (4NO + 4NH3+ O2→4N2+ 6H2O). Our model takes
into account the formation of the intermediate species in the global scheme of the reaction. Using the Monte Carlo method we simulated the model on a square lattice and determined its phase diagram.
1
Introduction
In the last years, severe regulations have been imposed in order to control the emissions of the nitrogen oxides from mobile and stationary sources, of these types of molecules. The principal argument to decrease the emission of nitrogen oxides is based upon the fact that these molecules have a hazardous effect on the health of the people as well as the environment [1,2]. In general, the studies to lower the emis-sions of nitrogen oxides only consider reduction of nitrogen monoxide, because it accounts for approximately95%of all emitted oxides. However, as the decomposition of NO into N2 and O2 is thermodynamically unstable [2], the use of a catalyst is necessary to facilitate and accelerate the reac-tion. In this reaction, a molecule of nitrogen monoxide is ad-sorbed on a catalytic surface and it dissociates into O and N atoms. Then two N(O) atoms combine to form N2(O2). Dif-ferent types of catalysts have been used to decompose nitro-gen monoxide, but all can be classified in three groups: no-ble metals, metallic oxides and zeolites [3]. Unfortunately, any of these catalysts is poisoned by oxygen atoms over a wide range of temperatures. An alternative to prevent the emission of nitrogen monoxides is the selective catalytic re-duction (SCR) of these molecules by ammonia [2,4,5], no-tably when the gases are emitted by stationary sources. In this de-pollution process, NH3 is used as a reducing agent to produce water and gaseous nitrogen. However, if oxy-gen is also added to the gaseous mixture that is adsorbed in the catalytic surface, conversion to N2 and H2O is en-hanced [1]. Experimental and theoretical studies have been used in order to determine the kinetics of the reduction of nitrogen monoxide by ammonia on catalytic surfaces [6-8]. In both cases, there are some controversies, relative to the mechanism by which the NO molecules are decomposed. In order to provide information about the mechanisms con-cerned in the kinetics of the selective catalytic reduction of nitrogen monoxide by NH3, we have studied, through Monte Carlo simulations [9,10], some possible paths for the over-all reaction that occurs on the catalytic surface. Our
ap-proach is based on the Ziff, Gulari and Barshad model (ZGB model)[11] for the irreversible oxidation of carbon monox-ide on a catalytic surface. Besmonox-ides, as the gaseous reservoir contain three types of molecules (O2, NH3 and NO), we also used the ideas proposed by Schmidt and Santos [12] to study the poisoning of a catalytic surface when a third non-reactive monomer is present in the gaseous reservoir.
Our paper is organized as follows: in section II we present some possible paths for the reduction of NO by NH3 in presence of O2 as well as numerical results obtained in each case. In addition, we describe some details of the sim-ulations. As we will see, a small modification in the reaction mechanism changes completely the dynamical behavior of the model. Finally, in section III, we address our main con-clusions.
2
Models and numerical results
The process in which ammonia NH3 is used to de-compose nitrogen monoxide NO, on a catalytic surface to produce N2and water is called by selective catalytic reduc-tion (SCR). The overall reacreduc-tion for the reducreduc-tion of NO in the presence of oxygen and ammonia is given by [3,9]
4N O+ 4N H3+O2→4N2+ 6H2O . (1) The first problem that appears in the study of this re-action is related to the mechanism that control the rere-action scheme. In fact, several kinetic studies have been reported where the rate equations for this reaction is based on ei-ther the Eley-Rideal (ER)[13,14] or Langmuir-Hinshelwood (LH)[15,16] mechanisms. More recently, in an extensive review about the current state of research on NOx
426 J. P. Bodanese and M. Santos
NHg3 + E → NHa3 ,
NOg + NHa
3 → N
g
2 + H2Og + Ha ,
where the indexaindicates that the molecules are adsorbed on the surface,gthat the molecules are in the gas-phase andE indicates an empty site. On the other hand, for the LH mechanism, the particles of nitrogen monoxide must also be adsorbed on the catalytic surface to react with ammonia. In this case we have
NHg3 + E → NHa3 ,
NOg + E → NOa ,
NOa + NHa
3 → N
g
2 + H2Og + Ha .
⌈
We observe that, in both reaction schemes, the catalytic surface is poisoned by the intermediate species H. To regen-erate the surface, the oxygen gas is added to the gaseous reservoir, and two new reactions can occur on the catalytic surface
Og2 + 2E → 2O
a
,
Oa + 2Ha →
H2Og + 2E .
This last reaction occurs by two steps
Oa + Ha → OHa + E ,
OHa + Ha → H
2Og + E .
Here, we note the presence of other intermediate species. We assume that the reactions among the adsorbed species are instantaneous, and that the rates of collisions of the gaseous oxygen, nitrogen monoxide and ammonia with the catalytic surface, here denoted byYO,YNO, andYNH3,
re-spectively, depend on their mole fractions in the gas phase. They are related by
YO+YN O+YN H3 = 1. (2)
In order to perform Monte Carlo simulations for the two mechanisms (ER and LH) we use a square lattice of linear sizeLwith periodic boundary conditions. The unit of time in the simulations is the Monte Carlo step (MCs), in which N =L2
adsorption steps occur. We start our simulation for the ER mechanism with an empty lattice, for fixed values ofYNH3 andYNO. At random, we choose a site on the
cat-alytic surface and a particle (NO, NH3, or O2) to react on it. If NO is chosen, and the site is occupied by ammonia, the two molecules react to yield the intermediate species H on that site. After this, we scan its neighborhood in order to verify the possible reactions of H with OH and O, respec-tively. Otherwise, if the chosen site is empty or occupied by any other species, the trial ends. If the chosen particle is am-monia the simulation proceeds as follows: first we verify if
the site is empty or occupied. If it is occupied, the trial ends again, but if it is empty, the NH3particle is immediately ad-sorbed. As the molecule of ammonia does not react, we pass to the next trial of adsorption. Now, if the chosen particle to hit on the catalytic surface is O2, and if the chosen site is occupied, we stop the adsorption step. On the other hand, if it is empty, the following procedure is adopted: we check the neighborhood of the chosen site. If one of the four first neighbor sites is empty, this site, and the chosen one, are oc-cupied by the two oxygen atoms. If there are two or more first neighbor sites that are empty, the adsorption site is ran-domly chosen. After the adsorption, we scan the neighbor-hood of the two oxygen atoms in order to see the possible reactions ofOwith H to yield OH. After this, we chek the possibility that the last molecule reacts, in its neighborhood, with anotherHto yield a water molecule.
Following the procedure outlined above, we performed Monte Carlo simulations for L = 256 and for fixed val-ues of the collision rates. We find that the densities of the various types of molecules on the surface reach a stationary state. Moreover, these values depend on the values of the collision rates. For instance, in Fig. 1, we plot the density of empty sites and also the coverages of the other species ver-sus the normalized collision rate of theN O molecules for YNH3 = 0.3. Ymax = 1.0−YNH3 is the maximum value
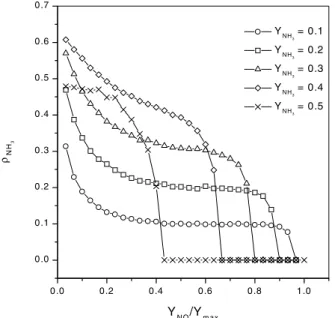
assumed byYNO(in this caseYmax= 0.7). As we can see, all the types of molecules can coexist on the surface depend-ing on the value of the collision rates. After a critical value of this parameter, the catalytic surface is poisoned and the only species remaining on the surface is H. In addition, for values ofYNO/Ymaxsmaller than the critical one, the den-sity of empty sites is different from zero, characterizing an active phase for this catalytic model. However, this quan-tity can not be used to characterize the transition between the active and inactive phases. In fact, while the density of ammonia on the catalytic surface is different from zero, it is possible to produce N2 and H2O. Therefore, we use the density of ammonia as the relevant parameter to character-ize the transition between the active and inactive phases. In Fig. 2 we show how the density of ammonia changes with YNO/Ymaxfor some values ofYNH3. We note that
Brazilian Journal of Physics, vol. 34, no. 2A, June, 2004 427
to
0.0 0.2 0.4 0.6 0.8 1.0
0.0 0.2 0.4 0.6 0.8 1.0
ρV
ρO
ρH
ρNH3
ρO H
sur
face densi
ty
YN O/Ym ax
Figure 1. Plot of the stationary value of the surface density versus the normalized collision rate of nitrogen monoxide forYNH3= 0.3
andL= 256. Ymaxis the maximum value ofYNOfor each value
ofYN H3. The maximum occurs whenYO = 0.0and, in this case,
Ymax= 0.7.
0.0 0.2 0.4 0.6 0.8 1.0
0.0 0.1 0.2 0.3 0.4 0.5 0.6 0.7
YNH3 = 0.1
YNH3 = 0.2
YNH
3
= 0.3
YNH
3
= 0.4
YNH
3 = 0.5
ρ
NH
3
YN O/Ym ax
Figure 2. Plot of the stationary value of the density of ammonia as a function of the normalized collision rate of nitrogen monoxide
forL= 256and various values ofYNH
3.
the decrease of the critical value YNO/Ymax at which the transition occurs. The phase transition is continuous for any values ofYNO andYNH3. Taking all these results we can
construct the phase diagram for the model of the SCR of N O by ammonia when the kinetics of the reaction is gov-erned by the ER mechanism. In Fig. 3, we show the phase diagram for this model. As we can see, it contains a set of points separating an active phase from an inactive one. A fi-nal result for this model is related to the production of the N2
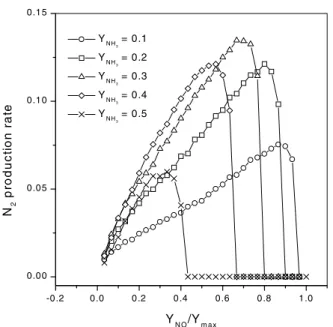
and H2O gases. As we can see in Fig. 4, the production rates of these gases, in the stationary regime, exhibit a maximum value as a function ofYNO/Ymax. As we expected from the kinetics of the reaction, the quantity of water produced is larger than the production of N2. A maximum value of this production rate also depends on the collision rate of ammo-nia, as shown in Fig. 5, in which we plot the N2production rate versusYNO/Ymaxfor some values ofYNH3.
0.1 0.2 0.3 0.4 0.5 0.6
0.0 0.2 0.4 0.6 0.8 1.0
inactive
active
YNO
/Y
ma
x
YN H
3
Figure 3. Phase diagram in the plane normalized adsorption rate of nitrogen monoxide versusYNH3. The points indicate the phase
transition between the active and inactive phases. The line is a guide to eyes.
0.0 0.2 0.4 0.6 0.8 1.0
0.0 0.1 0.2 0.3
N2
H2O
pr
oduct
ion r
a
te
YN O/Ym ax
Figure 4. Plots of the production rates of the N2and H2O gases, in
the stationary regime, as a function ofYNO/YmaxforYNH3= 0.3
428 J. P. Bodanese and M. Santos
-0.2 0.0 0.2 0.4 0.6 0.8 1.0 0.00
0.05 0.10 0.15
YNH
3 = 0.1
YNH3 = 0.2
YNH
3
= 0.3
YNH
3
= 0.4
YNH
3
= 0.5
N2
pr
oduct
ion r
a
te
YN O/Ym ax
Figure 5. Plot of the stationary value of the production rate of N2
as a function of the normalized collision rate of nitrogen monoxide
forL= 256and various values ofYNH3.
We now turn our attention to study the model when the LH mechanism defines the kinetics of the overall reaction of the SCR of nitrogen monoxide by ammonia. According to the kinetics above mentioned, we have simulated the model as follows. First we choose, at random, the particle to be ad-sorbed as well as the site where the adsorption step occurs. If the chosen site is occupied, the trial ends. Otherwise, the chosen particle is adsorbed. If the chosen particle to be ad-sorbed is the oxygen gas, an additional first neighbor site, also empty, is needed. In this case, the O2molecule dissoci-ates on these two sites of the catalytic surface. After the ad-sorption, we scan the neighborhood of the adsorbed species in order to see the possible reactions. Then, according to this algorithm, we perform Monte Carlo simulations on the square lattice of linear size LxLwithL = 256. Surpris-ingly, we observed that the stationary states of this model are always poisoned for any values of the collision rates of the molecules NO, NH3and O2. Besides, all the species that can be on the catalytic surface can coexist on the surface in the poisoned regime. Thus, despite the great similarity between the two reaction schemes, we find a very different dynamical behavior for the densities on the catalytic surface. To avoid the poisoning of the catalytic surface we changed the reac-tion scheme of the LH mechanism to include dissociareac-tion of both ammonia and nitrogen monoxide but, unfortunately, the inactive stationary state is always reached.
3
Conclusions
We have studied two heterogenous catalytic reaction mod-els among three monomers on a square lattice in order to understand the kinetics of the selective catalytic reduction of NO by ammonia. Using Monte Carlo simulations we have shown that, while the Eley-Riedel mechanism provides an active regime for the system, the Langmuir-Hinshelwood mechanism always leaves the surface completely poisoned for any values of the collision rates.
Acknowledgements
The authors acknowledge the Brazilian agencies FUNCITEC and CNPq by the financial support for this work. W. Figueiredo is thanked for critical reading of the manuscript.
References
[1] M. Chiron, Stud. Surf. Sci. Catal.30, 1 (1987).
[2] H. Bosch and F. Janssen, Catal. Today2, 369 (1988).
[3] A. Fritz and V. Pitchon, Appl. Catal. B13, 1 (1997).
[4] F. Nakashjima and I. Hamada, Catal. Today29, 109 (1996).
[5] P. Forzatti and L. Lietti, Heter. Chem. Rev.3, 33 (1996).
[6] F. Janssen, F. van den Kerkhof, H. Bosch, and T. J. R. Ross, J. Phys. Chem.91, 5921 (1987).
[7] V. Tufano and M. Turco, Appl. Catal. B2, 9 (1993).
[8] W. S. Kijlstra, D. S. Brands, E. K. Poels, and A. Bliek, Catal. Today50, 133 (1999).
[9] P. Forzatti, Catal. Today,62, 51 (2000).
[10] D. P. Landau and K. Binder,A guide to Monte Carlo Simu-lations in Statistical Physics.Cambridge, Cambridge Univer-sity Press (2000).
[11] R. M. Ziff, E. Gulari, and Y. Barshad, Phys. Rev. Lett.56, 2553 (1986).
[12] D. H. Schmidt and M. Santos, Phys. Stat. Sol. (a)187, 305 (2001).
[13] C. U. I. Odenbrand, A. Bahamonde, P. Avilla, and J. Blanco, Appl. Catal. B5, 117 (1994).
[14] J. A. Dumesic, N. -Y. Topsøe, H. Topsøe, Y. Chen, and T. Slabiak, J. Catal.163, 409, (1996).
[15] H. -G. Lintz and T. Turek, Appl. Catal. A85, 13 (1992).