Haplotype diversity of 17 Y-str loci in an admixed population
from the Brazilian Amazon
Pablo Abdon da Costa Francez
1,2, Luiz Patrick Vidal Ramos
3, Teresinha de Jesus Brabo Ferreira Palha
2,4and Sidney Emanuel Batista dos Santos
21
Laboratório de Genética Forense, Departamento de Laboratórios Forenses, Polícia Científica do Amapá,
Macapá, AP, Brazil.
2
Laboratório de Genética Humana e Médica, Instituto de Ciências Biológicas,
Universidade Federal do Pará, Belém, PA, Brazil.
3Faculdade SEAMA, Macapá, AP, Brazil.
4
Centro de Perícias Científicas Renato Chaves, Belém, PA, Brazil.
Abstract
The allelic and haplotype frequencies of 17 Y-STR loci most commonly used in forensic testing were estimated in a sample of 138 unrelated healthy males from Macapá, in the northern Amazon region of Brazil. The average gene di-versity was 0.6554±0.3315. 134 haplotypes of the 17 loci were observed, 130 of them unique and four present in two individuals each. The haplotype diversity index was 0.9996 + 0.0009, with the most frequent haplogroups being R1b (52.2%), E1b1b (11.6%), J2 (10.1%) and Q (7.2%). Most haplogroups of this population belonged to European male lineages (89.2%), followed by Amerindian (7.2%) and African (3.6%) lineages.
Key words:Amazon population, forensic genetics, haplogroups, Y-haplotypes, Y-STR.
Received: April 4, 2011; Accepted: September 20, 2011.
Since the beginning of the colonization of Brazil by the Portuguese, miscegenation has always been the rule, initially involving Native Americans and, later, Africans. However, the dynamics of mixing varies according to the region analyzed. Some studies have shown a higher Euro-pean contribution in southern Brazil, an important African presence in northeastern Brazil and a substantial contribu-tion from Native Americans in the northern region (Sal-zano, 2004; Francezet al., 2011).
An important aspect of this miscegenation is that the colonization of Brazil initially involved only men; the im-migration of European women during the initial centuries of colonization was insignificant. Thus, almost all of the 500,000 Portuguese that came to Brazil during the period 1500-1800 were men. Until the arrival of African slaves of both genders (about 4 million individuals, predominantly males) during the 16th to 19th centuries, the vast majority of the first Brazilians arose from matings between Euro-pean males and Amerindian females (Curtin, 1969; Ri-beiro, 1995).
The mixture between Europeans and Native Ameri-cans from the Amazon region started soon after the arrival of the first European colonizers. After settling in the new territory, the Europeans began using the indigenous labor force in their exploration and occupation of the Amazon re-gion. During the 17th century, there was a reduction in in-digenous slave labor and, from the mid-18th century on, Africans were introduced as slave labor, and represented the third wave of migration into the region (Cunha, 1995). The lack of recombination between Y-chromosome-specific markers means that these markers are transmitted as haplotypes in the same way as single locus alleles. The lower effective number of Y-chromosomes in a given pop-ulation also means that Y-haplotypes/haplogroups tend to show a higher proportion of variation between populations than observed for other markers located on autosomes or X chromosomes (Domingueset al., 2007).
Y chromosome single tandem repeat (Y-STR) analy-sis can be very useful in paternity tests in which the alleged father is missing or deceased. In these cases, reference indi-viduals from the same patrilineage can be analyzed. Y-STR analysis is also very useful in analyzing body fluid samples from criminal cases. By typing Y markers, even a minor male DNA component in a mixed male/female stain from a sexual assault can yield a male-specific profile that can be compared with the DNA of suspects (Betzet al., 2001).
Genetics and Molecular Biology, 35, 1, 45-52 (2012)
Copyright © 2012, Sociedade Brasileira de Genética. Printed in Brazil www.sbg.org.br
Send correspondence to Pablo A.C. Francez. Laboratório de Ge-nética Humana e Médica, Instituto de Ciências Biológicas, Cidade Universitária Prof. José da Silveira Neto, Rua Augusto Corrêa 1, Guamá 8615, 66.075-970 Belém, PA, Brazil. E-mail: pabdon@uol.com.br.
The aim of this study was to type 17 Y-STR loci in or-der to establish a Y-STR haplotype database for the Ma-capá population and to use haplogroup predictor software to estimate the most common haplogroups in this popula-tion.
After obtaining signed informed consent from all study participants, peripheral blood samples were collected from 138 unrelated healthy males (mean age 39, range 19-69 years) seen for routine examination at the UNILAB Clinical Analysis Laboratory in Macapá (0°02’20” N; 51°03’59” W) in the northern Brazilian State of Amapá. This study was approved by the SEAMA College Research Ethics Committee (REC Resolution no. 023/2007).
Traditionally, Y-chromosome haplogroups have been defined based on their SNPs, but it is now possible to define them using a specific software for STR haplotypes. This ap-proach allows comparison of the haplotype frequencies ob-tained using different sets of markers. In this study, with the exception of one population of 247 individuals from the State of Alagoas in northeastern Brazil for which the Y haplogroup was defined directly by SNPs (Azevedoet al., 2009), the haplogroups of the other populations were esti-mated based on their STR haplotypes using Haplogroup Predictor software. For this estimation, we used the STR haplotypes of the Macapá population (current study) and the three main parental ethnic groups that formed the Bra-zilian population: Africans - 166 individuals from Angola (Meloet al., 2010), Europeans - 175 individuals from Por-tugal (Ponteset al., 2007) and Native Americans - 221 indi-viduals from indigenous tribes in the Brazilian Amazon region (Palhaet al., 2010).
We also compared the Y haplogroup frequencies esti-mated from the STR haplotypes of 255 individuals from the State of Rio Grande do Sul in southern Brazil (Schwengber et al., 2009), 200 individuals from the State of São Paulo in southeastern Brazil (Góis et al., 2007), 200 individuals from the city of Belém in the State of Pará, northern Brazil (Palha et al., 2007) and 48 individuals from the city of Brasília, Federal District in central-western Brazil (Gratta-pagliaet al., 2005).
DNA was extracted from peripheral blood mono-nuclear cells using the phenol-chloroform procedure (Sam-brooket al., 1989) and was quantified spectrophotometri-cally (NANODROP 1000 spectrophotometer, Thermo Scientific, Wilmington, DE, USA). Polymerase chain reac-tions (PCR) were done with 1-2 ng of template DNA using commercial kits, according to the manufacturer’s instruc-tions (AmpFLSTR®Y-filer PCR amplification kit, Applied
Biosystems).
Electrophoresis and typing were done in an ABI 3130 Avant Automated Sequencer (Applied Biosystems, Foster City, CA, USA). Data acquisition was done with ABI PRISM 3130 - Avant Data Collection v2.0 software (Ap-plied Biosystems) and profile analysis was done with GeneMapper ID v3.2 software (Applied Biosystems).
Typing quality and allele designation were validated by si-multaneous electrophoretic analysis of a control sample of known size. Allele designations were ascribed using an ABIGS LIZ-500 reference ladder (Applied Biosystems) as a molecular size marker.
Allele frequencies were calculated using the gene counting method. Gene and haplotype diversities were as-sessed using Arlequin Version 2.0 software. The Y haplo-groups were estimated from haplotypes using Haplogroup Predictor software.
The average gene diversity at the 17 loci was 0.6554±0.3315. 134 haplotypes were observed for the l7 loci, 130 of which were unique and four (h1, h8, h16 and h72) were present in two individuals each (Table 1). Haplo-type diversity was 0.9996±0.0009. The haplotypes were deposited in the Y-chromosome haplotype reference data-base (YHRD) under accession number YA003689 and the population sample was identified as “Macapá, Brazil [Ad-mixed Brazilian]”. Table 2 shows the allelic frequency dis-tribution for each locus.
The predominant haplogroup in the Macapá popula-tion was R1b (52.2%), followed by haplogroups E1b1b (11.6%), J2 (10.1%) and Q (7.2%). These results demon-strate the important European contribution, especially from the Iberian Peninsula, in the formation of urban populations in northern Brazil. The percentage of individuals with haplogroup Q was higher than in other Brazilian popula-tions, indicating the important contribution of Amerindian males in the genetic makeup of this Amazonian population.
Haplogroup E1b1a, which is very prevalent in Saharan African populations, was found in 3.6% of the sub-jects in this study; although this percentage was smaller than in other regions of Brazil, it nevertheless highlighted the contribution of individuals from this African region to the formation of admixed populations in northern Brazil. Most males in the Macapá population were primarily from European male lineage halogroups (89.2%), followed by Native American (7.2%) and African (3.6%) haplogroups (Table 3).
When the 134 haplotypes were used to search the YHRD, which includes 30,300 haplotypes (including those of 17 Y-STR) in 209 populations, we found that 18 haplo-types had matches. Eight matches were exclusively with populations from Europe (h4, h5, h16, h33, h44, h53, h88 and h91), five matches were exclusively with admixed pop-ulations from America (h36, h50, h61, h64 and h133) and one match was exclusively with African populations (h63). Two haplotypes showed simultaneous matches with Euro-pean and admixed populations from America (h39, h127) and two haplotypes showed simultaneous matches with populations from Europe, Africa and America (h7 and h41). Haplotype h39 had the highest number of matches in the YHRD and was observed in seven of 81 Eurasian popu-lations and three of 34 admixed popupopu-lations from America, with most of the populations being of Basque origin. The
Y-STR
haplotype
diversity
in
a
Macapá
population
47
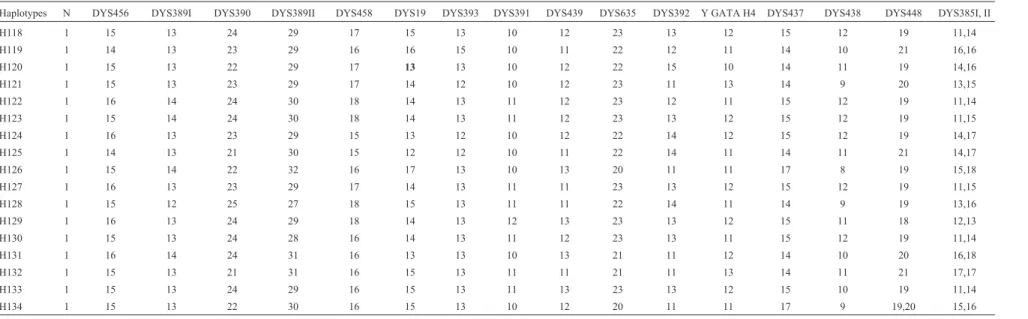
Table 1- Y-chromosome haplotype distribution in a sample of 138 male from Macapá, based on the 17-STR AmpF®STR1 Yfiler kit.
Haplotypes N DYS456 DYS389I DYS390 DYS389II DYS458 DYS19 DYS393 DYS391 DYS439 DYS635 DYS392 Y GATA H4 DYS437 DYS438 DYS448 DYS385I, II
H1 2 16 13 25 29 17 14 13 10 11 24 13 12 15 12 19 10,14
H2 1 15 13 24 29 17 14 13 11 13 23 13 12 14 12 19 12,14
H3 1 16 12 24 28 19 16 13 11 12 23 13 12 15 12 19 11,15
H4 1 16 13 24 29 18 14 13 11 12 23 13 12 15 12 19 11,13
H5 1 16 13 24 29 17 14 14 11 12 24 13 12 15 11 19 11,14
H6 1 15 14 25 30 17 12 13 10 12 22 15 11 14 11 20 15,19
H7 1 15 13 24 29 17 14 13 11 11 23 13 12 15 12 19 11,14
H8 2 16 13 24 29 18 14 13 11 12 23 13 12 15 12 19 12,14
H9 1 16 13 23 29 19 14 13 11 12 23 13 12 15 12 19 11,13
H10 1 16 14 23 30 18 13 13 9 10 21 11 12 14 10 20 13,14
H11 1 16 14 24 30 17 14 14 11 12 23 13 12 15 12 19 11,13
H12 1 15 14 23 30 15 14 12 10 11 24 14 11 16 10 20 16,17
H13 1 16 13 24 29 16 15 12 11 13 21 12 11 15 9 21 15,18
H14 1 14 13 22 29 16 15 13 10 11 21 11 11 16 10 20 13,14
H15 1 13 14 23 32 15 15 14 10 12 21 12 12 14 10 20 14,16
H16 2 16 13 24 30 16 14 13 11 12 23 13 12 15 12 19 11,14
H17 1 17 13 24 30 16 15 12 11 13 23 13 11 15 12 18 11,14
H18 1 15 13 23 29 16 14 13 11 12 23 13 11 15 12 18 11,15
H19 1 14 14 24 31 16 14 14 10 12 22 13 12 14 11 19 15,15
H20 1 15 14 24 30 18 13 13 9 10 21 11 12 15 10 18 13,14
H21 1 15 13 23 29 16 14 13 10 11 23 13 11 15 12 19 14,14
H22 1 15 13 26 29 17 14 13 11 12 23 13 11 15 12 18 11,13
H23 1 14 13 24 31 16 13 14 11 11 23 14 12 14 10 20 14,16
H24 1 16 13 24 29 18 14 13 9 10 21 11 12 14 10 19 14,14
H25 1 16 14 24 31 17 14 13 11 11 23 13 12 15 12 19 11,14
H26 1 13 12 24 28 17 15 12 10 11 21 11 11 16 9 19 14,17
H27 1 16 14 24 30 17 14 14 10 12 23 13 11 14 12 19 11,13
H28 1 17 13 23 30 18 14 13 11 12 23 13 12 15 12 19 11,14
H29 1 16 11 24 27 17 14 13 10 13 24 14 12 15 12 19 11,15
H30 1 14 12 23 29 14 13 13 10 10 21 11 11 14 10 20 17,17
H31 1 17 13 23 30 17 14 13 10 11 24 11 13 15 9 19 13,15
H32 1 16 14 24 29 16 15 13 10 11 23 13 12 15 12 17 11,14
H33 1 15 13 24 29 18 14 13 11 12 23 13 12 15 12 19 11,15
H34 1 19 13 23 29 18 14 13 11 12 23 13 11 15 12 19 11,15
H35 1 17 13 23 31 14 13 13 11 13 22 14 10 14 12 18 15,18
H36 1 17 13 23 30 15 13 13 11 11 21 11 12 14 10 20 15,18
H37 1 15 13 24 29 15 15 12 10 12 21 11 11 15 9 23 13,18
H38 1 16 13 24 29 18 13 13 9 10 21 11 12 15 10 20 13,13
48
Francez
et
al.
Haplotypes N DYS456 DYS389I DYS390 DYS389II DYS458 DYS19 DYS393 DYS391 DYS439 DYS635 DYS392 Y GATA H4 DYS437 DYS438 DYS448 DYS385I, II
H40 1 15 13 24 29 17 14 12 10 13 23 13 11 15 12 20 11,14
H41 1 15 14 24 30 17 14 13 10 12 23 13 11 14 12 18 11,14
H42 1 15 13 23 32 20 14 12 10 11 20 11 12 14 10 20 13,17
H43 1 15 12 23 30 16 14 13 10 12 22 14 12 14 11 20 13,18
H44 1 14 13 23 29 19 15 13 10 13 21 11 11 14 10 18 12,15
H45 1 15 13 25 29 17 14 13 11 12 24 14 12 15 12 19 11,15
H46 1 15 12 23 29 17 15 14 10 14 20 11 12 16 10 21 14,14
H47 1 17 12 22 28 15 14 13 10 13 21 11 11 16 10 20 13,14
H48 1 16 14 25 30 16 14 12 11 12 23 13 12 15 12 20 11,14
H49 1 14 14 22 30 18 14 13 11 12 23 13 12 15 10 19 10,14
H50 1 16 13 24 31 18 14 13 11 12 23 13 12 15 12 19 11,15
H51 1 15 13 23 29 14 15 12 10 10 22 11 11 14 9 20 13,17
H52 1 16 13 24 29 14 15 12 9 12 22 11 12 14 9 20 14,16
H53 1 15 13 24 29 17 15 13 11 12 23 13 12 15 12 19 11,14
H54 1 14 13 23 28 16 17 13 10 11 22 11 12 15 10 21 12,13
H55 1 16 13 24 29 18 13 13 9 10 22 11 13 14 10 19 13,14
H56 1 15 12 25 30 14 14 11 9 12 19 13 10 15 12 20 11,14
H57 1 15 14 23 31 15 13 14 10 12 22 13 10 14 10 19 13,16
H58 1 17 13 24 30 15 14 13 10 12 22 11 13 14 10 20 17,17
H59 1 15 13 23 29 17 14 13 11 11 23 13 13 14 12 19 11,14
H60 1 17 13 24 30 16 13 14 10 12 22 10 12 14 10 20 16,18
H61 1 14 12 23 29 15 14 13 10 12 22 11 11 16 10 21 14,14
H62 1 15 13 24 29 18 14 13 11 12 24 12 12 15 11 19 11,14
H63 1 16 13 23 28 17 14 13 10 11 23 13 12 15 R 19 11,14
H64 1 16 13 23 30 16 13 14 10 11 20 11 11 14 10 21 16,16
H65 1 16 13 22 29 16 14 12 10 11 21 11 11 14 9 20 13,15
H66 1 14 12 23 28 19 14 8 11 12 23 13 12 15 12 20 11,14
H67 1 15 11 24 27 19 13 12 10 11 22 11 10 14 10 20 12,17
H68 1 15 14 22 31 14 13 13 10 11 23 14 11 14 11 20 15,17
H69 1 15 14 23 30 17 15 13 10 12 23 13 13 15 11 19 12,14
H70 1 17 13 24 29 17 14 13 11 12 23 13 11 15 13 19 11,13
H71 1 15 12 22 28 14 15 13 10 13 22 11 11 16 10 20 13,14
H72 2 16 12 23 29 18 14 12 10 11 22 11 9 15 9 20 13,14
H73 1 14 12 22 28 16 15 14 10 11 21 11 11 16 10 20 13,14
H74 1 15 13 23 30 17 14 13 11 13 24 13 12 14 13 20 12,15
H75 1 13 13 24 31 16 14 12 10 13 23 12 12 15 12 19 11,14
H76 1 15 13 24 28 17 14 13 11 11 23 13 11 14 12 18 13,14
H77 1 17 14 21 31 17 17 14 10 12 21 11 11 14 11 21 17,19
H78 1 16 14 22 30 15 14 12 10 10 21 11 11 15 9 21 13,16
Y-STR
haplotype
diversity
in
a
Macapá
population
49
Haplotypes N DYS456 DYS389I DYS390 DYS389II DYS458 DYS19 DYS393 DYS391 DYS439 DYS635 DYS392 Y GATA H4 DYS437 DYS438 DYS448 DYS385I, II
H79 1 15 13 25 29 17 14 13 10 11 23 13 13 15 12 19 11,14
H80 1 16 13 25 29 16 15 12 10 11 23 13 11 15 11 20 13,14
H81 1 17 13 23 29 16 13 13 10 12 22 14 12 14 12 19 14,17
H82 1 15 13 24 29 17 14 13 11 12 24 13 12 15 12 19 12,13
H83 1 17 12 23 28 17 15 12 10 12 20 11 11 16 9 20 14,17
H84 1 15 14 25 30 17 14 14 10 12 23 13 13 15 12 19 11,14
H85 1 14 12 22 28 15 14 12 10 11 24 11 11 16 10 20 14,14
H86 1 15 13 24 29 18 14 13 10 12 24 13 12 15 12 19 11,14
H87 1 15 13 24 29 15 13 13 11 13 25 13 12 15 12 19 11,14
H88 1 16 13 25 29 16 14 13 10 12 23 13 12 15 12 19 11,14
H89 1 15 13 23 31 15 13 13 10 12 23 13 12 14 10 20 17,21
H90 1 16 13 24 29 16 15 13 12 12 23 13 12 15 11 19 11,14
H91 1 16 13 24 30 15 13 13 10 12 22 11 12 14 10 20 16,18
H92 1 16 13 24 29 17 14 13 11 11 23 10 11 15 12 19 11,14
H93 1 15 13 23 31 15 13 13 10 12 24 11 12 14 10 21 16,17
H94 1 15 13 24 29 16 14 13 10 12 22 13 12 14 12 19 11,14
H95 1 17 12 22 28 16 16 14 10 11 20 11 13 16 11 21 13,14
H96 1 14 13 24 30 16 13 14 10 12 22 11 12 14 10 21 13,14
H97 1 16 12 22 28 16 14 14 10 11 21 10 11 16 10 20 13,14
H98 1 16 13 24 29 18 14 13 11 12 24 13 12 15 12 19 11,12
H99 1 14 14 24 29 17 14 13 11 12 25 13 11 15 11 19 11,14
H100 1 16 13 23 30 15 17 12 10 11 23 11 13 15 9 22 13,17
H101 1 14 12 23 28 15 14 13 10 12 22 11 11 16 10 21 14,14
H102 1 15 13 22 30 16 14 12 9 11 24 11 11 15 9 21 13,17
H103 1 16 13 24 29 17 14 14 10 12 23 13 11 14 12 19 12,14
H104 1 16 13 24 29 17 14 13 11 12 24 13 12 15 11 19 11,14
H105 1 17 14 21 31 16 17 14 10 12 21 11 11 15 11 21 17,18
H106 1 15 13 24 29 16 15 13 12 12 23 13 12 15 11 19 14,14
H107 1 15 13 24 29 18 13 13 9 10 22 11 13 14 10 19 13,14
H108 1 13 13 24 29 17 14 13 11 12 24 13 12 15 12 19 11,13
H109 1 15 14 23 30 18 14 13 11 12 23 13 11 14 12 18 11,14
H110 1 15 13 23 30 17.2 15 12 10 13 21 11 11 14 10 21 13,15
H111 1 15 13 24 29 17 14 13 11 11 23 13 12 15 12 18 12,14
H112 1 15 14 24 29 18 14 12 11 13 24 14 13 15 12 20 12,14
H113 1 15 12 24 28 17 14 13 10 12 24 11 11 14 11 19 14,19
H114 1 15 14 24 30 18 15 13 11 12 23 13 11 15 12 19 14,14
H115 1 15 13 22 30 17 14 12 10 11 20 11 11 14 10 20 13,18
H116 1 16 13 24 29 16 13 13 10 13 23 13 12 15 12 19 14,14
H117 1 15 13 24 29 17 14 13 10 11 23 13 12 15 12 20 11,13
50
Francez
et
al.
Haplotypes N DYS456 DYS389I DYS390 DYS389II DYS458 DYS19 DYS393 DYS391 DYS439 DYS635 DYS392 Y GATA H4 DYS437 DYS438 DYS448 DYS385I, II
H118 1 15 13 24 29 17 15 13 10 12 23 13 12 15 12 19 11,14
H119 1 14 13 23 29 16 16 15 10 11 22 12 11 14 10 21 16,16
H120 1 15 13 22 29 17 13 13 10 12 22 15 10 14 11 19 14,16
H121 1 15 13 23 29 17 14 12 10 12 23 11 13 14 9 20 13,15
H122 1 16 14 24 30 18 14 13 11 12 23 12 11 15 12 19 11,14
H123 1 15 14 24 30 18 14 13 11 12 23 13 12 15 12 19 11,15
H124 1 16 13 23 29 15 13 12 10 12 22 14 12 15 12 19 14,17
H125 1 14 13 21 30 15 12 12 10 11 22 14 11 14 11 21 14,17
H126 1 15 14 22 32 16 17 13 10 13 20 11 11 17 8 19 15,18
H127 1 16 13 23 29 17 14 13 11 11 23 13 12 15 12 19 11,15
H128 1 15 12 25 27 18 15 13 11 11 22 14 11 14 9 19 13,16
H129 1 16 13 24 29 18 14 13 12 13 23 13 12 15 11 18 12,13
H130 1 15 13 24 28 16 14 13 11 12 23 13 11 15 12 19 11,14
H131 1 16 14 24 31 16 13 13 10 13 21 11 12 14 10 20 16,18
H132 1 15 13 21 31 16 15 13 11 11 21 11 13 14 11 21 17,17
H133 1 15 13 24 29 16 15 13 11 13 23 13 12 15 10 19 11,14
H134 1 15 13 22 30 16 15 13 10 12 20 11 11 17 9 19,20 15,16
Table 1 (cont.)
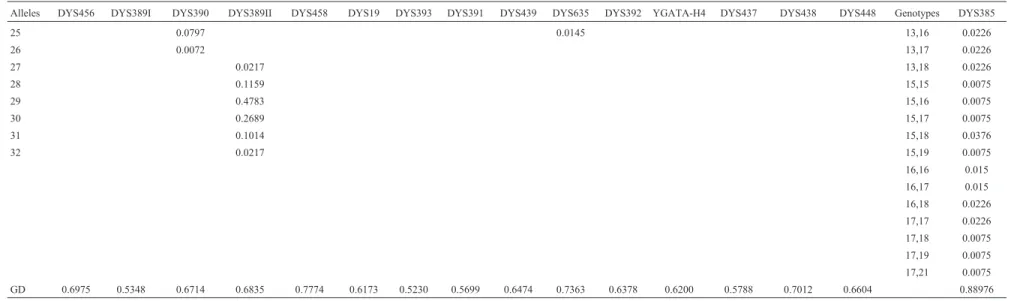
Table 2- Allele/genotype frequencies and gene diversity (GD) values of Y-STRs in a Macapá population sample (138 individuals).
Alleles DYS456 DYS389I DYS390 DYS389II DYS458 DYS19 DYS393 DYS391 DYS439 DYS635 DYS392 YGATA-H4 DYS437 DYS438 DYS448 Genotypes DYS385
8 0.0072
9 0.0652 0.0145 0.1159 10,14 0.0226
10 0.5362 0.0652 0.0217 0.0362 0.2754 11,13 0.0602
11 0.0145 0.0072 0.3768 0.2899 0.3478 0.3623 0.1449 11,14 0.2556
12 0.1449 0.0102 0.1957 0.0217 0.5000 0.0435 0.4927 0.4348 11,15 0.0677
13 0.0290 0.6377 0.1739 0.6522 0.1377 0.4855 0.0945 0.0217 11,17 0.0075
14 0.1159 0.2029 0.0507 0.5652 0.1304 0.0072 0.0870 0.3478 12,13 0.0226
15 0.4203 0.1304 0.1884 0.0072 0.0145 0.5435 12,14 0.045
16 0.3261 0.2681 0.0217 0.0072 0.0942 12,15 0.015
17 0.1014 0.3115 0.0362 0.0145 0.0080 12,17 0.0075
18 0.0072 0.1957 0.0797 14,14 0.0526
19 0.0362 0.0072 0.4928 14,16 0.0301
20 0.0072 0.063 0.2826 14,16 0.0376
21 0.0290 0.1594 0.1232 14,16 0.0075
22 0.1160 0.1957 0.0072 13,13 0.0075
23 0.2899 0.4275 0.0072 13,14 0.1053
Y-STR
haplotype
diversity
in
a
Macapá
population
51
Alleles DYS456 DYS389I DYS390 DYS389II DYS458 DYS19 DYS393 DYS391 DYS439 DYS635 DYS392 YGATA-H4 DYS437 DYS438 DYS448 Genotypes DYS385
25 0.0797 0.0145 13,16 0.0226
26 0.0072 13,17 0.0226
27 0.0217 13,18 0.0226
28 0.1159 15,15 0.0075
29 0.4783 15,16 0.0075
30 0.2689 15,17 0.0075
31 0.1014 15,18 0.0376
32 0.0217 15,19 0.0075
16,16 0.015
16,17 0.015
16,18 0.0226
17,17 0.0226
17,18 0.0075
17,19 0.0075
17,21 0.0075
GD 0.6975 0.5348 0.6714 0.6835 0.7774 0.6173 0.5230 0.5699 0.6474 0.7363 0.6378 0.6200 0.5788 0.7012 0.6604 0.88976
Table 2 (cont.)
Table 3- Y chromosome haplogroup distribution in parental populations, Macapá, and other Brazilian admixed populations.
Population Systems Y – Haplogroups (%) n (%)
E1b1b E1b1a R1b R1a I1 I2 G2a J1 J2 Q Others
1Portugal 17 STRs 20 (11.4) 1 (0.6) 101 (57.7) 0 8 (4.6) 9 (5.1) 10 (5.7) 9 (5.1) 10 (5.7) 2 (1.1) 5.00 (2.9) 175 (100)
2Angola 12 STRs 6 (3.6) 139 (83.7) 8 (4.8) 0 0 7 (4.2) 1 (0.6) 0 1 (0.6) 1 (0.6) 3.00 (1.8) 166 (100)
3Amerindians 9 STRs 0 1 (0.5) 1 (0.5) 0 1 (0.5) 0 0 0 0 183 (82.8) 35.00 (15.8) 221 (100)
4Macapá 17 STRs 16 (11.6) 5 (3.6) 72 (52.2) 0 6 (4.3) 3 (2.2) 3 (2.2) 4 (3.0) 14 (10.1) 10 (7.2) 5 (3.6) 138 (100)
5Alagoas 24 SNPs 25 (10.1) 11 (4.5) 137 (55.5) 1 (0.4) 12 (4.9) 4 (1.6) 9 (3.6) 15 (6.1) 18 (7.3) 2 (0.8) 247 (100)
6Brasília 9 STRs 9 (18.8) 2 (4.2) 19 (39.6) 0 1 (2.1) 3 (6.3) 2 (4.2) 3 (6.3) 4 (8.3) 0 5.00 (10.4) 48 (100)
7São Paulo 17 STRs 20 (10.0) 22 (11) 61 (30.5) 5 (2.5) 10 (5.0) 16 (8.0) 10 (5.0) 7 (3.5) 6 (3.0) 11 (5.5) 32.00 (16.9) 200 (100)
8Belém 9 STRs 17 (8.5) 7 (3.5) 89 (44.5) 15 (7.5) 4 (2.0) 15 (7.5) 3 (1.5) 3 (1.5) 14 (7.0) 11 (5.5) 22.00 (11.0) 200 (100)
9Rio G. do Sul 17 STRs 25 (9.8) 17 (6.7) 120 (47.1) 10 (3.9) 18 (7.1) 8 (3.1) 11 (4.3) 2 (0.8) 31 (12.2) 4 (1.6) 9.00 (2.5) 255 (100)
latter finding can be explained by the important contribu-tion of Spanish immigrants in the formacontribu-tion of the Brazilian population. The first Spanish immigrants arrived in Brazil in 1880. Until the late 19th century, the vast majority of these were from Galicia, while in the early 20th century Andalusians predominated. Other important groups in-cluded Catalans, Basques and Valencians (Cánovas MDK, 2001, Masters dissertation, Faculdade de Filosofia, Letras e Ciências Humanas da Universidade de São Paulo, São Paulo, SP, Brazil).
The results of this study show that Europeans were the main contributors to the formation of the Macapá male genetic background. These observations agree with previ-ous reports (Carvalho-Silvaet al., 2001; Silvaet al., 2006; Francezet al., 2011).
The similar haplogroup composition between the population analyzed here and other admixed Brazilian pop-ulations (Table 3) suggested that the latter poppop-ulations were probably formed by a similar process of miscegenation, with the predominant male lineages being European. This would explain the low level of Y-chromosome structuring observed in geographically and geopolitically distinct re-gions.
Acknowledgments
The authors thank the subjects who participated in this study and the Universidade Federal do Pará (UFPA) and POLITEC-AP for financial support.
References
Azevedo DA, Silva LAF, Gusmão L and Carvalho EF (2009) Analysis of Y-chromossome SNPs in Alagoas, Northeastern Brazil. Forensic Sci Int Genet 2:421-422.
Betz A, Babler G, Dietl G, Steil X, Weyermann G and Pflug W (2001) DYS STR analysis with epithelial cells in a rape case. Forensic Sci Int 118:126-130.
Carvalho-Silva DR, Santos FR, Rocha J and Pena SDJ (2001) The phylogeography of Brazilian Y-chromosome lineages. Am J Hum Genet 68:281-286.
Cunha MC (1995) História dos Índios no Brasil. 1st edition. Companhia das Letras, São Paulo, 611 pp.
Curtin PD (1969) The Atlantic Slave Trade: A Census. 1st edition. University of Wisconsin Press, Madison, 457 pp.
Domingues PM, Gusmão L, da Silva DA, Amorim A, Pereira WR and Carvalho RF (2007) Sub-Saharan Africa descendents in Rio de Janeiro (Brazil): Population and mutational data for 12 Y-STR loci. Int J Legal Med 121:238-241.
Francez PAC, Rodrigues EMR, Frazão GF, Borges NDR and Santos SEB (2011) Allelic frequencies and statistical data obtained from 12 CODIS STR loci in an admixed population of Brazilian Amazon. Genet Mol Biol 34:35-39.
Góis CC, Martins JA, Pereira GA, Freschi A, Paneto GG, Alva-renga VLS, Cicarelli RMB, Hirata MH and Oliveira RN (2007) Genetic population data of 12 STR loci of the PowerPlex®Y system in the state of São Paulo population
(Southeast of Brazil). Forensic Sci Int 174:80-85.
Grattapaglia D, Kalupniek D, Guimarães CS, Ribeiro MA, Diener OS and Soares CN (2005) Y-chromosome STR haplotype diversity in Brazilian populations. Forensic Sci Int 149:99-107.
Melo MM, Carvalho M, Lopes V, Anjos MJ, Serra A, Vieira DN, Sequeiros J and Corte-Real F (2011) Y-STR haplotypes in three ethnic linguistic groups of Angola population. Foren-sic Sci Int Genet 5:83-88.
Palha TJBF, Rodrigues EMR and Santos SEB (2007) Y-chro-mossomal STR haplotypes in population from the Amazon region, Brazil. Forensic Sci Int 166:233-239.
Palha TJBF, Rodrigues EMR and Santos SEB (2010) Y-STR haplotypes of Native American populations from the Brazil-ian Amazon region. Forensic Sci Int Genet 4:121-123. Pontes ML, Cainé L, Abrantes D, Lima G and Pinheiro MF (2007)
Allele frequencies and population data for 17 Y-STR loci (AmpFSTR®Y-filer) in a Northern Portuguese population
sample. Forensic Sci Int 170:62-67.
Ribeiro D (1995) O Povo Brasileiro: A Formação e o Sentido do Brasil. 1st edition. Companhia das Letras, São Paulo, 480 pp.
Salzano FM (2004) Interethnic variability and admixture in Latin America - Social implications. Rev Biol Trop 52:405-415. Sambrook J, Fritsch EF and Maniatis T (1989) Isolation of DNA
from mammalian cells. In: Ford N, Nolan C and Ferguson M (eds) Molecular Cloning - A Laboratory Manual. 2nd edi-tion. Cold Spring Harbor Laboratory Press, New York, pp 916-919.
Schwengber SP, Kommers T, Matte CHF, Raimann PE, Carvalho BA, Leite FPN, Medeiros MA, Souza LF, Castro CS, Cha-ssot FGC,et al.(2009) Population data of 17 Y-STR loci
from Rio Grande do Sul state (South Brazil). Forensic Sci Int Genet 4:31-33.
Silva DA, Carvalho E, Costa G, Tavares L, Amorim A and Gusmão L (2006) Y chromosome genetic variation in Rio de Janeiro population. Am J Hum Biol 18:829-837.
Internet Resources
Arlequin - A software for population genetics data analysis ver. 2.000, http://anthro.unige.ch/software/arlequin/soft-ware/2.000/doc/buglist/buglist.html (February 10, 2011). Haplogroup predictor software, www.hprg.com/hapest5/ (March
10, 2011).
YHRD - Y Chromosome haplotype reference database, www.yhrd.org (January 20, 2011).
Associate Editor: Angela M. Vianna-Morgante
License information: This is an open-access article distributed under the terms of the Creative Commons Attribution License, which permits unrestricted use, distribution, and reproduction in any medium, provided the original work is properly cited.