www.ache.org.rs/CICEQ
Chemical Industry & Chemical Engineering Quarterly 16 (2) 193−198 (2010) CI&CEQ
DRAGICA LAZIĆ1
BRANKO ŠKUNDRIĆ2 JELENA PENAVIN-ŠKUNDRIĆ3 SLAVICA SLADOJEVIĆ3
LJUBICA VASILJEVIĆ1 DRAGANA BLAGOJEVIĆ2 ZORAN OBRENOVIĆ1
1Alumina factory “Birač“, Zvornik,
RS, Bosnia and Herzegovina
2
Faculty of Natural Science, Banja Luka, RS, Bosnia and Herzegovina
3Faculty of Technology, Banja
Luka, RS, Bosnia and Herzegovina
SCIENTIFIC PAPER
UDC 547.7/.8:546.72 DOI 10.2298/CICEQ100204028L
STABILITY OF TRIS-1,10–PHENANTHROLINE
IRON (II) COMPLEX IN DIFFERENT
COMPOSITES*
The composition of composites has a huge impact on the stability of tris-1,10– -phenanthroline iron (II) complex during the determination of total iron. The subject of this work is the determination of the stability of tris-1,10–phenanthro-line iron (II) complex in different composites. The composites with different concentration in which total iron was determined were alumina and zeolite. The stability of this complex was monitored in the time period of 0-60 min. The aim of this work is to determine the concentration of different composite samp-les and the time interval in which the stability of the complex is the highest. The spectrophotometric method was used for the determination. The tris-1,10–phe-nanthroline iron (II) complex with alumina is more stable at higher concentra-tion of the samples. With zeolite, however, this complex is stable in a short time interval, regardless the concentration of the sample. This conclusion indicates the increase of absorption, which is a consequence of impede complex forma-tion and creating a new complex. For this reason, this method has only a limi-ted application.
Key words: 1,10–phenanthroline iron (II) complex; composites; zeolite; stability; alumina.
According to the theory of coordination, atoms or ions, particularly the atoms of transition elements can be bound or coordinate in a certain number or they create a spatial distribution of atoms, ions or mo-lecules thus forming complex (coordination) com-pounds. Complex compounds consist of the central atom ion (builder of the complex) around which two or more ligands are coordinated. The number of ligands that are directly linked to the central ion in the comp-lex is observed as the coordination number. It de-pends on the nature of the central atom, its electronic configuration and size, as well as a coordination abi-lity of the ligand [1–3].
Polyatomic ligands can be bound to the central ion with one or more atoms; therefore we can dis-tinguish monodentate, bidentate, three-dentate or po-lydentate ligands. The coordination number can be 2,
Corresponding author: D. Lazić, Alumina factory “Birač“, Kara-kaj bb, Zvornik, RS, Bosnia and Herzegovina.
E-mail: lazic.p@teol.net
*A part of this study was presented as a poster at the 8th
Sym-posium „Novel Technologies and Economics Development“, Uni-versity of Niš, Faculty of Technology, Leskovac, October 23-24, 2009.
Paper received: 4 February, 2010 Paper revised: 22 April, 2010 Paper accepted: 3 May, 2010
3, 4, 5, 6, 7 and 8, but the most common are 4 and 6. The achieved coordination results in changes, both in the properties of the central atom and the properties of ligand [3–5].
Ortho-phenantroline (1,10-phenantroline) is an organic reagent (Mr = 198.22 g/mol). It is used for photometric determination of the following elements: Cu (II) at wavelength of 272 nm; Cu(I) (435 nm); Co(226 and 270 nm); Cd (226 and 270 nm); Fe(II) (508 nm); Mn (226 and 268 nm); Ru (448 nm); Ni (228 and 270 nm) and Zn (226 and 270 nm) [4,6–12].
With orto-phenantroline, Fe (II) forms a stable complex of red color, which is called Ferrand. The color of the complex is stable in the interval of pH 2-9 [10–12].
Smaller cations and bivalent metals obstruct the process of determining iron using ortho-phenantroline complex, forming complexes or hardly soluble com-pounds with Fe(II), Co(II), Ni(II), Sn(II) and Cu(II).
Since ferrous iron is determined by the method, therefore ferric iron reduced to ferrous using a hydro-xylamine hydrochloride solution [4–6,8–12].
this paper, is used for the aluminum production. It contains min. 98.6% Al2O3, and the rest is impurities such as Fe, Si, V, F, P, Cr, Na, Zn, etc. Synthetic zeo-lite is a crystalline sodium aluminosilicate with athree- -dimensional structure type LTA (zeolite type 4A). The primary building units are atoms of silicon and alu-minum, located in the center of the tetrahedron on the corner of which there are oxygen atoms. Tetrahedra of silica, [SiO4]4-, and aluminum, [AlO4]5-, are con-nected by oxygen atoms, so that the tetrahedra are connected to each other by anoxygen bridge. Tetra-hedra, as the primary structure building units can be connected in 4- or 6-membered rings. The combina-tion of tetrahedron in other structural forms formed the so-called secondary building units, which partici-pate in the construction of various types of zeolites. The impurities present in the alumina are also in the zeolite [13].
EXPERIMENTAL
For the experimental part of the work, powders of alumina and synthetic zeolite manufactured in the Alumina Factory “Birač“ AD, were used. The alumina solution was prepared by mixing 2, 3 and 4 g of alu-mina with flux (H3BO3 and Na2CO3). After that, the sample was melted at the temperature of 400 °C, then again at 1000 °C. The melted sample was cooled down and dissolved in distilled water to which H2SO4 (1:1) was added, after which the solution was trans-ferred into the volumetric flask of 200 cm3. This solu-tion is the basic alumina solusolu-tion for the determinasolu-tion of iron.
The zeolite solution was prepared by dissolving 1.0, 1.5, 2.0 and 3.0 g of zeolite in HCl, after which the solution was transferred into the volumetric flask of 250 cm3. This solution is the basic solution of zeo-lite for the determination of iron in zeozeo-lite.
For the determination of iron in alumina and zeo-lite a R805-ISO spectrometric method was used
,
which is identical to the methods Gost 13583.3-70, JUS H.B8.057 and JUS H.B8.059, and, based on the previous reduction of ferric iron using hydroxylamine hydrochloride, then on the formation of the red tris- -1,10–phenanthroline iron (II) complex under strictly defined pH (3.5-4.2), and the photometric determi-nation at a wavelength of 511 nm [10–12].UV/Vis spectrophotometer Perkin-Elmer (Lamb-da 25) was used for the spectrophotometric deter-mination.
The selection of wavelength of 511 nm was per-formed as follows:absorption spectraof the prepared standard solution of iron were recorded in the range
of 300-600 nm. After that, absorption maximum was determined, so for the wavelength of this maximum in accordance with Beer’s law presents a linear depen-dence of absorbance on the concentration and the steeper linear relation was selected.
Used chemicals (p.a.) are: hydroxylamine hydro-chloride (Lachner, Czech Republic), 1% ortho-phe-nanthroline solution (Merck, Germany), 0,25% buffer, pH 5,5 (200g CH3COONa⋅3H2O or 120,56 g CH3COONa in 500cm3 of water was dissolved with the addition of 12,5 cm3 of concentrated CH
3COOH, all transferred into the volumetric flask 1000 cm3 and filled with distilled water); a producer of CH3COONa is Lachner, Czech Republic and of CH3COOH Zorka, Serbia; a standard solution of iron 0,01 g Fe2O3 (0.2000 g Fe2O3 dissolved in 20 cm3 of HCl 1:1 and transferred into a volumetric flask 1000 cm3, then 25 cm3 of the solution is transferred to the volumetric flask of 500cm3), producer Merck, Germany and HCl Zorka, Serbia, sulfuric acid 1:1 (Lachner, Czech Republic), H3BO3 (Zorka, Serbia), Na2CO3 (Lachner, Czech Republic).
RESULTS AND DISCUSSION
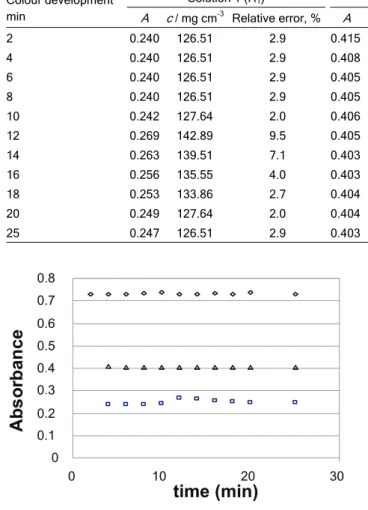
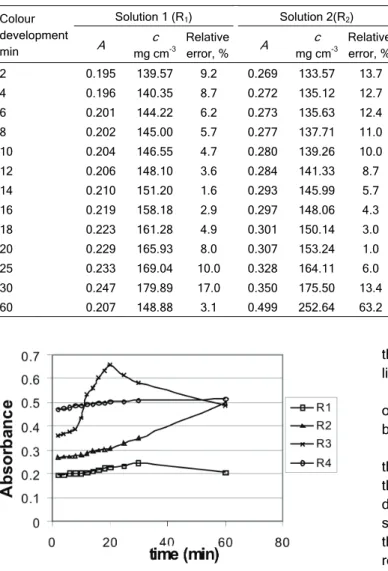
The stability of the tris-1,10–phenanthroline iron (II) complex was monitored in solutions containing different concentrations of alumina, 2, 3 or 4 g/200cm3 in the time interval of 0-60 min. A direct pro-portionality between the concentration of alumina and iron concentrations was observed which actually means that the increase of the concentration of alumina in the solution increases the concentration of iron. For the alumina solution containing 2g/200 cm3 of alu-mina, tris-1,10–phenanthroline iron (II) complex is com-pletely stable for the first ten minutes in the intervals of 10-20 min absorbance changes, reaching the initial value once more at the end (Table 1).
For the solution containing 3 and 4 g/200cm3 of alumina, tris-1,10–phenanthroline iron (II) complex is considerably stable depending on time and absor-bance does not change. There are certain negligible deviations here that can be seen as permissible errors in measurements.
Figure 1. Dependence of absorbance of the time for different concentrations alumina, 2, 3 and 4 g/200cm3,
solutions R1, R2 and R3.
Based on these absorbance measurements in alumina solution, it has been shown that the tris-1,10– -phenanthroline iron (II) complex is very stable; there-fore, the method of determining the stability of the mentioned complex of iron with 1,10–phenanthroline can line up as the method of choice (Fig. 1).
The values of relative error measurements after 20 min for different concentrations of alumina are the following:
2 g/200cm3: 2%, 3 g/200cm3: 1.2% and 4 g/200cm3: 0,7%.
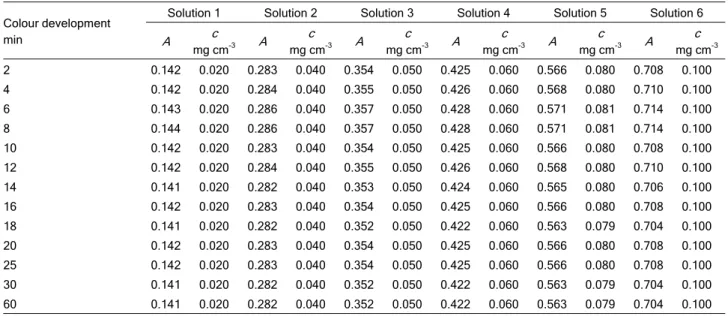
For the solutions of zeolite with concentrations 1.0 and 2.0 g/250 cm3, it was observed that the absor-bance in the initial period is changing in a negligibly small degree. After 12 min following the addition of ortho-phenantroline, the absorbance begins to rise gradually, reaching a maximum at 30 min after which
it decreases again. In the solution containing 1.5 g/250 cm3 of zeolite, no considerable increase in ab-sorbance can be observed up to 12 min from the moment when ortho-phenantroline was added; how-ever, it rises continuously thereafter, which indicates that probably another complex is formed and disturbs the formation of the tris-1,10–phenanthroline iron (II) complex, because in zeolite solution more ions com-pared to alumina are present which disturb the complex formation (Table 2). However, in the solution containing 3 g of zeolite per 250cm3 the complex was stable for 10 min after which the absorbance began to rise, though not significantly, indicating that there was not enough ortho-phenantroline to develop the color and to disturb the complex formation with ions from solution
,
because the content of zeolite in the solution was too high (Table 2, Fig. 2). To determine the ca-libration curve for iron, 0.2 g/dm3 Fe2O3 solution was used to prepare the solutions 1–6.Just as with determining the concentration of the sample, in this case the absorbance of each standard solution of different concentrations (0.02, 0.04, 0.05, 0.06, 0.08 and 0.10) mg Fe2O3/cm3 was measured at the same time interval (0-60 min, Table 3).
Based on the obtained data, the stability of the solution in the examined period is observed. The in-crease of the concentration of the standard Fe2O3 so-lution results in the increase of the absorbance and concentration of Fe2O3, which means that there is a direct dependence between the concentration of the standard solution and absorbance. The value of ab-sorbance and the concentration of the standard solu-tion are constant over time, which justifies the use of spectrophotometric methods.
Table 1. Dependence between absorbance and concentration of Fe2O3 for different alumina concentrations and time; solution 1 (R1)
-- concentration of alumina, 2 g/200 cm3, solution 2 (R2) - concentration of alumina, 3 g/200 cm3, solution 3 (R3) -concentration of
alu-mina, 4 g/200 cm3
Colour development min
Solution 1 (R1) Solution 2(R2) Solution 3(R3)
A c / mg cm-3 Relative error, % A c / mg cm-3 Relative error, % A c / mg cm-3 Relative error, %
Figure 2. Dependence of absorbance of the time for different concentrations zeolite, 1.0, 1.5, 2.0 and 3.0 g/250cm3,
solutions R1, R2, R3 and R4.
Using the obtained values of the absorbance of the standard solution, measured for 10 min from the moment of adding ortho-phenantroline for each solu-tion, and applying the formula K = c/A, the calibration constant is obtained. Based on the obtained values of constants, the average value of the constant is cal-culated at 0.1412.
Based on all the results of zeolite absorbance, it can be concluded that the tris-1,10–phenanthroline iron (II) complex is stable in a narrow time interval, after which the increase in absorbance occurs, reach-ing a maximum after 30 min from the moment ortho- -phenantroline has been added. This indicates that most probably the disturbance of the tris-1,10–phe-nanthroline iron (II) complex formation and probably
the formation of new complex with ortho-phenantro-line occurred.
This complex disintegrates after a certain period of time, which is indicated by the decrease of absor-bance after 30 min.
The oscillations of the absorbance depending on the time of those concentrations of zeolite suggest that in this composite the formation of the complex is disturbed which is probably caused by the composite structure and present anions of mineral acids used in their dissolution. This could be the subject of a new research in the field of stereochemistry. Complexing of some other substance in zeolite must have taken place, since it is a complex compound and the inter-actions of ortho-phenantroline complex with other com-ponents in the solution of these composites are pos-sible.
In the case of the solution prepared from alu-mina, the absorbance was more stable, due to less frequent interactions between the tris-1,10–phenan-throline iron (II) complex and other components pre-sent in the composite. During the spectrophotometric determination of iron under strictly defined pH values, wavelength and concentration regime, it was deter-mined that determinations are limited, partly due to the stability of the complex and partly due to disturbed complex formation with components that are present in the composite. In determining the concentration of the standard solution of iron with ortho-phenantroline, the absorbance was stable, because there were no impurities that could influence the formation and sta-bility of tris-1,10–phenanthroline iron (II) complex, which
Table 2. Dependence between absorbance and concentration of Fe2O3 for different zeolite concentrations and time; solution 1 (R1)
-concentration of zeolite, 1.0 g/250 cm3, solution 2 (R2) -concentration of zeolite, 1.5 g/250 cm3, solution 3 (R3) - concentration of zeolite,
2.5 g/250 cm3, solution 4 (R
4) - concentration of zeolite, 3.0 g/250 cm3
Colour development min
Solution 1 (R1) Solution 2(R2) Solution 3(R3) Solution 4(R4)
A c
mg cm-3
Relative error, % A
c mg cm-3
Relative error, % A
c mg cm-3
Relative error, % A
c mg cm-3
Relative error, %
goes in favor with the fact that with complex solutions, due to the fact that absorbance changes, a new plex is formed, with the presence of composite com-ponents, and some of them disturb tris-1,10–phenan-throline iron (II) complex formation.
Due to all these facts, spectroscopic methods of determining iron in zeolite cannot be the method of choice, since tris-1,10–phenanthroline iron (II) com-plex is stable in a very short time interval.
CONCLUSIONS
1. tris-1,10–Phenanthroline iron (II) complex obeys the Beer’s law (linear function of the dependence between absorbance and concentration) for all tested solutions.
2. For the concentration of alumina 2 g/200 cm3, tris-1,10–phenanthroline iron (II) complex of iron is un-stable in the time interval of 10-20 min, which ex-plains the low concentration of iron which results in large error in determining.
3. At the concentration of alumina 3 and 4 g/200 cm3, tris-1,10–phenanthroline iron (II) complex of iron is stable throughout the entire time interval, and the error in determining is reduced, which indicates that the concentration of alumina is suitable for the deter-mination of iron using this method.
4. For different concentrations of zeolite (1, 1.5, 2.0 and 3.0 g/250 cm3) in the time interval of 0-60 min from the moment of adding ortho-phenantroline, sta-bility of the tris-1,10–phenanthroline iron (II) complex occurs in a short time interval (8-10 min) as absor-bancy further increases
,
which gives unreliable re-sults of determination, so this method of determiningiron in zeolite cannot be the method of choice be-cause there is disturbance of complex formationand probably the formation of a new complex with com-ponents of the composite.
5. During spectrophotometric determination of the standard solution of iron with ortho-phenantroline, the absorbance does not change for the whole period,
i.e., the complex is stable, which goes in favour with the idea that the composition of the composite influences the stability of the complex.
6. Spectrophotometric determinations of iron with ortho-phenantroline under strictly defined pH values, wavelength and concentration regime are limited to the composition of composites (zeolite and alumina) and present mineral acid anions used for dissolution thereof.
7. Conclusions five and six indicate that the fu-ture research should focuses on the research stereo-chemistry resulting complex from these composite zeolites and alumina.
REFERENCES
[1] A.A. Schilt, B. Jaselskis, Ultraviolet and Visible Spectro-photometry, Intersciences Pub., New York, 1964., p. 2943 [2] D.A. Skoog, D.M. West, Principles of Instrumental
Ana-lysis, 2nd ed.,Saunders College, Philadelphia, PA, 1980 [3] F.J.C. Rossotti, The Determination of Stablity Constants,
McGraw Hill, New York, 1961, p. 270
[4] T. Džomić, Student Work, Faculty of natural sciences, Novi Sad, 2005 (in Serbian)
[5] M. Todorović, P. Đurđević, V. Antonijević, Otical methods for instrumental analysis, Faculty of Chemistry, Belgrade, 1997 (in Serbian)
Table 3. Dependence between absorbance and concentration of Fe2O3 and time for a standard solution of 0.2 g/dm3 Fe2O3
Colour development min
Solution 1 Solution 2 Solution 3 Solution 4 Solution 5 Solution 6
A c
mg cm-3 A
c
mg cm-3 A
c
mg cm-3 A
c
mg cm-3 A
c
mg cm-3 A
c mg cm-3
[6] D.C. Harris, Quantitative chemical analysis, W. H. Freeman and Co., New York, 1996
[7] J. Ćirić et al., Analytics, Rad, Belgrade, 1986 (in Serbian) [8] J. Vindakijević, S. Sladojević, Analytical chemistry,
Fa-culty of Technology, Banja Luka, 2005 (in Serbian) [9] http://www.alfa.com/alf/laboratory
[10] K. Spiramam, C. Ramakrishna, J. Streelakshmi, React. Kinet. Catal. Lett. 61 (1997) 209-215
[11] D.C. Haris, Determination of Iron with 1,10-Phenanthro-line, in: Quantitative Chemical Analysis, 6th ed., W. H. Freeman & Company, New York, 2003, pp. 258-261, 407-422, 453, 461-476, 707-709
[12] H. Pyenson, P.H. Tracy, J. Dairy Sci. 28 (1945) 401-412 [13] Lj. Vasiljević, PhD Thesis, Faculty of Natural Science,
University of Banja Luka,, 2009 (in Serbian).
DRAGICA LAZIĆ1
BRANKO ŠKUNDRIĆ2 JELENA PENAVIN-ŠKUNDRIĆ3 SLAVICA SLADOJEVIĆ3
LJUBICA VASILJEVIĆ1 DRAGANA BLAGOJEVIĆ2
ZORAN OBRENOVIĆ1
1Fabrika glinice“Birač“, Zvornik,
RS, BiH
2Prirodno-matematički fakultet,
Banja Luka,RS, BiH
3Tehnološki fakultet, Banja Luka,
RS, BiH
NAUČNI RAD
STABILNOST TRIS-1,10-FENANTROLIN GVOŽ
Đ
E (II)
KOMPLEKSA U RAZLI
Č
ITIM KOMPOZITIMA
Sastav kompozita ima veliki uticaj na stabilnost tris-1,10-fenantrolin gvožđe(II) kompleksa pri određivanju ukupnog gvožđa. Predmet ovog rada je određivanje stabilnosti tris-1,10--fenantrolin gvožđe(II) kompleksa u različitim kompozitima. Kompoziti različitih koncen-tracija u kojima je određivano ukupno gvožđe su: glinica i zeolit. Stabilnost ovog kom-pleksa praćena je u vremenu od 0-60 min. Cilj rada je da se odredi koncentracija uzoraka razlličitih kompozita i vremenski interval pri kojima je stabilnost kompleksa najveća. Za određivanje je korištena spektrofotometrijska metoda. Tris-1,10-fenantrolin gvožđe(II) kom-pleks u slučaju glinice je stabilniji pri većoj koncentraciji uzorka. Kod zeolita, pak, ovaj kompleks je sabilan u kratkom vremenskom intervalu, bez obzira na njegovu koncentraciju. Na ovaj zaključak upućuje porast apsorbancije, koja je posledica ometanja nastajanja kompleksa, a i stvaranja novog kompleksa. Iz ovog razloga ova metoda ima ograničenu primjenu.