Global Mapping of DNA Conformational
Flexibility on
Saccharomyces cerevisiae
Giulia Menconi1,2*, Andrea Bedini3, Roberto Barale4, Isabella Sbrana4
1Dip. Informatica, Universitàdi Pisa, Largo Pontecorvo, Pisa, Italy,2Istituto Nazionale di Alta Matematica “Francesco Severi”, Piazzale Aldo Moro, CittàUniversitaria, Roma, Italy,3Dept. Mathematics and Statistics, The University of Melbourne Victoria, Australia,4Dip. Biologia, Universitàdi Pisa, Via Derna, Pisa, Italy
Abstract
In this study we provide the first comprehensive map of DNA conformational flexibility in
Saccharomyces cerevisiaecomplete genome. Flexibility plays a key role in DNA
supercoil-ing and DNA/protein bindsupercoil-ing, regulatsupercoil-ing DNA transcription, replication or repair. Specific in-terest in flexibility analysis concerns its relationship with human genome instability. Enrichment in flexible sequences has been detected in unstable regions of human genome defined fragile sites, where genes map and carry frequent deletions and rearrangements in cancer. Flexible sequences have been suggested to be the determinants of fragile gene proneness to breakage; however, their actual role and properties remain elusive. Ourin
silicoanalysis carried out genome-wide via the StabFlex algorithm, shows the conserved
presence of highly flexible regions in budding yeast genome as well as in genomes of other Saccharomycessensu strictospecies. Flexibile peaks inS. cerevisiaeidentify 175 ORFs mapping on their 30UTR, a region affecting mRNA translation, localization and stability. (TA) n repeats of different extension shape the central structure of peaks and co-localize with polyadenylation efficiency element (EE) signals. ORFs with flexible peaks share common features. Transcripts are characterized by decreased half-life: this is considered peculiar of genes involved in regulatory systems with high turnover; consistently, their function affects biological processes such as cell cycle regulation or stress response. Our findings support the functional importance of flexibility peaks, suggesting that the flexible sequence may be derived by an expansion of canonical TAYRTA polyadenylation efficiency element. The flexible (TA)n repeat amplification could be the outcome of an evolutionary neofunctionali-zation leading to a differential 3’-end processing and expression regulation in genes with pe-culiar function. Our study provides a new support to the functional role of flexibility in genomes and a strategy for its characterization inside human fragile sites.
Author Summary
High DNA helix torsional flexibility characterizes sequences which are enriched in fragile sites, loci of peculiar chromosome instability inside human genome often associated with cancer genes. AT-rich flexible islands are suggested to be the determinants of chromosome
a11111
OPEN ACCESS
Citation:Menconi G, Bedini A, Barale R, Sbrana I (2015) Global Mapping of DNA Conformational Flexibility onSaccharomyces cerevisiae. PLoS Comput Biol 11(4): e1004136. doi:10.1371/journal. pcbi.1004136
Editor:Christos A. Ouzounis, Hellas, GREECE
Received:September 30, 2014
Accepted:January 16, 2015
Published:April 10, 2015
Copyright:© 2015 Menconi et al. This is an open access article distributed under the terms of the
Creative Commons Attribution License, which permits unrestricted use, distribution, and reproduction in any medium, provided the original author and source are credited.
Data Availability Statement:All relevant data are within the paper and its Supporting Information files. Additional files are available from the URLhttp://dx. doi.org/10.6084/m9.figshare.1327440.
Funding:The authors received no specific funding for this work.
Competing Interests:The authors have declared
fragility; however, the origin of their occurrence in cancer genes and the mechanism of chromosome breakage remain unknown. Here, we study DNA flexibility in budding yeast chromosomes. We found that flexibility is conserved in yeast species. Flexibile peaks iden-tify 175 ORFs, mapping on their 30-end untraslated region. (TA)n repeats of different
ex-tension shape the central structure of peaks and co-localize with polyadenylation signals. ORFs with peaks have decreased mRNA stability and prevalent regulatory functions. Our findings support the functional importance of flexibility peaks. They suggest that function-al processes may be function-also at the origin of flexibility peaks presence inside cancer genes in human fragile sites. Definition of role of flexible sequences in genomes may help to under-stand the processes implied in cancer gene rearrangements.
Introduction
DNA conformational flexibility is a function of the dsDNA sequence that defines how the mol-ecule can bend or exhibit a torsion (twist motion) about its axis.
Flexibility is important in DNA supercoiling and shows particular significance in DNA-pro-tein interaction. The relationship of flexibility with the nucleosome occupancy and DNA loop-ing along the genomes determines its key role in many biological functions includloop-ing the DNA regulation during transcription and replication and DNA repair [1].
The presence of areas of high DNA flexibility at the twist angle has been reported in several unstable regions of human genome, such as fragile sites. Fragile sites are regions peculiarly prone to DNA breakage, usually in conditions of replicational stress; the common fragile sites often map in association with genes involved in tumorigenesis, such asFHIT,WWOX; their in-stability causes cancer-specific recurrent deletion and translocation breakpoints [2]. While their molecular basis remains elusive, the identification in a number of them of AT-rich flexible islands, capable of forming stable secondary structures has suggested that flexible regions are good candidates for determinants of chromosome fragility [3,4]. Effects on DNA stability through a structural interference with replication and a block of fork progression have been in-dicated as possible action mechanisms of flexible sequences [5]. Stalled forks and mitotic entry before replication completion have been indeed shown to be related to chromosome breakage in fragile regions [6]. New results, however, enlighten that also functional aspects are implied in chromosome fragility. Mapping of fragile sites in different cell type confirmed that their set-ting is tissue dependent and so epigenetically determined [7]. Consistently, fragile sites express-ed in human lymphocytes show correlatexpress-ed breakage and are enrichexpress-ed in genes involvexpress-ed in immunity and inflammation, cell-type specific processes [8].
Experimental direct evidence for the role of flexibility in genomic instability has been ob-tained by using a genetic assay in yeast, where the insertion of a short AT-rich sequence that spans the peak of highest flexibility of the human fragile siteFRA16Dhas been demonstrated to be able to increase chromosome breakage [9]. A support to this model comes from the ob-servation in human genome that AT-rich flexibility peaks also lie at breakpoints of chromo-some rearrangements involving the LCR22A-D region of 22q11.2 chromochromo-some, a highly unstable segmental duplication implied in constitutional genomic diseases. [10].
helix by measurements of the twist angle between consecutive base pairs, implementing the TwistFlex software previously developed [11] for the analysis of human fragile sites [3,12] and its adaptation to fast long sequences analysis.
We present here a high resolution map of twist-angle deviation for the complete genome of
Saccharomyces cerevisiae[13]. We determined the presence of 183 flexibility peaks. We defined peaks as segments of genome with twist flexibility above a fixed threshold (i.e. twice the stan-dard deviation). We mapped the location of the flexibility peaks within the yeast genome using the SGD [14] and data reported in literature, both uploaded into the UCSC Genome Browser [15]. Flexibility peaks appear on the 30UTR of 175 ORFs inS. cerevisiae, which share common
features. The connection between flexibility peaks and ORFs could be the evolutionary out-come of modified canonical polyadenylation elements, leading to a differentiated 30-end
pro-cessing and gene expression regulation.
Results
Genomic distribution of flexibility peaks
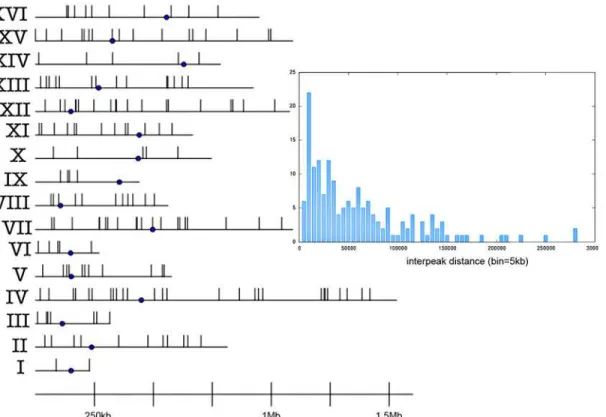
The analysis of the first comprehensive map of twist flexibility values reveals the presence of 183 peaks which are 250bplong on average (longest 975bp, shortest 188bp). In the following, peaks shall be denoted by peakIV-16, meaning the 16th peak within chrIV. Their chromosomal map shows no enrichment at specific chromosome arms or at centromere or telomere posi-tions/regions (Fig. 1). The longest chromosomes (chrIV, chrVII, chrXII and chrXV) contain the largest number of peaks, showing a general good correlation between peaks’distribution
Fig 1. Chromosomal map of flexibility peaks.The point is the centromere. Inset: Distribution of distance between adjacent peaks in complete yeast genome (each bin spans 5kb and counts all the peaks within that distance to the nearest one).
and chromosome content (see Table 1 inS1 File). However, peaks do not follow a regular pat-tern but show regions of intense presence as well as empty regions; the different distances be-tween peaks are reported inFig. 1(inset).
The chromosomal map suggests that peaks may be positioned at some specific target sites. First, we compared peaks’location to ORFs; then, to major genomic annotations. The results, reported inS1 Table, show that most of flexibility peaks (170 peaks out of 183, 92.9%) are posi-tioned within interORF regions (Fisher test:p<10−16). Out of the remaining peaks, 11 lie
in-side ORFs, one peak lies on a telomere (peakI-2) and one peak lies on a rRNA locus (peakXII-12).
Flexibility peaks are localized at tandem repeats inside 3
0UTR regions
InS. cerevisiaecompact genome the interORF regions make up only 27% of the genome length. Of them, 26% are upstream of two divergently transcribed genes and 49% are upstream of one gene and downstream of another, so including putative promoters; finally, 25% are down-stream of two convergently transcribed genes, presumably containing only terminators [16].
The inspection of the interORF regions containing flexibility peaks reveals that 67 peaks (39, 4%) lie at interORF regions between converging genes, 77 peaks (45, 3%) lie between genes with unidirectional transcription, only 26 peaks (15, 3%) lie between two genes with divergent transcription (seeS1 Table). This is not coherent with 1:2:1 ratio distribution of the yeast ge-nome, making the difference statistically significant for the converging regions (Fisher test:
p= 2, 959 × 10−5) as well as for the diverging ones (Fisher test:p= 2.201 × 10⁻³).
The distribution and position of genes along chromosomes are basic genomic features known to play a role in the regulation of gene transcription and translation; this is of particular importance in yeast compact genome due to its dense arrangement of genes and short intra-genic regions. For example, genes that are divergently expressed may share promoter and tran-scription factors and show similar regulation and functional relationship; similarly, convergent genes may share terminators or 30-transcribed regions [17]. In this context, the observed
preva-lent position of flexibility peaks suggests that they could represent structural regulatory signals. We take advantage of measurement of promoter, 50UTR, 30UTR and terminator regions of
a large number of yeast genes reported by Tuller et al. [17] to analyze the possible co-localiza-tion of any of these regions with flexibility peaks. According to the cited authors, promoters and terminators were considered the sequences intermediate between the different untraslated regions; for only a few ORFs without measure data, the average length of 50UTR and 30UTR
were reported. We found that all peaks lying between convergent genes, except 4 peaks, co-lo-calize with the 30UTR of one ORF or of both ORFs, as in the cases of very large peak extension
or 30UTR partial overlap (Fisher test:p<10−15). Peaks lying between genes with unidirectional
transcription co-localize with 30UTR in 64 cases (Fisher test:p<10−15). To sum up, peaks on a
30UTR region are 127 and ORFs with a peak in 30UTR are 175. Finally, peaks between
diver-gent genes co-localize with 50UTR in 18 cases (Fisher test:p<10−15). Peaks’features are
re-ported onS1 Table.
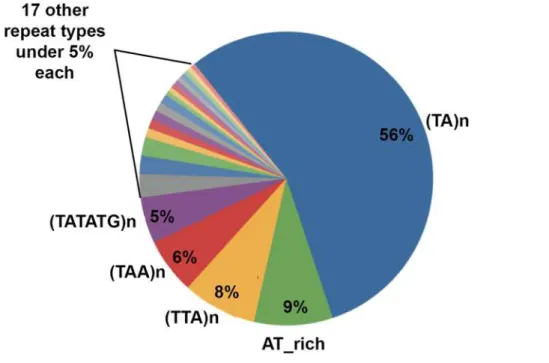
The presence of shared sequences inside peak sequences was searched by a ClustalW2 align-ment analysis, that however give no significant results. Differently, a Repeat Masker analysis re-vealed that all peaks were characterized by (TA)n or similar AT-rich repeats (Fig. 2).
Flexibility peaks map on polyadenylation signals
30UTR is a regulatory region; in yeast several distinct but interacting elements compose the 30
-end forming signals: the polyadenylation efficiency element (EE), the positioning element (PE) and the near-upstream/near-downstream elements (w.r.t. cleavage site). EE is the upstream sig-nal including mainly TATATA (consensus sequence: TAYRTA). PE occurs 16 to 27nt down-stream and the best word for this element is AATAAA (consensus sequence: AAWAAA); however, it is commonly described only as A-rich, since many functional sequences are charac-terized only by their adenosine content. The near-upstream element, as well as the near-down-stream, is characterized as T-rich [18].
The EE promotes the recruitment of other polyadenylation factors by binding, upon tran-scription of RNA, the trans-acting factorHrp1, that also plays important roles in mRNA ex-port, mRNA surveillance and nonsense mediated decay. The TAYRTA sequence provides the greatest effect on 30-end processing with the T/U at the first and fifth positions being the most
critical for function; on a large-scale analysis (1017 yeast nuclear transcripts) more than half of 30UTR (52%) contained this optimal EE sequence [19]; in more cases, transcripts contain
sev-eral consecutive copies of EE sequence [20]. Owing to these reported TA-rich EE structures, we searched evidence for a general relationship between the tandem repeats (corresponding to flexibility peaks) and EE elements.
In literature, the sequence for the 30-end of theGAL7orMRP2genes have been made
avail-able [20] and authors mapped in detail major poly(A) sites and expanded EE elements (TA)8.
We found that the EE elements co-localize with an under-threshold flexible region (i.e. a geno-mic region where flexibility is enhanced, but does not reach the peak threshold). Similar results have been obtained for the expanded EE element detected within the 30UTR ofFBP1gene,
con-stituted by a (TA)14repeat [21], again co-localizing with an under-threshold flexible region;
this last element is of special interest because it has been experimentally shown to be a very
Fig 2. Distribution of repeats within flexibility peaks.
potent polyadenylation element in both strand orientations. The expanded EE has been sug-gested [22] to affect polyadenylation offering several overlapping binding sites toHrp1or al-lowing its association/disassociation at multiple binding sites. Thus, we speculated that all the flexibility peaks that are positioned at 30UTR might have the potential to serve as EEs, with an
expansion linked to functional features, where the determinant for complex 30-end formation
could be just the DNA/RNA secondary structure due to helix flexibility.
Ozsolak et al. [23] have obtained very informative data in a map of poly(A) cleavage sites in yeast genome generated by a direct RNA sequencing.
For each poly(A) intense cleavage site (i.e. scored at least 945 by authors of [23]), we calcu-lated the distance from midpoint of repeats in nearest peak. There are 2874 intense sites (out of 34444) which are closer than 500ntfrom a repeat within a peak. As shown byFig. 3, intense poly(A) sites occur in a highly position-specific manner, prevalently within a distance range of 5ntto 25ntfrom repeats: 91.7% of them are closer than 100ntand 73.8% are closer than 25nt. If we limit this analysis only to (TA)n, then 75% are closer than 25nt. Poly(A) intense cleavage sites usually are present as multiple and clustered elements inside range [0-25nt] from repeats. Almost all peaks in convergent and unidirectional intergenic regions match to intense poly(A) signals. The authors of [23] read weak and isolated signals as indicative of a low transcriptional activity; this occurs only in nine peaks, so it is nearly negligble.
Moreover, we inserted on UCSC Genome Browser the position of characterized positioning elements (PE, whose consensus sequence is AAWAAA) and of efficiency elements (EE, whose consensus sequence is TAYRTA), defined for both strands through the Yeast Genome Pattern Matching [24]. The analysis of repeats position and of strand direction of signals highlights a peculiar organization of 30UTR extremity or of its extension. In unidirectional intergenic
re-gions, the repeat sequence covers the extremity of mapped 30UTR or lies slightly outside it,
Fig 3. Distance of most intense poly(A) sites (score greater than 945)—following Ozsolak et al. [23]—
from the midpoint of repeats inside each flexibility peak (see text for details on calculations).The outer bar (large and blue) refers to distance from (TA)n, only. The inner bar (thin and yellow) refers to distance from any repeat, indifferently.
bordering the downstream poly(A) signals; the EE element is found in multiple copies, all over-lapping the repeat sequences. The PE element, when present, may be positioned either up-stream the EE (within the 30UTR), or downstream the complete 30-end forming signal, as well
as in both positions within the same 30UTR. Examples include the 30-ends of genesIME1
(peakX-5),DBF4(peakIV-14) orCDC53(peakIV-5) (see supportingS1 file, figure 1). In the convergent intergenic regions, ORFs often overlap their 30UTR; here, the repeat
se-quence and the concomitant EE element may lie either inside only one or inside both 30UTRs,
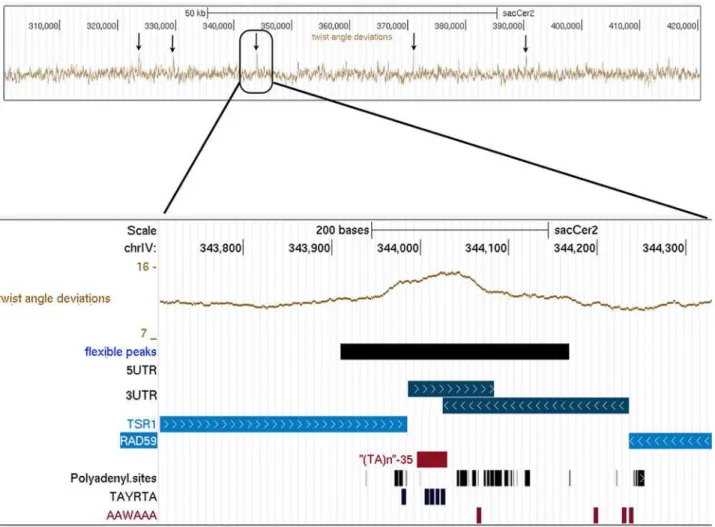
thus bordering poly(A) signals on both sides; the repeat/EE sequence represents a central ele-ment from which the poly(A) reads depart in divergent direction, forming a complex overlap-ping polyadenylation signal. Examples are the peculiar 30-ends of the convergent gene pairs TSR1andRAD59(peakIV-9, seeFig. 4), as well asERV15andAME1(peakII-10),SNC1and
MYO4(peakI-1), orDIG2andPHO8(peakIV-27) (see supportingS1 file, figure 2).
Fig 4. Snapshot of UCSC genome browser visualization of flexibility data on chrIV:300000-420000 region.Arrows target flexibility peaks. The bottom plot shows details for peakIV-9, lying within the convergent intergenic region betweenRAD59(YDL059C) andTSR1(YDL060W). Tracks correspond (in order from top to bottom) to Chromosomal location, Twist angle deviation values, Flexible peaks extent (values higher than 13.8deg), 50UTR and 30UTR positions
(50UTRs are absent in this region, 30UTRs are convergent), Annotated ORFs, (TA) Repeats from Repeat Masker, Polyadenylation cleavage sites from
Ozsolak et al. [23], Polyadenylation signals (Efficiency elements with consensus sequence TAYRTA and Positioning Element with consensus sequence AAWAAA) from Yeast Genome Pattern Matching [24].
Interestingly, also in most divergent intergenic regions we found very clear poly(A) signals inserted into to the typical organization repeat/EE/poly(A) previously described for 30-ends;
due to lack of 30-ends in these regions, this is unexpected. Sometimes the 30-end signals lie on
50UTR with sense or antisense orientation as respect to the adjacent ORF, as it happens for the
region within the divergentPUF3andYEH1genes (peakXII-3); in other cases signals are dis-tant from ORFs without any overlap with its components, as for region of peakX-3 within the divergentTDH2andMET3genes (see supportingS1 file, figure 3). These findings clearly indi-cate the presence of termination signals in absence of annotated transcriptional units; there-fore, peaks which are positioned at 30UTR may also mark non coding RNA genes, that
frequently may be antisense transcripts. A large quantity of antisense transcripts has been re-ported by both Ozsolak and Nagalakshmi studies [23,25] and they are estimated to cover in yeast the 80% of annotated ORFs. Antisense transcripts are in lower amount and so are charac-terized by a low number of 30-end signals; this motivates the presence of weak signals in peaks
which are not positioned at 30-end of ORFs.
Finally, concerning peaks lying inside an ORF, we remark that we found poly(AAT) codons coding for poly-Asnregion of polypeptide—instead of poly(A) signals.
On conclusion, TAYRTA elements, closely adjacent to cleavage site, have a non-canonical position in the peak-associated 30UTRs. To explore the concomitant occurrence of further
polyadenylation elements we performed a search for motifs by a MEME analysis [26], carried out on 183 peak regions. We identified, as expected, a TATATATATATATATATGTATAT motif (MEME statistical significance E-value = 4.6 × 10−585) in 145 peaks and a
ATTATTAT-TATTATTATTATTATTATT motif (MEME statistical significance E-value = 3.7 × 10−119) in
32 of them. Moreover, performing an analogous analysis on flexible regions±100 (i.e. peak re-gions, comprehensive of additional 100ntupstream and downstream), we found that in 183 sites the novel A/T-rich motif CTTCTTTTCTTC (MEME statistical significance E-value = 1.8 × 10⁻¹²) was found (see summarizingFig. 5). This last motif seems to have some
function since it again occurs in all interORF peak regions.
Overlapping 30UTRs are common in many genomes for genes orientated in a tail-to-tail
manner. They have been described in yeast, where they may depend on the dense arrangement of genes and possibly to cause transcriptional interference [27]. It is credible that, similarly, for unidirectional genes, failure to terminate transcription at the end of first gene will result in in-hibition of the next gene [28] and that this interference type could act as a regulatory system for the differential expression of adjacent gene pairs or for the sense-antisense transcription [29]. This suggests that the flexible elements inside 30UTR could characterize genes with
specif-ic types of termination, where peculiar signals are required possibly to regulate a programmed RNA interference.
Flexibility peaks are conserved and identify genes with decreased
mRNA stability
peak in at least one species and precisely 53 inS. paradoxus, 52 inS. mikatae, 50 inS. kudriav-zeviiand 49 inS. bayanus(seeS2 Table). Consistently, 51 out of the 55 conserved flexible se-quences are in regions with conserved synteny maintaining convergent transcription. The unidirectional regions conserving a flexibility peak in at least one species are 67 (81, 8%), all maintaining unidirectional transcription. Differently, the peak conservation in divergent inter-genic regions is significantly under-represented (50%; Fisher test:p= 0.002).
Of interest, the sequence alignments may show that conservation of peaks does not derive from the identity of intergenic sequence but is frequently consequent to a different organiza-tion of a high number of tandem repeats, as visible in the alignments of intergenic regions of peakIV-14 -unidirectional intergenic region betweenDBF4andDET1- and peakIV-9 -conver-gent intergenic region betweenRAD59andTSR1(see supportingS1 file, figure 4 and figure 5). These findings are indicative of an evolutive differentiation among species with a substantial conservation of flexibility peaks, even when there is a weak sequence conservation among the four genomes. Notably, 38 conserved flexibile ORFs (22 in converging and 11 in unidirectional transcription) were found to belong to the list of ohnologs i.e. paralogous genes arising from whole genome duplication [32] (seeS2 Table); in all cases, except one, only one member of ohnolog pair carries a flexibility peak in 30UTR. Usually, the pair members of ohnologs
under-went sequence modifications related to functional changes of different extent. Consequently, the peak sequence on one onholog may be a peculiar modification linked to functional diver-gence between pair members, possibly leading to sub- or neo-functionalization, which are pro-cesses already defined in yeast for a number of duplicated genes [33].
Fig 5. Significantly recurrent motifs identified by MEME algorithm [26] on peak regions.Motif 1 has the consensus sequence TATATATATATATATATGTATAT (E-value = 4.6 × 10−585) and is found in 145 peaks; motif 2 has the consensus sequence ATTATTATTATTATTATTATTATTATT (E-value = 3.7 × 10−119) and is found in 32 peaks. Motif 3 has the consensus sequence CTTCTTTTCTTC (E-value = 1.8 × 10⁻¹²) and is found in 183 peaks; in this case the analysis has been performed on peak sequence comprehensive of additional 100ntupstream and downstream.
The gene order arrangement has an evolutionary meaning [34]. In yeast, for instance, adja-cent genes are co-expressed to a significantly higher level than expected [35]; moreover, many highly co-expressed gene pairs take part in the same cellular processes [36]. Accordingly, the conservation of flexibility peaks in convergent or unidirectional pattern may be related to the peculiar structural or functional aspects of gene pairs expression.
The 30UTR regulates mRNA levels or stability via RNA-protein interactions with mRNA
degradation machinery. mRNA stability is a key regulatory step controlling gene expression and ultimately affects protein levels and function. Notably, long- and short-lived transcripts appear to have systematic differences in the EE, suggesting peculiar roles of this poly(A) signal in mRNA stability [37]. Therefore we checked whether the ORFs with peak in 30UTR could be
related with a differential mRNA stability. We took advantage of data about mRNA half-lives derived by Wang et al. [38] coming from mRNA decay profiles measured by microarrays fol-lowing transcriptional shut-off. Results were searched for the 175 ORFs with peak in 30UTR
compared with all other ORFs; they show that these ORFs are characterized by significant low-ering of both poly(A) half-life (t-test:p<2.5 × 10⁻²) and overall half-life (t-test:p<1 × 10⁻²),
indicating their production of unstable mRNAs (seeFig. 6). According to current models for major decay pathways, in yeast poly(A) shortening precedes the decay of the entire transcript and is a rate-limiting step [39]. Differential degradation of mRNAs can play an important role in setting the basal level of mRNA expression and how that mRNA level is modulated by envi-ronmental stimuli. It has been suggested that there is a general relationship between the stabili-ty of an mRNA and the physiological function of its product. Accordingly, mRNAs involved in
Fig 6. Comparison between overall mRNA decay rates (left) and poly(A) mRNA decay rates (right) in the 175 ORFs containing a 30UTR peak against all the other ORFs (data from [38]).For each group, the
histogram shows the mean value±standard error of the half-lives of mRNAs -either overall or poly(A). The half-lives are measured in minutes.
central metabolic functions are generally relatively long-lived, whereas those involved in regu-latory systems turn over relatively rapidly [38]. Consistently, flexibility peaks inside 30UTR
may be proposed to be part of the regulatory machinery of short-lived mRNAs.
Insights into the functions of ORFs with peak in 3
0UTR
The prevalent occurrence of unstable transcripts for ORFs with peak in 30UTR has obvious
im-plications for their possible regulatory roles within specific pathways. A functional analysis of all such 175 ORFs (listed inS3 Table) was carried out by identifying the Gene Ontology (GO) terms, using the YeastMine search engine [40]. The search reveals enrichment for 72 GO Bio-logical Process (p<1.1 × 10⁻²) as well as for 14 GO Molecular Function categories
(p<2.6 × 10⁻²), as reported inS3 Table. The first 10 GO BP terms (i.e. with lowest p-value)
are identified for a range of 31 to 86 ORFs per GO term, with a mean value of 62.3 ORFs per GO term. The GO MF term“binding”is identified for 101 ORFs.
Many GO terms concerned correlated processes or functions; so, they were processed by the web server REVIGO [41], using the default settings, in order to reduce their redundancy and summarize them in representative subsets the GO lists. The outcomes for Biological Process GO terms (visualized as treemap in supportingS1 file, figure 6, top) point out the presence of ORFs with role in cell cycle, phosphorus/organic cyclic compound/ nitrogen compound me-tabolism, phosphorylation reproduction, growth, response to acid, signaling. The 175 ORFs in-clude genes expressing key components of cell cycle progression and regulation:TUB2and
TUB3encodingαandβtubulins,CLB4andPHO80encoding cyclins,CDC53andAPC9 en-coding respectively the cullin structural protein of SCF complexes and a subunit of the Ana-phase-Promoting Complex/Cyclosome; moreover,AME1,RAD24,RAD59andSWE1involved in checkpoint maintenance, theFUS3,DIG2andSLT2encoding MAP-kinases and their regu-latorBMH1encoding the major isoform of 14-3-3 proteins. FurtherIME1, encoding a master regulator of meiosis and its convergent geneUME6, the key transcriptional regulator of early meiotic genes; moreoverMFA1, encoding the essential mating pheromone a-factor,STE50the major protein involved in mating response. Finally,ASG1,TSR1,ICT1,YAP1,PHO80,FRT1
andHAA1, regulators involved in the stress response. In accordance with the prevalent regula-tory functions revealed for Biological Process GO terms, the REVIGO outcomes for Molecular Function GO terms point out the presence of numerous ORFs with role in binding and in phosphatase and kinase activities (visualized as treemap in supportingS1 file, figure 6, bottom).
All these findings confirm the general involvement of ORFs with peak in 30UTR in
regulato-ry systems as well as their characterization by unstable transcripts. Moreover, these results seem to be coherent with the picture where regulatory function of genes is related to short half-life [38].
In budding yeast, the ability of genes to respond to environmental changes has been related to nucleosome occupancy in 50-ends and 30- ends [42,43]. Nucleosome free regions or
nucleo-some depleted regions (NFR or NDR) were observed at regulatory regions such as gene TSS and TTS, affecting binding of regulatory proteins, nucleosome ordering inside genes and tran-scriptional plasticity [44,45]. Since AT-rich sequences in defined contests have nucleosome-disfavoring property, we evaluated whether the AT-rich sequence in flexible peaks in 30UTR
30UTR of convergent genes, to be sure to consider only transcriptional terminators. Data on
ex-perimental nucleosome occupancy, reported by [47], together with nucleosome coverage pre-dicted by a model based onin vitrosequence data, were available through the SwissRegulon server [48,49]. We found that no peak shows altered nucleosome coverage. These are unex-pected results, as many papers describe nucleosome depletion in yeast gene 30-end termination.
Anyway, they contribute to circumstantiate the flexibility peak’s action, by suggesting that flex-ible peak may exert exert its function on polyadenylation by affecting phases not directly de-pendent on local chromatin structure, for example by modulating the nascent
mRNA structure.
Considering the gene function of peak associated ORFs, it is of interest that 14 of such ORFs have human orthologs involved in Mendelian diseases, detected from the Database of Human Disease Orthologs [50]; among these are theYPL164Cgene, whose human ortholog gene
MLH3encodes the DNA Mismatch Repair ProteinMlh32associated to HNPCC or Hereditary nonpolyposis colorectal cancer, theYOL071W(SDH5) gene whose human orthologSDHAF2
(aliasPGL2) is associated to familial paragangliomas 2 and the YPL204W gene whose human ortholog CSNK1A1 is associated to familial adenomatous polyposis. A complete description of the human ortholog genes related to diseases is reported inS4 Table, including, besides genes, related diseases and detailed references, the chromosome band localization and the coinciden-tal occurrence of common fragile sites. We highlight that the map position of the human ortho-log genes for eleven yeast genes is coincidental with that of known fragile sites [51]; moreover most of orthologs are implied in cancer development. These findings support the relationship between peak associated ORFs and fragile sites.
We remark also the presence ofNIT3among flexible yeast genes, a gene encoding one of two proteins that inS. cerevisiaehave similarity to the mouse and humanNitprotein, interact-ing with the humanFhittumor suppressor. Indeed, theFHITgene spansFRA3B, the most common human fragile site characterized for the presence of clusters of high flexibility peaks [52]. TheFHITgene has been suggested to have biological effects similar toNITand to share with it signaling pathways [53].
Discussion
In this paper we sistematically study the presence of flexibility peaks inS. cerevisiaegenome and explore their functional role.
Peaks show a strong co-localization with tandem repeats inside the 30UTR region of a
num-ber of ORFs and in particular with clusters of poly(A) signals. The peculiar architecture of re-peats and poly(A) signals inside peaks suggests that they could mark terminations in ORFs characterized by specific requirements in RNA cleavage. Consistently, we characterize the peak presence in ORFs as prevalently lying in regions where convergent transcription occurs. Peaks show a general conservation among differentSaccharomycesyeast species, but with a sequence variation in orthologous genes and a clear differentiation between paralogous genes, suggesting that they could be the result of an evolutive differentiation. We provide evidence that ORFs with peak in 30UTR have transcripts with lower half-life, item considered peculiar of genes
in-volved in regulatory systems with high turnover. More, we show that ORFs with peak in 30UTR share a number of common functions in biological processes such as cell cycle
regula-tion or stress response. From these findings we infer that flexibility peaks could play a funcregula-tion- function-al role as regulatory elements of gene expression for a peculiar set of genes. A regulation based on flexible sequences has not so far experimental foundation. However, we must consider that, while the impact of 30-end sequence on gene expression is well established, the understanding
mRNA metabolism, including mRNA sytability, translation and transport. PolyA signals act as substrate for cleavage and polyadenylation, for which RNA structure is also a critical determi-nant [54]. Then, RNA binding proteins regulate almost all post-transcriptional stages [55]. Specific sequence motifs in 30UTR have been identified in yeast implied in stabilization [56]
and stress response [57]. In particular, an increased AT-content upstream the polyadenylation site has been shown to modulate protein expression dynamics [58]. Thus, AT rich tandem re-peats and strand flexibility may be crucial in determining the interaction with polyadenylation factors, the mRNA structure and the accessibility of binding sites to multiple regulators. The notion that enriched tandem repeats inS. cerevisiaecould guide transcriptional modulation has been established for genes carrying very variable tracts of repeats in promoter; the involved genes have the general feature of interacting with the cell environment and so requiring rapid response changes [59,60]. Gene regulation differs greatly among related species, constituting a major source of phenotypic diversity. This issue assumes relevant significance for gene evolu-tion and tandem repeats have been considered able to drive transcripevolu-tional divergence and to confer evolvability to gene expression [61]. The variable repeat-based component of peaks in-side 30UTR may have similar origin and evolution. Tandem repeats are intrinsically prone to
variation having often units lost or gained by replication slippage [62]: Thus, long repeat stretches could be derived from the well-known polyadenylation enhancement elements; their potential in modulating gene expression regulation (termination efficiency and transcript half-life) may have been the feature that determined their fixation in peculiar genes.
These findings on yeast genome may be relevant for the knowledge of the relationship be-tween flexibility peaks and human genome instability. Common fragile sites are chromosome regions prone to breakage upon replication stress. To date, 22 fragile sites, among the 230 mapped in human lymphocytes, are known at molecular level but the molecular basis of fragili-ty remains unknown. They extend over megabase-long regions, tend to overlap very large genes and share a delayed completion of DNA replication. Recently, delayed replication has been correlated with a paucity of initiation events [63,64]. Notably, the authors found that FRA3B and FRA16D, the most active fragile sites in human lymphocytes, have low levels of fra-gility in fibroblasts, where instead other sites show very high frafra-gility; cell-type-specific replica-tion programs characterize the commitment to fragility at different loci in each cell-type, indicating that fragility is epigenetically defined.
These findings are consistent with the view that fragile sites serve a function; this is sup-ported by a number of indirect but relevant observations, the first of which is the conservation of fragile sites in synteny regions in the mouse and human genomes in all cases analyzed so far. The second one is their enrichment in genes related to cell cycle regulation, apoptosis or similar processes involved in cancer development [65]. More in detail, chromosomal fragile sites FRA3B and FRA16D, carrying the FHIT and WWOX genes respectively, that are genes playing a major role in apoptosis, show correlated expression and association with failure of apoptosis in lymphocytes from cancer patients [66]. In the same perspective, all fragile sites belong to networks of correlated breakage, comparable to gene expression pathways activated in re-sponse to damage stress; in particular the correlated fragile sites, analyzed in lymphocytes, are enriched in genes involved in immunity and inflammation, that are cell-type specific processes of lymphocytes [8].
evolution, these mechanisms may have been used in the commitment of the different genes to stress response, that is cell and tissue specific [67].
In this view, the regulatory role of flexibility peaks inferred for yeast genes could be actual also for human fragile genes, even if not necessarily involving 30-end termination process. The
extent of this correlation will be determined by a comparable genome-wide analysis on human sequence DNA flexibility.
Materials and Methods
Genomic data
We refer to completeSaccharomyces cerevisiaeRefSeq genome as obtained and annotated on SGD (SacCer2 assembly).
StabFlex algorithm
Experiments on conformational analyses of DNA require large numbers of conformations to be sampled. The conformation of DNA and its sequence dependence are mainly determined by the chemical structures of the base pairs and their interactions. The computational model by Sarai et al [68] examines DNA flexibility on the basis of base pairs interactions and the re-sults agree with available experimental observations. The algorithm STABFLEXis used to
calcu-late potential local variations in the DNA structure that are expressed as fluctuations in the twist angle (degrees,deg). It is a reimplementation of the TwistFlex software [11] and it is tar-geted to analyze very large sequences.
Flexibility values and peaks
The calculation of twist fluctuations is made for overlapping windows along a given sequence (window lengthL= 100bp, window shifts= 1bp). Within each window the flexibility is calcu-lated for consecutive dinucleotide steps, and the average value of all steps in the window is as-signed to the midpoint dinucleotide step. The flexibility is measured in degrees (deg) in the range [7deg;16deg].
An example of the output data is given inFig. 4. Peaks emerge spontaneously as short geno-mic regions where signal is extremely high. They are marked by arrows in the top picture. The complete flexibility data for a genomic region are plotted as a quantized signal and each flexi-bility value refers to 100bp, as shown in the bottom zoomed snapshot.
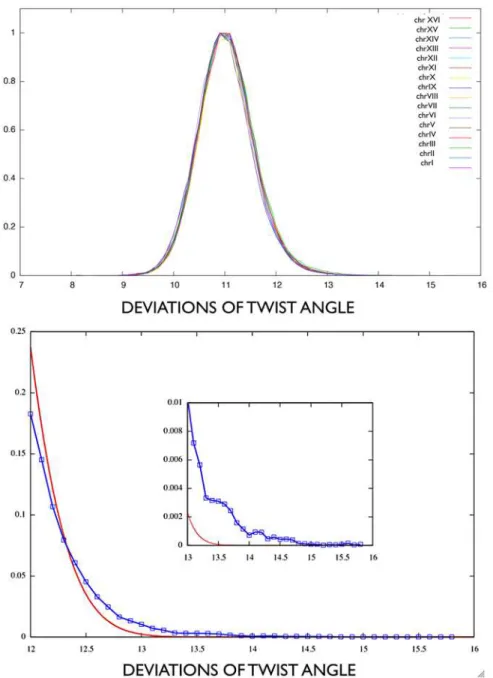
Fig. 7(top picture) shows the normalized distribution of windows flexibility values for all 16 chromosomes of yeast genome. As shown inFig. 7(bottom picture), for large flexibility values (greater than 12deg) the distribution is no longer Gaussian. The non-Gaussian tail identifies flexi-bility peaks, as follows. First, we pre-selected regions with outstanding flexiflexi-bility values, deviating significantly from the average (not lower thanS= mean+2×stand dev, which is 12.1 for all
chro-mosomes). That value 12.1 may be read as the point where Gaussianity is lost (see inplot in
Fig. 7). Regions correspond to the genomic sequence covered by overlapping consecutive windows simultaneously exceedingS. Second, such regions whose maximal flexibility value exceeds
thresh-oldθ= 13.8 are defined flexibility peaks. The threshold has been fixed as in literature [12,52].
Peaks have been denoted by peakIV-16, meaning the 16th peak within chrIV.
Statistical analysis
examine the significance of the association (contingency) between the two kinds of classifica-tion. At-test is a statistical hypothesis test in which the test statistic follows a Student’st distri-bution if the null hypothesis is supported. It can be used to determine if two sets of data are significantly different from each other, and is most commonly applied when the test statistic would follow a normal distribution if the value of a scaling term in the test statistic were known. For both tests, specificRprograms have been designed and implemented by the authors.
Fig 7. A: Flexibility values normalized distribution for all the yeast chromosomes.B: Upmost tail for flexibility values greater than 12deg(within chrXI), compared to a Gaussian distribution with same mean and standard deviation. In-plot: values greater than 13deg.
Differently, when external classifications have been used, statistical significance has been imported with the results. This applies to motifs found by MEME and to GO terms’ enrich-ment. As stated by the authors in [26], MEME usually finds the most statistically significant (low E-value) motifs first. The E-value of a motif is based on its log likelihood ratio, width, sites, the background letter frequencies, and the size of the training set. The E-value is an esti-mate of the expected number of motifs with the given log likelihood ratio, and with the same width and site count, that one would find in a similarly sized set of random sequences.
Concerning GO terms, as stated in [69], there are a number of different tools that provide enrichment capabilities. Tools differ in the algorithms they use, and the statistical tests they perform. All enrichment widgets list a term, a count and an associated p-value. The term can be something like a publication name or a GO term. The count is the number of times that term appears for objects in your list. The p-value is the probability that result occurs by chance, thus a lower p-value indicates greater enrichment without corrections. The p-value is calculat-ed using the Hypergeometric distribution.
Supporting information
A data repository for deviations of twist angle for complete yeast genome may be found in [13]. Individual chromosomal flexibility peaks’annotations in BED format, suitable for a visualisa-tion through the Genome Browser [15] are part of online supplementary material. The algo-rithm STABFLEXis available athttp://home.gna.org/stabflex/.
Supporting Information
S1 File. Peaks and ORFs involved.A.pdf file containing: a summary table on peaks and chro-mosome length; UCSC snapshots for peaks within unidirectional, convergent and divergent intergenic regions; alignments of peakIV-14 and peakIV-9 for Saccharomyces sensu stricto species; treemaps of the outcomes of REVIGO for Biological Process and Molecular Functions GO terms, referring to 175 ORFs characterized in 30UTR by a peak; results of the comparison
of peaks with the nucleosome depleted regions. (PDF)
S1 Table. Genomic features of peaks.A.csv table containing all genomic features correspond-ing to flexibility peaks.
(CSV)
S2 Table. Conservation of peaks.A.xls file containing six tables about conservation in Saccha-romyces sensu strictospecies, ohnologs and synteny of ORFs involved in flexibility peaks. (XLS)
S3 Table. ORFs involved in peaks in their 30UTR.A.xls file containing the list of 175 ORFs
with peak in 30UTR and tables about GO terms results.
(XLS)
S1 Archive. Peak positions.An archive containing the flexibility peaks positions, in.bed for-mat, suitable for UCSC visualization.
(ZIP)
Author Contributions
Conceived and designed the experiments: GM IS. Performed the experiments: GM. Analyzed the data: GM IS. Contributed reagents/materials/analysis tools: AB. Wrote the paper: GM IS RB.
References
1. van Loenhout MTJ, de Grunt MV, Dekker C (2012) Dynamics of DNA Supercoils. Science 338: 84–97. doi:10.1126/science.1225810
2. Glover TW (2006) Common fragile sites. Cancer Lett 232: 4–12. doi:10.1016/j.canlet.2005.08.032
PMID:16229941
3. Zlotorynski E, Rahat A, Skaug J, Ben-Porat N, Ozeri E, et al. (2003) Molecular Basis for Expression of Common and Rare Fragile Sites. Mol Cell Biol 23: 7143–7151. doi:10.1128/MCB.23.20.7143-7151. 2003PMID:14517285
4. Fungtammasan A, Walsh E, Chiaromonte F, Eckert KA, Makova KD. (2012) A genome-wide analysis of common fragile sites: what features determine chromosomal instability in the human genome?. Ge-nome Res 22: 993–1005. doi:10.1101/gr.134395.111PMID:22456607
5. Zlotorynski E, Rahat A, Skaug J, Ben-Porat N, Ozeri E, Hershberg R, Levi A, Scherer SW, Margalit H, Kerem B (2003) Molecular basis for expression of common and rare fragile sites. Mol Cell Biol 23(20): 7143–51. doi:10.1128/MCB.23.20.7143-7151.2003PMID:14517285
6. Casper AM, Nghiem P, Arlt MF, Glover TW (2002) ATR regulates fragile site stability. Cell 111(6):779– 89. doi:10.1016/S0092-8674(02)01113-3PMID:12526805
7. Debatisse M, Le Tallec B, Letessier A, Dutrillaux B, Brison O (2012) Common fragile sites: mechanisms of instability revisited Trends Genet 205(2):221–235.
8. Re A, Cora D, Puliti AM, Caselle M, Sbrana I (2006) Correlated fragile site expression allows the identi-fication of candidate fragile genes involved in immunity and associated with carcinogenesis. BMC Bio-informatics 7: 413. doi:10.1186/1471-2105-7-413PMID:16981993
9. Zhang H, Freudenreich CH (2007) An AT-Rich Sequence in Human Common Fragile Site FRA16D Causes Fork Stalling and Chromosome Breakage in S. cerevisiae. Molecular Cell 27: 367–379. doi:
10.1016/j.molcel.2007.06.012PMID:17679088
10. Puliti AM, Rizzato C, Conti V, Bedini A, Gimelli G, et al. (2010) Low-copy repeats on chromosome 22q11.2 show replication timing switches, DNA flexibility peaks and stress inducible asynchrony, shar-ing instability features with fragile sites. Mutat Res 686: 74–83. doi:10.1016/j.mrfmmm.2010.01.021
PMID:20138061
11. Ben-Porat N, Zlotorynski E, Kerem B (1997). URLhttp://margalit.huji.ac.il/TwistFlex/
12. Mishmar D, Rahat A, Scherer SW, Nyakatura G, Hinzmann B, et al. (1998) Molecular characterization of a common fragile site (FRA7H) on human chromosome 7 by the cloning of a simian virus 40 integra-tion site. Proc Natl Acad Sci USA 95: 8141–8146. doi:10.1073/pnas.95.14.8141PMID:9653154
13. DATAFLEX (2014).URLhttp://figshare.com/articles/Yeast%5Fgenome%5Fflexibility%5Fdata/ 1327440
14. SGD. Saccharomyces Genome Database project. URLhttp://www.yeastgenome.org. 15. UCSC. Genome Browser. URLhttp://genome.ucsc.edu.
16. Lieb JD, Liu X, Botstein D, Brown P (2001) Promoter-specific binding of Rap1 revealed by genome-wide maps of protein-DNA association. Nat Genet 28: 327–334. doi:10.1038/ng569PMID:11455386
17. Tuller T, Ruppin E, Kupiec M (2009) Properties of untranslated regions of theS. cerevisiaegenome. BMC Genomics 10: 391. doi:10.1186/1471-2164-10-391PMID:19698117
18. Zhao J, Hyman L, Moore C (1999) Formation of mRNA 3’ends in eukaryotes: mechanism, regulation, and interrelationships with other steps in mRNA synthesis. Microbiol Mol Biol Rev 63: 405–445. PMID:
10357856
19. Guo Z, Russo P, Yun DF, Butler JS, Sherman F (1995) Redundant 3’-forming signals for the yeast CYC1 mRNA. Proc Natl Acad Sci USA 92: 4211–4214. doi:10.1073/pnas.92.10.4211PMID:7753784
20. Guo Z, Sherman F (1995) 3’-end-forming Signals of Yeast mRNA. Molecular and Cellular Biology 11: 5983–5990.
22. Perez-Canadillas JM (2006) Grabbing the message: structural basis of mRNA 3[prime]UTR recognition by Hrp. The EMBO Journal 25: 3167–3178. doi:10.1038/sj.emboj.7601190PMID:16794580
23. Ozsolak F, Kapranov P, Foissac S, Kim SW, Fishilevich E, et al. (2010) Comprehensive Polyadenyla-tion Site Maps in Yeast and Human Reveal Pervasive Alternative PolyadenylaPolyadenyla-tion. Cell 143: 1018– 1029. doi:10.1016/j.cell.2010.11.020PMID:21145465
24. URLhttp://www.yeastgenome.org/cgi-bin/PATMATCH/nph-patmatch.
25. Nagalakshmi U, Wang Z, Waern K, Shou C, Raha D, et al. (2008) The transcriptional landscape of the yeast genome defined by RNA sequencing. Science 320: 5881. doi:10.1126/science.1158441
26. Bailey TL, Elkan C (1994) Fitting a mixture model by expectation maximization to discover motifs in bio-polymers. In: Second International Conference on Intelligent Systems for Molecular Biology, AAAI Press, Menlo Park, California. pp. 28-36. URLhttp://meme.sdsc.edu/meme4_6_1/intro.html. 27. Prescott EM, Proudfoot NJ (2002) Transcriptional collision between convergent genes in budding
yeast. Proc Natl Acad Sci USA 99: 8796–8801. doi:10.1073/pnas.132270899PMID:12077310
28. Shearwin KE, Callen BP, Egan JB (2005) Transcriptional interference: A crash course. Trends Genet 21: 339–345. doi:10.1016/j.tig.2005.04.009PMID:15922833
29. Gelfand B, Mead J, Bruning A, Apostolopoulos N, Tadigotla V, et al. (2011) Regulated Antisense Tran-scription Controls Expression of Cell-Type-Specific Genes in Yeast. Mol Cell Biol 31: 1701–1709. doi:
10.1128/MCB.01071-10PMID:21300780
30. Scannell D, Zill OA, Rocas A, Payen C, Dunham MJ, et al. (2011) The awesome power of yeast evolu-tionary genetics: New genome sequences and strain resources for the Saccharomyces sensu stricto genus. Genes, Genomes, Genetics 1: 11.
31. Saccharomyces Sensu Strictu. URLwww.SaccharomycesSensuStricto.org.
32. Byrne KP, Wolfe KH (2005) The Yeast Gene Order Browser: Combining curated homology and synte-nic context reveals gene fate in polyploid species. Genome Research 15: 1456–1461. doi:10.1101/gr. 3672305PMID:16169922
33. Tirosh I, Barkaj N (2007) Comparative analysis indicates regulatory neofunctionalization of yeast dupli-cates. Genome Biology 8: R50. doi:10.1186/gb-2007-8-4-r50PMID:17411427
34. Hurst L, et al (2004) The evolutionary dynamics of eukaryotic gene order. Nat Rev Genet 5: 299–310. doi:10.1038/nrg1319PMID:15131653
35. Kruglyak S, Tang H (2000) Regulation of adjacent yeast genes. Trends Genet 16: 109–111. doi:10. 1016/S0168-9525(99)01941-1PMID:10689350
36. Batada NN, Urrutia AO, Hurst LD (2007) Chromatin remodelling is a major source of coexpression of linked genes in yeast. Trends Genet 23: 10. doi:10.1016/j.tig.2007.08.003
37. Graber JH (2003) Variations in yeast 3’-processing cis-elements correlate with transcript stability. Trends Genet 19: 473–476. doi:10.1016/S0168-9525(03)00196-3PMID:12957538
38. Wang Y, Liu CL, Storey JD, Tibshirani RJ, Herschlag D, et al. (2002) Precision and functional specificity in mRNA decay. Proc Natl Acad Sci USA 99: 5860–5865. doi:10.1073/pnas.092538799PMID:
11972065
39. Beelman CA, Parker R (1995) Degradation of mRNA in eukaryotes. Cell 81: 179–183. doi:10.1016/ 0092-8674(95)90326-7PMID:7736570
40. URLhttp://yeastmine.yeastgenome.org.
41. Supek F, Bosnjak M, Skunca N, Smuc T (2011). REVIGO summarizes and visualizes long lists of gene ontology terms. URLhttp://revigo.irb.hr/.
42. Tirosh I, Barkai N (2008) Two strategies for gene regulation by promoter nucleosomes. Genome Res 18(7):1084–91 doi:10.1101/gr.076059.108PMID:18448704
43. Vaillant C, Palmeira L, Chevereau G, Audit B, d’Aubenton-Carafa Y, et al. (2010) A novel strategy of transcription regulation by intragenic nucleosome ordering. Genome Res 20(1):59–67. doi:10.1101/ gr.096644.109PMID:19858362
44. Segal E, Widom J (2009) What controls nucleosome postions?. Trends Genet 25(8):335–43. doi:10. 1016/j.tig.2009.06.002PMID:19596482
45. Milani P, Chevereau G, Vaillant C, Audit B, Haftek-Terreau Z, et al. (2009) Nucleosome positioning by genomic excluding-energy barriers. Proc Natl Acad USA 106(52):22257–62. doi:10.1073/pnas. 0909511106
46. Field Y, Kaplan N, Fondufe-Mittendorf Y, Moore IK, Sharon E, et al. (2008) Distinct Modes of Regulation by Chromatin Encoded through Nucleosome Positioning Signals PLoS Comput Biol 4(11): e1000216 47. Lee W1, Tillo D, Bray N, Morse RH, Davis RW, et al. (2007) A high-resolution atlas of nucleosome
48. URLwww.swissregulon.unibas.ch/ozonov.
49. Ozonov EA, van Nimwegen E (2013) Nucleosome free regions in yeast promoters result from competi-tive binding of transcription factors that interact with chromatin modifiers. PLoS Comput Biol 9(8): e1003181 doi:10.1371/journal.pcbi.1003181PMID:23990766
50. O’Brien KP, Westerlund I, Sonnhammer EL (2004) OrthoDisease: a database of human disease ortho-logs. Hum Mutat 24: 112–119. doi:10.1002/humu.20068PMID:15241792
51. Mrasek K, Schoder C, Teichmann AC, Behr K, Franze B, et al (2010) Global screening and extended nomenclature for 230 aphidicolin-inducible fragile sites, including 61 yet unreported ones. Int J Oncol 36(4): 929–40. PMID:20198338
52. Mimori K, Druck T, Inoue H, Alder H, Berk L, et al. (1999) Cancer-specific chromosome alterations in the constitutive fragile region FRA3B. Proc Natl Acad Sci USA 96: 7456–7461. doi:10.1073/pnas.96. 13.7456PMID:10377436
53. Semba S, Han S, Qin HR, McCorkell KA, Iliopoulos D (2006) Biological functions of mammalian Nit1, the counterpart of the invertebrate NitFhit Rosetta stone protein, a possible tumor suppressor. J Biol Chem 281: 28244–28253. doi:10.1074/jbc.M603590200PMID:16864578
54. Graveley BR, Fleming ES, Gilmartin GM (1996) RNA structure is a critical determinant of poly(A) site recognition by cleavage and polyadenylation specificity factor. Mol Cell Biol 16(9):4942–51. PMID:
8756653
55. Hogan DJ, Riordan DP, Gerber AP, Herschlag D, Brown PO (2008) Diverse RNA-binding proteins inter-act with functionally related sets of RNAs, suggesting an extensive regulatory system. PLoS Biol 6(10): e255. doi:10.1371/journal.pbio.0060255PMID:18959479
56. Shalgi R, Lapidot M, Shamir R, Pilpel Y (2005) A catalog of stability-associated sequence elements in 3’UTRs of yeast mRNAs Genome Biol 6(10):R86
57. Yang Y, Umetsu J, Lu ZJ (2014) Global signatures of protein binding on structured RNAs in Saccharo-myces cerevisiae Sci China Life Sci 57(1):22–35
58. Shalem O, Carey L, Zeevi D, Sharon E, Keren L, et al. (2013) Measurements of the impact of 3’end se-quences on gene expression reveal wide range and sequence dependent effects. PLoS Comput Biol 9 (3):e1002934 doi:10.1371/journal.pcbi.1002934PMID:23505350
59. Vinces MD, Legendre M, Caldara M, Hagihara M, Verstrepen KJ (2009) Unstable tandem repeats in promoters confer transcriptional evolvability. Science 324: 1213–1216. doi:10.1126/science.1170097
PMID:19478187
60. Tirosh I, Barkai N, Verstrepen KJ (2009) Promoter architecture and the evolvability of gene expression. J Biol 8: 95. doi:10.1186/jbiol204PMID:20017897
61. Gemayel R, Vinces MD, Legendre M, Verstrepen KJ (2010) Variable tandem repeats accelerate evolu-tion of coding and regulatory sequences. Annu Rev Genet 44: 445–477. doi: 10.1146/annurev-genet-072610-155046PMID:20809801
62. Lai Y, Sun F (2003) The relationship between microsatellite slippage mutation rate and the number of repeat units. Mol Biol Evol 20(12):2123–31. doi:10.1093/molbev/msg228PMID:12949124
63. Letessier A, Millot GA, Koundrioukoff S, Lachags AM, Vogt N, et al. (2011) Cell-type-specific replication initiation programs set fragility of the FRA3B fragile site. Nature 470(7332):120–3. doi:10.1038/ nature09745PMID:21258320
64. Le Tallec B, Dutrillaux B, Lachages AM, Millot GA, Brison O, et al. (2011) Molecular profiling of common fragile sites in human fibroblasts. Nat Struct Mol Biol 18(12):1421–3.
65. Durkin SG, Glover TW (2007) Chromosome fragile sites. Annu Rev Genet 41:169–92. doi:10.1146/ annurev.genet.41.042007.165900PMID:17608616
66. Sbrana I, Veroni F, Nieri M, Puliti AM, Barale R (2006) Chromosomal Fragile Sites FRA3B and FRA16D Show Correlated Expression and Association with Failure of Apoptosis in Lymphocytes from Patients with Thyroid Cancer. Genes, Chromosomes & Cancer 45: 429–436. doi:10.1002/gcc.20305
67. Coates PJ, Lorimore SA, Wright EG (2005) Cell and tissue responses to genotoxic stress. J Pathol 205 (2):221–35
68. Sarai A, Mazur J, Nussinov R, Jernigan RL (1989) Sequence Dependence of DNA Conformational Flexibility. Biochemistry 28: 7842–7849.

![Fig 5. Significantly recurrent motifs identified by MEME algorithm [26] on peak regions](https://thumb-eu.123doks.com/thumbv2/123dok_br/18409800.359633/9.918.300.784.117.493/fig-significantly-recurrent-motifs-identified-meme-algorithm-regions.webp)
![Fig 6. Comparison between overall mRNA decay rates (left) and poly(A) mRNA decay rates (right) in the 175 ORFs containing a 3 0 UTR peak against all the other ORFs (data from [38])](https://thumb-eu.123doks.com/thumbv2/123dok_br/18409800.359633/10.918.304.843.549.951/comparison-overall-decay-rates-decay-rates-right-containing.webp)