Pdx1 Is Post-Translationally Modified
In vivo
and Serine
61 Is the Principal Site of Phosphorylation
Thomas Frogne1, Kathrine Beck Sylvestersen2, Stefan Kubicek3, Michael Lund Nielsen2, Jacob Hecksher-Sørensen1*
1Department of Beta-cell Regeneration, Hagedorn Research Institute, Gentofte, Denmark,2Center for Protein Research, University of Copenhagen, Copenhagen, Denmark,3Research Center for Molecular Medicine of the Austrian Academy of Sciences, Vienna, Austria
Abstract
Maintaining sufficient levels of Pdx1 activity is a prerequisite for proper regulation of blood glucose homeostasis and beta cell function. Mice that are haploinsufficient for Pdx1 display impaired glucose tolerance and lack the ability to increase beta cell mass in response to decreased insulin signaling. Several studies have shown that post-translational modifications are regulating Pdx1 activity through intracellular localization and binding to co-factors. Understanding the signaling cues converging on Pdx1 and modulating its activity is therefore an attractive approach in diabetes treatment. We employed a novel technique called Nanofluidic Proteomic Immunoassay to characterize the post-translational profile of Pdx1. Following isoelectric focusing in nano-capillaries, this technology relies on a pan specific antibody for detection and it therefore allows the relative abundance of differently charged protein species to be examined simultaneously. In all eukaryotic cells tested we find that the Pdx1 protein separates into four distinct peaks whereas Pdx1 protein from bacteria only produces one peak. Of the four peaks in eukaryotic cells we correlate one of them to a phosphorylation Using alanine scanning and mass spectrometry we map this phosphorylation to serine 61 in both Min6 cells and in exogenous Pdx1 over-expressed in HEK293 cells. A single phosphorylation is also present in cultured islets but it remains unaffected by changes in glucose levels. It is present during embryogenesis but is not required for pancreas development.
Citation:Frogne T, Sylvestersen KB, Kubicek S, Nielsen ML, Hecksher-Sørensen J (2012) Pdx1 Is Post-Translationally ModifiedIn vivoand Serine 61 Is the Principal Site of Phosphorylation. PLoS ONE 7(4): e35233. doi:10.1371/journal.pone.0035233
Editor:Massimo Federici, University of Tor Vergata, Italy
ReceivedJune 14, 2011;AcceptedMarch 14, 2012;PublishedApril 11, 2012
Copyright:ß2012 Frogne et al. This is an open-access article distributed under the terms of the Creative Commons Attribution License, which permits unrestricted use, distribution, and reproduction in any medium, provided the original author and source are credited.
Funding:This work was made possible by funding from the JDRF www.jdrf.org; grant#26-2008-639 (to JH-S) and EU FP7 Marie Curie Fellowship www. mariecurie.org PIOF-GA-2008-21135 (SK). The funders had no role in study design, data collection and analysis, decision to publish, or preparation of the manuscript.
Competing Interests:The Hagedorn Research Institute is affiliated to Novo Nordisk. JH-S owns equity shares in Novo Nordisk A/S. JH-S is 100% employed by Novo Nordisk. TF is 100% funded by a grant from JDRF. This does not alter the authors’ adherence to all the PLoS ONE policies on sharing data and materials.
* E-mail: jhes@hagedorn.dk
Introduction
Pancreatic and duodenal homeobox 1(Pdx1) also known asIpf1and
Stf1is a master regulator of pancreas development [1,2,3]. Pdx1
was first cloned and described inXenopus, asXlhbox8, where it was shown to be expressed in the developing endoderm and pancreas [4]. In mouse embryosPdx1 is expressed in the endoderm from e8.5 where it defines the regions that will form the dorsal and ventral pancreas [1,2,5]. The evidence thatPdx1 is instrumental for pancreas development comes from both mouse and human where depletion of a functional Pdx1 protein results in pancreas agenesis [1,2,6]. Conversely, over expression of Pdx1 in endoder-mal cells outside the presumptive pancreas can activate events reminiscent of pancreas development. In chicken embryos forced expression of Pdx1 in the developing endoderm partially induces pancreas development. Thus, ectopic Pdx1 quenches the expres-sion of non-pancreatic genes such as Sox2 and Cdx in regions outside the presumptive pancreas [7] while it induces pancreatic markers likeNkx6.1[8]. InXenopus, over expression of a modified
Pdx1, carrying the VP16 transcriptional activation domain can cause conversion of liver to pancreas [9].
Postnatally Pdx1 is expressed in the mature b-cell where it serves as an important regulator of glucose homeostasis [10,11]. In humans, mutations in the Pdx1 gene have been associated
for Pdx1 [23]. It is unclear why reductions in Pdx1 protein levels has such deteriorating effects on the b-cell, however, a recent study suggests that it may be linked to mitochondrial dysfunction. Thus preventing opening of the mitochondrial permeability transition pore through deletion of thePeptidyl-prolyl cis-trans isomerase (Ppif) gene restores many of the defects caused by Pdx1 insufficiency [24].
Since even subtle changes in Pdx1 levels dramatically impacts
b-cell performance it is generally acknowledged that the biological activity of Pdx1 tightly regulated at the post-translational level. Fitting this hypothesis at least three different post-translational modifications have been reported on Pdx1 including phosphoryla-tion [25,26,27,28,29,30,31,32,33,34,35], glycosylaphosphoryla-tion [36] and sumoylation [37]. Phosphorylation, in particular, has been shown to regulate several important aspects of Pdx1 activity in response to elevated glucose levels, such as nuclear-cytoplasmic shuttling [26,27], DNA binding [27,28,38] and interactions with transcrip-tional co-factors [25,39]. Several different kinases have been shown to phosphorylate Pdx1 and to date five different residues have been suggested to be Pdx1 kinase substrates. Amino acids S61 or S66 are phosphorylated by Glycogen synthase kinase 3 (Gsk3) and ERK1/2 [29,31] and this modification targets Pdx1 for proteasomal degradation in response to oxidative stress [29]. Amino acids S268 and S272 (S269 and S273 in mouse) are phosphorylated by Hipk2 [40] or in response to low glucose [30] and T11 is phosphorylated by DNA-dependent kinase in response to DNA damage [33]. Yet, despite the attention several important questions remain unan-swered. For example it is unclear to what extent Pdx1 is modified under normal conditions? How many PTMs are present at a given time? How do different PTMs influence each other? How is the endogenous Pdx1 modified in respond to various treatments?
Here we have employed a novel technique called nanofluidic proteomic immunoassay (NIA) [41,42] to study post-translation-al modifications of Pdx1 in various cell types. NIA employs isoelectric focusing to separate differently charged protein species of the same protein which is then detected using a pan-specific antibody. A particular advantage of this technology is that experiments can be carried out from scarce samples [42]. We have therefore been able to identify and study different protein species of endogenous Pdx1 in cell lines, during development and in mature b-cells. In eukaryotic cells we observe that the Pdx1 protein separates into four peaks, while Pdx1 purified from bacteria only produces a single peak. There is no apparent difference in SDS-PAGE mobility between mammalian and bacterial Pdx1 proteins and we therefore conclude that the mammalian profile is the result of post-translational modifications. Treating the Pdx1 protein with phosphatase revealed the presence of one primary phosphory-lation which was mapped to serine 61 using both alanine scanning and mass spectrometry. Remarkably, Pdx1 protein obtained from, embryonic tissue, adult pancreas, isolated islets,
bTC cells, Min6 cells and from Pdx1 over-expressed inaTC, L and HEK293 cells produces almost identical profiles. Since the single phosphorylation is present in all cells and tissues tested we speculate that it is mediated by a ubiquitously expressed kinase rather than a specific signaling pathway. In line with this we were unable to demonstrate any alterations in the Pdx1 profile following high or low glucose treatment of mouse islets in culture. And although we confirm that Pdx1 is phosphorylated during embryonic pancreas development, we find that Pdx1S61A is fully capable of inducing ectopic Nkx6.1 expression and budding of pancreatic like structures.
Results
Over Expressed Pdx1 Appear as Multiple Protein Species
To investigate the extent of post-translational modifications on the endogenous Pdx1 protein we applied a novel technology called NIA [41,42]. Isoelectric focusing is used to separate differently charged species of a protein which subsequently can be detected using a pan-specific antibody that recognizes these species with similar affinity (assuming equal antibody binding to the different protein species). The raw data can be examined as bands on a gel or as peaks (Fig. 1A) where the relative abundance of the different protein species can be estimated from the height of the peaks or as the area under the curves (Fig. 1B). To precisely determine which peaks can be assigned to Pdx1 we performed western blot and NIA analysis on lysates from cells over-expressing wild type mouse Pdx1 (Pdx1WT), using two different antibodies against Pdx1. A polyclonal goat-a-Pdx1 antibody and a monoclonal mouse-a-Pdx1 antibody [43]. When used for western we found that both antibodies specifically detected a 40 kDa band in cells transfected with Pdx1WT(Fig. 1C). When the same lysates was used for NIA the empty vector control displayed no peaks whereas both antibodies produced peaks at pI 5.9, 6.0, 6.1, 6.3 and 6.4 in Pdx1 transfected cells (Fig. 1D and E). The only difference was the 5.8 peak which is absent when using the mouse antibody.
Pdx1 is Subject to Post-translational Modification in Mammalian Cells
5.9 peak is the Pdx13xFLAGprotein. NIA analysis of Pdx13xFLAG purified from HEK cells resulted in four specific peaks at 5.1, 5.2, 5.3 and 5.5 which are similar to those observed when analyzing the lysates without the IP step (Fig. 2H). As for IP of Pdx1WT, lower intensity bands is also evident for Pdx13xFLAGand we believe that the peaks at pI 5.8 and 5.9 corresponds to the 6.9 and 7.2 peaks found for Pdx1WT. In contrast the 5.6 peak is found in both control and Pdx1 expressing cells and this peak does not move in the response to the 3xFLAG tag, indicating that it is unspecific binding of the goat-a-Pdx1 antibody.
Lastly, to rule out that differences in buffer composition following the IP could influence the migration of Pdx1 in the nano capillaries we carried out a series of experiments where the purified Pdx1 from bacteria or mammalian cells where spiked directly into lysates from HEK cells transfected with EGFP or Pdx13xFLAG (Fig. S1). These results strongly indicate that the bacterial Pdx1 generates one single peak with a pI that is different from the Pdx1 expressed in mammalian cells, thus confirming the presence of post-translational modifications on Pdx1 when expressed in mammalian cells.
Endogenous Pdx1 also Exist in Multiple Isoforms
Having confirmed that we are able to detect multiple isoforms of Pdx1 following over-expression in mammalian cell lines we went on to test if the NIA analysis could be used to detect endogenous Pdx1 protein. We therefore analyzed the Pdx1 profile from various cell types and tissues known to be positive or negative for Pdx1 expression. Another question we wanted to address was to what extent the Pdx1 profile is influenced by protein-protein interactions. Normally, the NIA
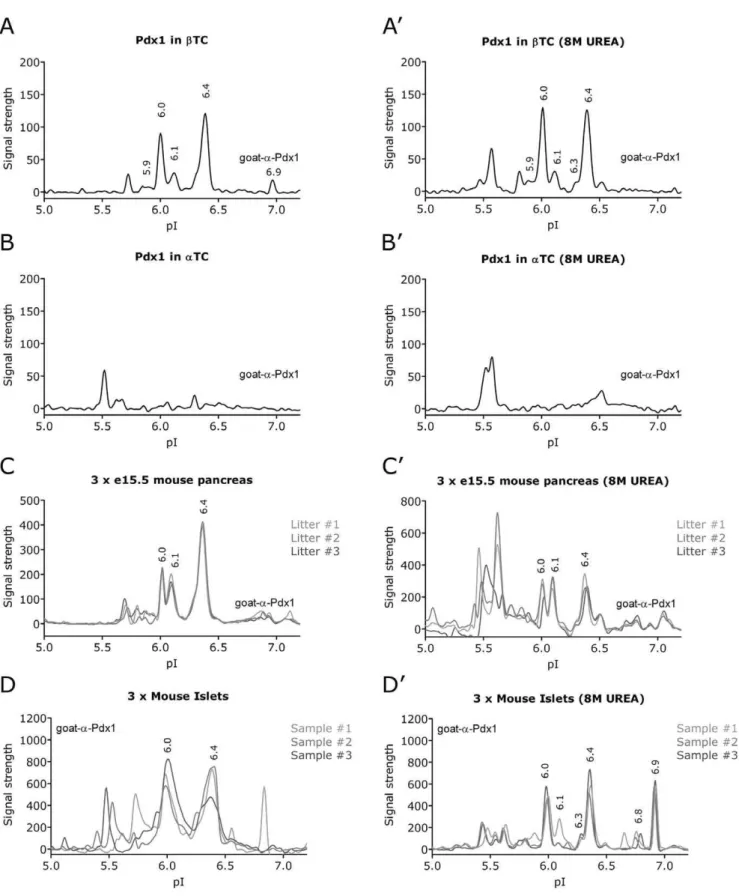
analysis is conducted in a mild Hepes buffer (HNG) and it is therefore possible that some of the Pdx1 peaks we observe represent a protein complex. We therefore compared the profiles of endogenous Pdx1 in the HNG buffer (Fig. 3A-D) with that obtained in 8 M urea which will denature most interactions (Fig. 3A’-D’). According to the manufactures instruction urea treatment gives better resolution but reduces signal intensity. Using the goat-a-Pdx1 antibody on bTC cells the characteristic 6.0, 6.1 and 6.4 peaks were clearly seen in both buffers (Fig. 3A, 3A’). To a lesser extend also the 5.9 peak and perhaps the 6.3 as a faint shoulder on the left side foot of the 6.4 peak. The 6.9 peak was small but significantly present in HNG buffer only, whereas the 6.5 peak was only observed in the urea treated samples. The peak at 5.8 which was only detected with the goat-a-Pdx1 antibody was present in both buffers while the non-pdx1 peak at 5.6 was only observed with urea. InaTC cells which express little or no Pdx1, the strongest peaks were at pI 5.5 and 5.6 and perhaps also at 6.5 in urea treated lysate (Fig. 3B, 3B’). In embryonic tissue Pdx1 is expressed in the pancreatic endoderm and in three independent lysates from isolated embryonic pancreata we observed a profile very similar tobTC with the strongest peaks at pI 6.0, 6.1 and 6.4 (Fig. 3C, 3C’). This observation was very reproducible in both buffers although again the peaks around 5.6 became more prominent in 8M urea. Lastly, we compared the profile obtained from three independent samples of isolated mouse islets (Fig. 3D, 3D’). Here we observed increased variation between the different samples, but interestingly in the urea treatment revealed a strong peak at pI 6.9 in addition to the characteristic 6.0 and 6.4 peaks. We also detected some smaller peaks around 5.9, 6.1 and 6.8. Lastly, we analyzed the different
Figure 1. Over expression of Pdx1 in L and HEK293 cells.A) Raw data from the NIA analysis can be visualized as gel-bands or as a graph. B) The intensity of the signal can be estimated based on the height of the peak or the area under the curve. C-E) Over expression of empty vector or pdx1WTin L cells followed by western blotting using a goat-a-Pdx1 (C, top) or a mouse-a-Pdx1 antibody (C, bottom) and NIA analysis of the same lysates using the goat-a-Pdx1 (D) or mouse-a-Pdx1 antibody (E).
doi:10.1371/journal.pone.0035233.g001
samples with the mouse-a-Pdx1 antibody (Fig. S2), confirming the peaks at 6.0, 6.1 and 6.4 as well as the islet enriched 6.9 peak.
In summary the NIA analysis of three cell types known to express endogenous Pdx1 produced several peaks which varied slightly between the different cell types. However, the overall profile is very similar to that obtained using over-expression.
Both Endogenous and Exogenous Pdx1 Carry One Principal Phosphorylation
Depending on expression levels and cell types we detect at least four or five differentially charged isoforms of Pdx1 in various cell types and tissues while bacterially generated Pdx1 only produces a single peak. This strongly suggests that Pdx1 is subject to post translational modifications in mammalian cells. Numerous studies have shown that Pdx1 is phosphorylated [25,26,27,28,29,30,31,32,33,34] and to
Figure 2. The Pdx1 NIA profile differs between bacterial and mammalian cells.First, a comparison of the basal NIA profile of pdx1WTand pdx13xFLAGprotein from transfected HEK293 cells by western blotting (A) and NIA (B), employing the goat-a-Pdx1 antibody. The amino acids in the 3xFLAG tag are negatively charged and in agreement a left shift of the NIA profile is observed. Results are representative of at least three independent experiments. Then a comparison of purified Pdx1WTand Pdx13xFLAGprotein from E.Coli BL21 cells versus purified protein from HEK293 cells. Plasmids coding for the indicated proteins were expressed in BL21or HEK293 cells and purified by immunoprecipitation using a monoclonal mouse-a-Pdx1 antibody coupled to protein G beads (Pdx1WT) or with anti-FLAG beads (Pdx13xFLAG). As negative control cell lysate from non transformed bacteria or empty vector (EV) transfected HEK293 cells were ran in parallel. Purified protein from Pdx1WTexpressing and non expressing BL21 and HEK293 cells were analyzed by coomassie staining and western blot (C) and by NIA, (D) BL21, (E) HEK293. F-H) Similar analysis for Pdx13xFLAG. These experiments were performed at least twice obtaining similar results.
Figure 3. The NIA profile of endogenous Pdx1.Analysis of cells with know endogenous expression of Pdx1. As negative control we included aTC cells which express little or no Pdx1. To rule out the possibility of protein-protein complexes affecting the NIA profile, the lysates were diluted 20 fold in a mild Hepes buffer (HNG) (A-D) or in 8 M urea (A’-D’) prior to NIA analysis. Using the goat-a-Pdx1 antibody, the characteristic 6.0, 6.1 and 6.4 peaks and to a lesser extend also the 6.3 peak is observed inbTC (A, A’) but not inaTC (B, B’). To show the reproducibility of the NIA assay between the HNG and 8 M urea we compared the Pdx1 profile from e15.5 mouse pancreas obtained from three different litters (C, C’) and from 3 different preparations of purified mouse islets (D, D’). We also performed these analyses with the mouse-a-Pdx1 antibody (Fig. S2), confirming the dominant peaks at 6.0, 6.1 and 6.4 as well as the islet enriched 6.9 peak.
doi:10.1371/journal.pone.0035233.g003
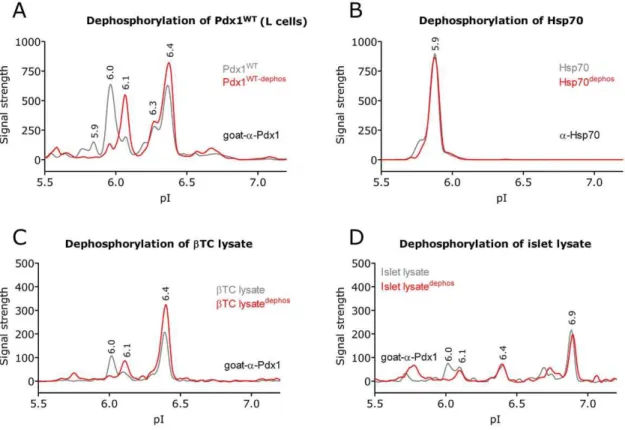
test this, L cells were transfected with Pdx1 and the lysates were subsequently incubated with or without Lambda phosphatase and subjected to NIA analysis. The NIA profile from non-treated and phosphatase treated lysates were superimposed and revealed that the phosphatase treatment shifted the 6.0 peak to 6.1 while the 6.3 and 6.4 peaks remained unaffected (Fig. 4A). This suggests that Pdx1 harbors one primary phosphorylation represented by the 6.0 peak. The smaller peaks at 5.9 are also affected by the phosphatase treatment and it is likely that they represent additional but less abundant phosphorylations. To validate that the phosphatase treatmentper se
did not affect the NIA profile we analyzed the same lysates for the endogenous protein Hsp70 (Fig. 4B) and found the Hsp70 profiles for treated verses non-treated to be identical. Similar results were observed inbTC (Fig. 4C) and mouse islets (Fig. 4D) which express endogenous Pdx1.
Serine 61 is the Primary Site of Phosphorylation in Pdx1
To test if the NIA assay could be used to map the phosphorylated residue in Pdx1 we carried out an alanine scan where all serines, tyrosines and threonines which are putative phosphorylation sites were replaced by alanine. Plasmids encoding the mutated Pdx1 proteins were transfected into L cells andaTC cells. The lysates were analyzed using NIA or western blots to confirm the expression and SDS-PAGE mobility of Pdx1 (Fig. 5A). To estimate the amount of phosphorylated Pdx1 we took advantage of the observation that the signal intensity of the 6.4 peak is unaffected by phosphorylation while the intensity of the 6.0
peak is related to the amount of phosphorylated protein. The ratio between the 6.4 and the 6.0 peak should therefore reflect the relative proportion of phosphorylated Pdx1. We find that only Pdx1S61A differs markedly from wild type Pdx1 (Fig. 5B) and superimposing the profile of Pdx1S61A onto the wild type profile revealed a marked reduction of the 6.0 peak (Fig. 5C). However, a residual 6.0 peak which could be removed by phosphatase treatment could still be detected, indicating the presence of at least one additional phosphorylation (Fig. 5D). To examine how constitutive phosphorylation affects the NIA profile of Pdx1 we replaced serine 61 with the negatively charged residue glutamic acid (Pdx1S61E), hereby mimicking a phosphorylation. When Pdx1S61Ewas analyzed using the NIA assay we only observed a single peak at pI 6.1(Fig. 5E) suggesting that the modifications of Pdx1 are absent if the protein is phosphorylated. This might also explain why the 6.3 and 6.4 peaks are unaffected following de-phosphorylation.
Mass Spectrometry Analysis of Pdx1
The NIA analysis of Pdx1 identified S61 as the primary phosphorylation of Pdx1 in L cells, aTC cells and HEK293 cells (data not shown). To confirm this finding we purified Pdx1 protein from over-expressing HEK293 cells or from Min6 cells which express endogenous Pdx1. The purified protein was initially digested with trypsin. However, despite a 98% coverage of the Pdx1 protein, we were not able to conclusively detect the S61 phosphorylation. In order to investigate this discrepancy in
Figure 4. Pdx1 is phosphorylated.In order to determine the identity of the peaks found in the Pdx1 profile we treated the lysate with lambda phosphatase to see if the removal of phosphorylations would shift the peaks. A-D) NIA profile (in 8 M urea) of the dephosphorylated lysate (red) is show superimposed on the control treated lysate (grey). A) Over expression of pdx1WTin L results in a shift of the 6.0 peak to 6.1, which fits the expected change in pI caused by a phosphorylation. The 6.40 peak is unaffected by the dephosphorylation. B) The NIA profile of Hsp70 from the same lysates serves as a control to show that the dephosphorylation assay does not impact the profile of a non phosphorylated protein. Control treatment or dephosphorylation ofbTC cells (C) and mouse islets (D), show similar results. Results are representative of at least three independent experiments.
more detail we analyzed Pdx1 under chymotryptic treatment prior to mass spectrometric analysis. Using chymotrypsin ensures that Pdx1 is proteolytically cleaved at different amino acids (Phe, Ile, Tyr and Trp) as compared to when using trypsin (Lys and Arg). This allows for increased sequence coverage of the analyzed protein and hence increased analytical coverage of PTMs. Using this strategy we were able to significantly confirm the presence of S61 phosphorylation in both HEK293 cells (Fig. 6A) and in Min6 cells (Fig. 6B). To evaluate the occupancy rate for the identified phosphorylation sites we compared the peptide abundance of unmodified peptide to its phosphorylated counterpart (Fig 6C). Although this is not the most accurate measure it still provides information as to how extensive a given amino acid is phosphorylated. The
comparison reveals that S61 indeed is the most highly abundant phosphorylation form in comparison to S269, with a,12% S61
occupancy rate in HEK293 and a corresponding S61 occupancy rate of ,5% in Min6 cells. In comparison the
occupancy rates for S269 phosphorylation in both HEK293 and Min6 were found to be less than 1%.
The Pdx1 Profile is Remarkably Stable
Several studies have shown that Pdx1 is modified in response to glucose stimulation and oxidative stress [26,27,28,29]. To test if the endogenous Pdx1 profile is dependent on cellular context or exogenous stimulation we proceeded to investigate the NIA profile of several sources of b-cells. In the embryonic pancreas the developingb-cells can be distinguished from other Pdx1 expressing
Figure 5. NIA profiles of Pdx1 alanine scanning shows Pdx1 to primarily be phosphorylated on serine 61. To identify putative phosphorylation sites in Pdx1, which may not have been picked up by the MS, we carried out an alanine scan. A) All serines, tyrosines and threonines in Pdx1 were mutated into alanines and transfected into L cells andaTC cells which are negative for endogenous Pdx1 expression and subjected to NIA analysis. B) Western blots against Pdx1 andb-Actin were used to confirm the expression of Pdx1 from the plasmids. Since the 6.4 peak is unaffected by dephosphorylation we used the area under curve (pI 6.4)/area under curve (pI 6.0) ratio to identify mutants where the phosphorylation was reduced. In most cases the intensity of the two bands are similar resulting in a relative ratio around 1 in both L cells (light grey bars) andaTC cells (dark grey bars). However, in Pdx1S61Athe phosphorylated band (pI 6.0) was reduced and as a result the relative ratio increased to around 4. The screen was performed twice in each cell line and a representative result is shown. C-D) NIA profiles of S61 mutants (red) superimposed on the wild type Pdx1 profile (grey) (C). Also, dephosphorylation of the S61A mutant (red) superimposed on the control-treated lysate (grey), shows a residual peak at 6.0 which is removed by phosphatase (D).Mutating S61 to the phospho-mimic glutamic acid (E) clearly reduces the 6.0 peak. Note, that the entire Pdx1 profile of this mutant including the 6.3 and 6.4 peaks are moved to the left, as would be expected from the calculated pI change of an alanine to glutamic acid substitution. The NIA analysis in C-E were done in both L andaTC (data not shown) cells in least three independently transfected cell lysates, yielding similar results.
doi:10.1371/journal.pone.0035233.g005
cells because they express higher levels of Pdx1 (Fig. 7A; white arrows). In mice lacking the pro-endocrine gene Neurog3 the endocrine lineage is absent and as a result the high expressing Pdx1 cells are no longer be detected (Fig. 7B). To test if the Pdx1 profile from the high expressingb-ell population has any unique features we dissected and homogenized whole pancreata from wild type and Neurog3 deficient e15.5 embryos and subjected the lysates to NIA analysis. As for all other cell types analyzed we detected the 6.0, 6.1 and 6.4 peaks and we could not detect any obvious differences between the wild type and the pancreata lackingb-cells (Fig. 7A’, 7B’). Next we examined the NIA profile from pancreas lysates of newborn (Fig. 7C) and adult (Fig. 7D) mice pancreata to see if any changes could be associated with theb-cells becoming functional and being exposed to fluctuating blood glucose levels. At both P2 and in adult mice the 6.0, 6.1 and 6.4 peaks were indistinguishable from the previously observed Pdx1 profiles including embryonic tissue suggesting that the Pdx1 profile is relatively stable after birth. To test if changes in glucose levels had any effect on the NIA profile we isolated mouse islets and incubated them at low or high glucose
(2 mM and 30 mM) for 1 hour, before harvest. We confirmed that the islets were glucose responsive by measuring the amount of insulin released to the media using western blotting (Fig. 7E). However, the NIA analysis shows the profiles from three independent experiments in 2 mM or 30 mM glucose, respectively (Fig. 7F, 7G). It is evident that the profiles obtained from high and low glucose is remarkably similar and when the ratio between the 6.0 peak and the 6.1 peak is calculated there is no difference between the two conditions (Fig. 7H).
Mouse Pdx1 is Modified in the Developing Endoderm of Mouse and Chicken Embryos
In addition to its role in the b-cell Pdx1 is also required for pancreas development during embryogenesis. At e10.5 Pdx1 is expressed in both the dorsal and ventral pancreatic buds, in the duodenum and in the posterior stomach (Fig. S3A). The stomach and pancreas region from wild type embryos was micro dissected and the pooled pancreata from two litters were analyzed by NIA (Fig. S3A’). The signal obtained is weak but we could robustly
Figure 6. MS analysis identifies serine 61 as the principal phosphorylation site in Pdx1.To substantiate the NIA data we did mass spectometry to identify modified residues especially looking for phosphorylations. We analyzed endogenous Pdx1 protein from Min6 cells and over expressed Pdx1 from HEK293 cells. The mouse wildtype Pdx1 protein was, purified by immunoprecipitation using the mouse-a-Pdx1 antibody, then separated by SDS-PAGE, digested with chymotrypsin and subjected to MS analysis. A-B) MS/MS data showing phosphorylation on wildtype Pdx1 at serine 61 when over experessed and purified from HEK293 cells (A) or from Min6 cells (B). We then did a quantification of the amount of phosphorylated versus non-phosphorylated Pdx1 peptides counted by the MS instrument. C) Relative amount of phosphorylated serine 61 and serine 269 in HEK293 and Min6 cells. The MS analysis was done once.
detect the 6.0, 6.1 and 6.4 peaks indicating that Pdx1 is modified during the earliest stages of pancreas development. Slightly later in development at e12.5 the pancreas express high levels of Pdx1 while low Pdx1 expression can be detected in the stomach and duodenum (Fig. S3B). Again we found the distinctive Pdx1 profile albeit at higher levels (Fig. S3B’). To test if the phosphorylated form of Pdx1 is important for pancreas development we electroporated mouse Pdx1 into the endoderm of living chicken embryos usingin ovoelectroporation [44]. Using this system Pdx1 would be expressed in an environment closely resembling the developing pancreas and presumably be exposed to the similar signaling cues. One day after electroporation GFP expression can be detected throughout the endoderm (Fig. 8A). The embryos were then dissociated into single cells and sorted into GFP negative
and GFP positive fractions using FACS. On average GFP cells constituted 0.3% of the total number of cells (pre-sort) and 53% after sorting. Each embryo contained 5000–10000 GFP express-ing cells. Runnexpress-ing NIA analysis on cells from embryos electropo-rated only with GFP, the GFP sorted fraction was positive for GFP but not Pdx1 (Fig. 8B), showing that we do not detect endogenous chicken Pdx1. In the NIA analysis of embryos co-electroporated with GFP and Pdx1 neither of the two proteins were detected in the GFP negative fraction (Fig. 8C), but only in the GFP positive fraction (Fig. 8D). As expected, the Pdx1 profile produced peaks at pI 6.0 and pI 6.4 confirming that Pdx1 becomes phosphorylated in the developing endoderm. Finally, we electroporated chicken embryos with plasmids encoding GFP, Pdx1WT, Pdx1S61A or Pdx1S61E. The embryos were allowed to develop for 3 days, before
Figure 7. The Pdx1 NIA profile fromin vivob-cells is not unique and not responsive to glucose.To determine if theb-cells contain a unique Pdx1 protein species we compared the NIA profiles of pancreata obtained from wild type mice and mice lacking the pro-endocrine gene
Neurog3. In theNeurog32/2mice allb-cells are lost and the Pdx1 high expressingb-cells are no longer present. Thus, any modifications on Pdx1 that are uniquely present in theb-cell should therefore only appear in the wild type profile. A and B) Immunohistochemical stainings of e15.5Neurog3+/+ orNeurog32/2mouse pancreata, showing the distribution of Pdx1 (green) in the Chd1 positive endoderm (red). A’ and B’) the Pdx1 NIA analysis of equivalent micro dissected tissue. Pdx1 NIA profile of pancreas tissue lysate from newborn (P2) (C) and adult NMRI mice (D). Results are representative of two (Neurog3) or three independent (P2 and adult) experiments. E, F and G) Three independent purifications of islets from NMRI mice were cultured for 2–3 days, washed with media lacking glucose, and then cultured with 2 mM glucose for two hours followed by incubation with 2 mM or 30 mM glucose for one hour E) Western blot on media from the islets, showing glucose responsiveness. F) Three preparations of mouse islets in 2 mM glucose. G) Three preparations of mouse islets in 30 mM glucose. H) Quantification of the three experiments showing the ratio of the pI 6.0 peak area under curve divided by the pI 6.1 peak area under curve. The error bars show standard deviation.
doi:10.1371/journal.pone.0035233.g007
being dissected and subjected to immunohistochemistry. The embryos were analyzed for the expression of GFP, Foxa2 (expressed in all endodermal cells) and Nkx6.1. Nkx6.1 is a marker of pancreas development and has previously been shown to be induced by Pdx1 [7,8]. In embryos electroporated with GFP alone the pancreas and anterior endoderm developed normally
(Fig. 8E). Importantly, no expression of Nkx6.1 was detected in the endoderm outside the pancreatic buds. When Pdx1WT was electroporated we observed a strong induction of ectopic Nkx6.1 expression in the endoderm anterior to the pancreas (Fig. 8F). To investigate if the S61 phosphorylation has a role in pancreas development we looked for ectopic activation of Nkx6.1 expression
Figure 8. Pdx1 is phosphorylated in the developing chicken endoderm but S61 phosphorylation is not required for ectopic pancreas formation.Since the characteristic Pdx1 NIA profile was found early in mouse endoderm development (Fig. S3), we investigated the function of Pdx1 byin ovoelectroporation of plasmids encoding Pdx1 and GFP into the endoderm of developing chicken embryos. One day following electroporation GFP expressing cells could be detected throughout the endoderm. A) OPT images showing the distribution of GFP expressing cells (green). Following dissociation, the GFP expressing cells were purified using FACS. Before sorting, the GFP expressing cells constituted 0.3% of the total number while the sorted fraction contained 53.5% GFP cells. B-D) The NIA profiles of the GFP positive fraction of embryos only electroporated with GFP (B), GFP and Pdx1 in the GFP negative fraction from embryos electroporated with GFP and Pdx1 (C) and the GFP positive fraction from embryos electroporated with both GFP and Pdx1 (D). In embryos electroporated with wild type Pdx1 the profile resembles the canonical Pdx1 profile. E-H) 3D image projections of confocal sections obtained from chicken embryos stained for Nkx6.1 (red), GFP (green) and Foxa2 (blue) by whole mount immunohistochemistry 72 hours after electroporation. In embryos electroporated with plasmids encoding GFP no ectopic Nkx6.1 expression could be detected (E). In embryos electroporated with wild type Pdx1 we observed the induction of ectopic pancreata and associated Nkx6.1 expression (F; arrowheads). Plasmids encoding Pdx1S61A(G) and Pdx1S61E(H) and also induced ectopic pancreata when electroporated into the endoderm. We also observed that the ectopic pancreata induced by wild type Pdx1 and S61A was associated with ectopic insulin expression (Fig. S4). dp (dorsal pancreas), st (stomach). Results are representative for two independent FACS analyses and at least three wholemount stainings for each Pdx1 construct.
in chicken embryos electroporated with Pdx1S61A and Pdx1S61E (Fig. 8G, 8H). We found that both mutants induces pancreas budding and Nkx6.1 expression to exactly the same extent as the wildtype and it is therefore unlikely that phosphorylation of S61 has a role in pancreas development. In embryos electroporated with Pdx1WTthe ectopic Nkx6.1 was found scattered within the Foxa2 positive endoderm. However, in several cases we observed that the Nkx6.1 cells became organized into a branched epithelium very similar to the endogenous pancreas (arrows in Fig. 8F-8H). We therefore speculated that the ectopic Nkx6.1 expression might actually reflect the formation of ectopic pancreata. To test this we stained embryos electroporated with Pdx1WTor Pdx1S61Afor GFP, Nkx6.1 and insulin. In all embryos
where we could detect ectopic Nkx6.1 expression anterior to the pancreas we also observed insulin expression (Fig. S4A and S4B).
Discussion
One advantage of the NIA technology is that one antibody is used for the detection of all protein species which can be separated by electrical charge. In recent years NIA has been used successfully to study signal transduction [41,42] but, to the best of our knowledge this work represents the first study where the technology has been applied to a transcription factor. When analyzing the profile of the homeobox containing transcription factor Pdx1 we find at least four differently charged protein species Pdx16.0, Pdx16.1, Pdx16.3and Pdx16.4. These data were obtained
using two different antibodies against Pdx1 and we were able to shift the peaks by adding an epitope tag. Furthermore, the four peaks are always present when Pdx1 is expressed in eukaryotic cells (bTC, mouse islets, mouse embryonic pancreas, L cells, HEK293, aTC and chicken endoderm cells) while bacterially derived Pdx1 only produces a single peak. Given the similar SDS-PAGE mobility of eukaryotic and bacterial Pdx1 we conclude that the NIA peaks we observe are due to post-translational modifications. Also, as both eukaryotic and bacterially expressed Pdx1 gives a single band using western blots we conclude that the post-translational modifications must be relatively small, i.e. under 1000 Da.
One very important aim of this study was to determine the pI of bacterially expressed and hereby minimally modified Pdx1 protein and to this end confirm that the Pdx1 protein is in fact subjected to post-translational modification in eukaryotic cells. We did this by comparing the NIA profiles of Pdx1 purified from bacteria and mammalian cells. As expected the bacterial protein produced a single peak. However, the bacterial peak has a pI of 7.2 while the predicted pI for unmodified mouse Pdx1 is 6.4. In lysates from eukaryotic cells the most prominent peak actually runs at 6.4, importantly when comparing bacterial and mammalian Pdx1 we used exactly the same open reading frame for expression and we sequence verified the different expression vectors and can conclusively rule out any possibility of errors in the constructs or the presence of alternative start sites. We therefore conclude that the pI for unmodified Pdx1 is pI 7.2 and that it is a coincidence that the 6.4 peak observed in eukaryotic cells has the same pI as predicted for unmodified Pdx1. This is supported by NIA analysis of human pdx1, which has a predicted pI of 7.1, but when over expressed in HEK293 cells gives the dominant peak at pI 6.6 (data not shown). Interestingly, on western blots Pdx1 also behaves differently from what would be expected. The predicted molecular weight of Pdx1 is 31 kDa but on gels the protein migrates at 40– 46 kDa. This difference has now been proven by mass spectrometry to be due to anomalous SDS-PAGE mobility of the pdx1 protein [45] and we speculate that similar anomalous
properties of Pdx1 in isoelectric focusing is the reason for the difference between observed and predicted pI of bacterially expressed Pdx1 protein.
Using the NIA assay and mass spectrometry we identified S61 as the primary phosphorylation and that the modification is responsible for the 6.0 peak. However, the mass spectrometry also identified phosphorylations on Y140/T141, S269 and in the NIA profile we could still detect a smaller peak at 6.0 in the S61A mutant that could be shifted following de-phosphorylation. To test if Y140/T141 orS269 could account for the residual phosphor-ylation in Pdx1S61A we generated the following double mutants Pdx1S61A/Y140A, Pdx1S61A/T141APdx1S61A/S269A. However, all the double mutants showed low levels of phosphorylation (data not shown). Given the numerous publications describing other phosphorylation sites on Pdx1 it is obvious that any of those could be present together with the S61 phosphorylation.
Given the dynamic and often fast exchange of phosphorylation and post-translational modifications in general it is remarkable that there is so little variation between Pdx1 obtained from the very different cell types. Both endogenous and ectopically derived Pdx1 produces profiles where the 6.0 and 6.4 peaks represent the predominant protein species. Subtle variations might be found, for example the 6.1 peak appears to be more abundant in the E15.5 embryonic tissue. However, only in isolated islets do we observe a significantly different peak at pI 6.9. This peak is interesting for several reasons. First, it is only observed following treatment with 8 M urea indicating that in HNG buffer this Pdx1 species is masked from antibody detection. A likely explanation is that that the 6.9 species only exists in a tight protein-protein complex. Second, the 6.9 peak is only found in isolated islets strongly suggesting that it is unique to mature beta-cells. It should be noted that that the 6.9 peak, was absent in post-natal and adult pancreas, but this is probably due to the expression of Pdx1 in acinar cells, masking the Pdx1 signal from the relatively fewb-cells present in the adult mouse pancreas [46].
What our data clearly shows is that the level of glucose has no impact the NIA profile of Pdx1 from purified mouse islets. This is in agreement with other studies also using non-invasive detection techniques to study Pdx1 protein from both mouse, human and rat islets [29,45]. One explanation for this could be that the factors modifying Pdx1 are ubiquitous. For example if the posttransla-tional modifications of Pdx1 were coupled to common events such as the cell cycle [47]. Alternatively, ubiquitous factors known to interact with Pdx1 such as p300 [48] might be present in all cell types and therefore influence the profile in a similar manner.
One important feature of the NIA assay is that can be used to study how the different modifications influence each other. Although we fail to identify the modification responsible for the 6.3 and 6.4 peaks it is very obvious that these peaks are uncoupled from the phosphorylation of S61. Thus the de-phosphorylation only affects the 6.0 and 6.1 peaks. Furthermore, S61E which mimics a constitutive phosphorylation abolished other protein isoforms. One explanation for this could be that the modification responsible for the 6.3/6.4 peaks only can occur when S61 is not phosphorylated.
Likewise the residual phosphorylation peak (6.0) in Pdx1S61Ais remarkably larger than what would be expected if the secondary phosphorylation peak (5.9) of the wild type Pdx1 protein was shifted to (6.0). Thus interactions between different modifications or redundant phosphorylation sites are likely to influence the dynamics of Pdx1 modification.
In conclusion, we show that Pdx1 harbors several post-translational modifications and that phosphorylation of serine 61
is the most abundant phosphorylation on Pdx1, and that it is not regulated by glucose in mouse islets.
Materials and Methods
Nanofluidic Proteomic Immunoassay (NIA)
This assay, here designated NIA, was developed by Cell Bioscience [42]. All runs were done on the Nanopro1000 instrument and performed essentially as described by the manufacturer (http:// www.cellbiosciences.com/nanopro.html). The NIA assay is a fully automated, nanocapillary-based immunoassay based on isoelectric focusing (IEF) to separate the proteins in a regular cell or tissue lysate. Following separation the proteins are linked to the capillary wall through UV irradiation and then probed with primary and secondary antibodies. The secondary antibody is HRP-labeled, which enables sensitive chemiluminescence detection. The signal, which is black dots equivalent to that obtained by western blotting are then analyzed by special software and can be viewed as either a graph or a virtual gel. All NIA data presented in this study were obtained by duplicate analysis of the described lysates in either HNG buffer (20 mM Hepes, pH7.5, 25 mM NaCl, 10% glycerol) or 8 M urea, both supplemented with 20 mM DTT. This was done to compare the NIA profile under conditions of semi- and full-denaturation. Samples were then mixed 1:1 with a sorbitol based premix, containing five peptide standards with known pI (pI ladder 1 cat.no. 040–644). The same premix was used for all runs and it enables the generation of a pH gradient ranging from 4 to 9 (cat.no. 040–319). To establish the pH gradient, the anolyte were 10 mM phosphoric acid and the catholyte were 100 mM sodium hydroxide. The proteins were focused for 40 min. at 15 mW, and then incubated for 2 hours with primary antibody; 4 times wash with TBST and 1 hour with the secondary HRP conjugated antibody, washed again and lastly, chemiluminescence detection with Super-Signal West Dura from Pirece. Concerning peak identification we observe small variations from run to run. The peak at pI 6.40 could therefore vary from 6.36 to 6.44. However, the relative distance between peaks in the same run was always the same.
Dephosphorylation was donein vitrousing Lambda phosphatase (NEB, Cat.no. P0753). Cell lysate were diluted 10 times in reaction buffer (50 mM HEPES, 100 mM NaCl, 2 mM DTT, 4 mM MnCl2), split in two and treated with 1ml (400 units) lambda
phosphatase or 1ml water for 30 min. at 37uC. Afterwards the reactions were diluted once in HNG or 8 M urea, both with 20 mM DTT and analyzed by NIA as described above.
MS Analysis
All MS experiments were performed on a nanoscale HPLC system (EASY-nLC from Proxeon Biosystems) connected to a hybrid LTQ–Orbitrap Velos (Thermo Fisher Scientific) equipped with a nanoelectrospray source (Proxeon Biosystems). Each peptide sample was auto-sampled and separated in a 15 cm analytical column (75mm inner diameter) in-house packed with
3-mm C18 beads (Reprosil Pur-AQ, Dr. Maisch) with a 2 h gradient
from 5% to 40% acetonitrile in 0.5% acetic acid. The MS instrument was operated in data-dependent mode to automatically switch between scan MS and MS/MS acquisition. Survey full-scan MS spectra (from m/z 300–1,700) were acquired in the orbitrap with resolution R = 30,000 at m/z 400 (after accumulation to a ‘target value’ of 1,000,000 in the linear ion trap) using a HCD top10 method. The ten most intense peptide ions with charge states$2 were sequentially isolated to a target value of 50,000 using predictive automatic gain control (pAGC) and fragmented by higher-energy collisional dissociation (HCD) in the octopole collision cell using normalized collision energy of
40%. The ion selection threshold was 5,000 counts for HCD and the maximum allowed ion accumulation times were 500 ms for full scans and 250 ms for HCD. All HCD fragment ion spectra were recorded in the orbitrap with a resolution of 7,500 at m/ z 400. For all full scan measurements a lock-mass ion from ambient air (m/z 445.120025) was used for internal calibration when present, as described [49]. Standard mass spectrometric conditions for all experiments were: spray voltage, 2.2 kV; no sheath and auxiliary gas flow; heated capillary temperature, 200uC; predictive AGC with calibrated scaling factor of about 100, and an S-lens RF level of 60%.
Identification of Peptides and Proteins by MaxQuant
The data analysis was performed with the MaxQuant software (version 1.0.14.7, www.maxquant.org) as described [50] supported by Mascot (www.matrixscience.com) as the database search engine for peptide identifications. We followed the step-by-step protocol of the MaxQuant software suite [51] to generate MS/MS peak lists that were filtered to contain at most six peaks per 100 Da interval and searched by Mascot (Version 2.2.04) against a concatenated target/decoy (forward and reversed) version of the IPI human database version 3.37 (69.316 forward protein entries). Protein sequences of common contaminants such as human keratins and proteases used were added to the database. The initial mass tolerance in MS mode was set to 7 p.p.m. and MS/MS mass tolerance was 0.02 Da. Cysteine carbamidomethylation was searched as a fixed modification, whereas lysine acetylation, serine/threonine/tyrosine phosphorylation, protein N-acetylation, and oxidized methionine were searched as variable modifications. A maximum of two mis-cleavages was allowed while we required strict tryptic specificity. The resulting Mascot.dat files were loaded into the MaxQuant software together with the raw data for further analysis. To minimize false identifications, all top-scoring peptide assignments made by Mascot were filtered based on previous knowledge of individual peptide mass error. Peptide assignments were statistically evaluated in a Bayesian model on the basis of sequence length and Mascot score. We accepted peptides and proteins with a false discovery rate of less than 1%, estimated on the basis of the number of accepted reverse hits.
Chicken Electroporations and FACS Analysis
Cell lines, Islets and Embryonic Tissue
bTC3 (bTC),aTC1.3 (aTC), L and HEK293F (HEK293) cells were cultured in DMEM with 10% FBS and 1% pen/strep.bTC, L and HEK293 cells were cultured with 5 g/L glucose, andaTC with 1g/L glucose. Islets from wild type NMRI mice were isolated using collagenase digestion and were grown for 5 days in RPMI 1640 with 10%FBS and 1% pen/strep. All embryonic mouse tissue were from wild type NMRI mice, expect for the Neurog3-knockout [53]. For analysis of embryonic pancreas tissue time-mated mice were sacrificed at the indicated gestational stage, the embryos were removed and the embryonic pancreas dissected under microscope using a small knife and forceps.
Cloning and Plasmids
Wildtype mouse Pdx1 (Pdx1WT) cDNA were obtained as an imageclone from Open Biosystems (GenBank: BC103581.1). This cDNA was amplified by PCR and inserted in the pENTR/D vector (Invitrogen) and then transferred to our previously published expression vector pCGIG5 [44], for expression in eukaryotes and to the pEXP2 plasmid (Invitrogen) for expression in bacteria. To generate, the 3xFlag version we used a 3’ primer comprising the tag. To introduce point mutations we performed chimeric PCR using primers covering 12 nucleotides up and down stream of the codon being modified. Correct clones were identified by diagnostic RE digests and sequence verified (MWG, Ebersberg, Germany). As control we used the pCGIG5 vector either without insert (designated empty vector) or with EGFP. Wildtype GSK3b
were cloned from Xenopus and a kind gift from Chris Wright.
Cell/tissue Harvest
For direct NIA and western analyzes all cell lines, tissue and islets were lysed in Tissue Extraction Reagent I (50 mM Tris, pH 7.4, 250 mM NaCl, 5 mM EDTA, 2 mM, Na3VO4, 1 mM
NaF, 20 mM Na4P2O7, 0.02%NaN3, and proprietary detergent),
from Invitrogen. Prior to use this buffer was supplemented with protease inhibitors (Complete protease inhibitor cocktail tablets, Roche). Before harvest, the cells were washed once in PBS and thoroughly aspirated. One 6-well of cells was lysed in app. 100ml,
one litter of E15.5 pancreata was lysed in 20ml and 200 islets in
8ml. For the Neurog3-KO, individual pancreata were isolated and
snap-frozen in dry ice and kept at280uC, while genotyping was performed. Pancreata with the three different genotypes was pooled and lysed in 5ml buffer per four pancreata. HEK293
lysates for immunoprecipitation followed by NIA, western or mass spectrometry analysis were harvested as nuclear extracts; One 15 cm dish were washed once in PBS followed by cytolysis for 10 min. in 1.5 ml buffer A (10 mM HEPES pH 7.9, 10 mM KCl, 0.1 mM EDTA and 0.4% Triton X-100, Complete protease inhibitor cocktail tablets). Then, scraped and dissociated by pippeting and centrifuged at 10.000xg for 5 min. The pellet was resuspended in 300ml buffer B (20 mM HEPES pH 7.9, 400 mM
NaCl, 2 mM EDTA and 20% glycerol, Complete protease inhibitor cocktail tablets), sheared using a 21 G needle and shaken for 1 hour at 4uC. To generate the bacterially expressed protein, 30 ml of BL21 overnight culture was added to 250 ml fresh media and grown for 3 hours before induction with 1 mM IPTG for additionally 6 hours. The resulting bacteria pellet was washed and resuspended in 12 ml TBST supplemented with protease inhibitors, followed by sonication on ice.
Additionally, all lysates were kept on ice for at least 10 min, with 2 rounds of vortexing, followed by centrifugation at 16.0006g for
20 min. and then transferred to clean tubes and kept at280uC.
Immunoprecipitation (IP) and Western Blotting (WB)
For IP of wildtype Pdx1, BL21 lysates and nuclear extracts from HEK293 cells transfected with empty vector or Pdx1WT were incubated with 5mg mouse-a-Pdx1 antibody and 50ml magnetic
protein G dynabeads (Invitrogen) per ml of lysate, for 3 hours at 4uC with end-over turning. Following four washes in TBST the beads were eluted in 8 M urea supplemented with 20 mM DTT at 30uC for 60 min with shaking. For IP of 3xFlag tagged Pdx1, BL21 lysates and nuclear extracts from HEK293 cells transfected with empty vector or Pdx13xFLAG were incubated with 25ml
magnetica-Flag beads (Sigma) per ml of lysate for 3 hours at 4uC with end-over turning. Following four washes in TBST the 25ml beads were eluted with 125ml of 100mg/ml 3xFlag peptide in TBS
at 37uC for 60 min with shaking. Lastly, all eluates were concentrated app. 20 fold using spin columns with a 10 K cut-off (Amicon).
Pdx1 protein for mass spectrometry was prepared from nuclear extracts of HEK293 cells transfected with Pdx1WTand immuno-precipitated as described above, however elution from the beads were done by heating at 80uC with LDS sample buffer (Invitrogen) containing 20 mM DTT. Following SDS-PAGE, the gel was stained with Coomassie (Imperial stain, Pierce); the band of interest cut out, destained with ammonium sulphate and sliced into small pieces; then reduced with DTT and alkylated using chloroacetamide. Finally, the proteins were digested overnight with trypsin, loaded onto StageTips and subjected to mass spectrometric analysis.
Western blots were done using precast NuPAGE Novex Bis-Tris gels and blotted onto PVDF membranes (Invitrogen). All membranes were stained with Ponceau S to verify uniform blotting. Destaining was done with 5% acetic acid. Blocking and antibody diluent were 5% skim milk with 0.1% tween-20. The antibodies were applied for 1 hour at room temp or overnight at 4uC. Detection was done with Supersignal west pico from Pierce. Afterwards, when appropriate the membranes were incubated overnight in skim milk with 0.02% sodium azide and then reproped with another primary antibody of a different species.
Cell line Transfections
For transfection ofaTC and L cells, plasmid DNA was purified from 40 ml overnight TOP10 bacteria culture using the S.N.A.P. kit from invitrogen. All pointmutants were transfected into each cell line in at least two different cell passages. This was done in 6-or 12-well plates using Lipofectamine2000 acc6-ording to manufac-tures instructions. For transfection of HEK293 cells, plasmid DNA was isolated from 600 ml overnight culture using the Megaprep kit, from Invitrogen. HEK293 cells were transfected with empty vector or Pdx1WT in 15 cm dishes using Lipofectamine2000 according to manufactures instructions.
Antibodies
Primary goat-a-Pdx1 was a kind gift from Chris Wright and used at 1:50.000 for western, 1:10.000 for immunofluorescence and between 1:50 and 1:500 for NIA. Primary mouse- a-Pdx1 from the Hybridoma bank (1mg/ml) was used at 1:10.000 for western, 1:5–1:50 for NIA and for IP at 5mg/ml lysate. Rabbit-a-GFP from Invitrogen were used for NIA at 1:50 and mouse-a -Hsp70 from Abcam was used for NIA at 1:1.000. For western, mouse-a-b-Actin from Sigma was used at 1:25.000, guine a
pig-a-insulin from Abcam at 1:100 and mouse-a-GSK3a/b from R&D at 1:500. For immunofluorescence; rabbit-a-GFP from Clonetech was used at 1:500, mouse-a-Nkx6.1 from the Hybridoma bank at 1:1000 and goat-a-FoxA2 from Santa Cruz at 1:250. All secondary antibodies were from Jackson
esearch, the cross absorbed versions. For western and NIA they were HRP conjugated and used at 1:10.000 (western) or 1:500 (NIA). For immunofluorescence they were Cy2, Cy3 or Cy5 conjugated and used at 1:300.
Supporting Information
Figure S1 Spiking of Pdx13xFLAGpurified from bacteria into HEK293 cells expressing either EGFPFlag or Pdx13xFlag.To further validate that the pI of bacterially expressed Pdx1 does differ from that of Pdx1 expressed in the human HEK293 cell line, we mixed the purified Pdx13xFLAGprotein sample from BL21 bacteria into HEK293 lysate expressing either EGFPFLAGor Pdx13xFLAG and then ran the NIA assay. As control we spiked HEK293 lysates expressing (A) EGFPFLAGor (B) HEK293 lysates expressing Pdx13xFLAGwith a negative control sample consisting of bacterial proteins purified from untransformed bacteria. As expected from Fig.3 we only observed the Pdx13xFLAGprofile. (C and D) Then we spiked the same two HEK293 lysates with purified bacterially expressed Pdx13xFLAGand it is clear that the profile was not altered by mixing the samples before doing the NIA analysis. Two analyses were performed giving similar results.
(TIF)
Figure S2 NIA profile of endogenous Pdx1 using the mouse-a-antibody. Samples were diluted in 8 M urea and analyzed by NIA with the mouse-a-Pdx1 antibody. This was done in parallel to the profiles obtained with the goat-a-Pdx1 antibody, presented in figure 3. A-D) NIA analysis showing the profile of
bTC (A),aTC (B), E15.5 pancreas (C) and islets (D) obtained with the mouse-a-Pdx1 antibody (red) superimposed on the profile obtained from the same samples using the goat-a-Pdx1 antibody (grey). Two analyses were performed giving similar results. (TIF)
Figure S3 The Pdx1 protein is detected in developing mouse endoderm.Immunohistochemical stainings showing the Pdx1 expression (green) in the Chd1 positive endoderm (red). At e10.5 (A) and e12.5 (B) Pdx1 is expressed uniformly in the pancreas, posterior stomach and in the duodenum. A’ and B’) Pdx1 NIA analysis of equivalent micro dissected tissue, showing that during very early development at e10.5 Pdx1 also appears to show the characteristic NIA profile and two days later at e12.5 the profile is easily recognizable. Results are representative of three independent experiments.
(TIF)
Figure S4 Both Pdx1WT and Pdx1S61A induces ectopic insulin expressionin vivo.3D image projections of confocal
sections obtained from chicken embryos stained for Insulin (red), Nkx6.1 (blue) and GFP (green) by whole mount immunohisto-chemistry 72 hours after electroporation. In embryos electropo-rated with plasmids encoding (A) Pdx1WT or (B) Pdx1S61A we observe an equal amount of ectopic insulin production. Two analyses were performed giving similar results.
(TIF)
Acknowledgments
We thank Dr. Chris Wrigh for providing the goat-a-Pdx1 antibody and Gsk3b plasmid, Dr. Anne Grapin-Botton for providing the pCGIG5 plasmid expression vector, and Dr. Gerard Gradwohl for the Neurog3 mice. We are grateful to Dr. Palle Serup and Dr. Ole D. Madsen for discussions and critical comments, Søren Refsgaard Lindskog for FACS analysis and Hanne Duus Laustsen for technical assistance.
Author Contributions
Conceived and designed the experiments: TF KBS SK MLN JH-S. Performed the experiments: TF KBS JH-S. Analyzed the data: TF KBS SK MLN JH-S. Contributed reagents/materials/analysis tools: TF KBS MLN JH-S. Wrote the paper: TF JH-S.
References
1. Jonsson J, Carlsson L, Edlund T, Edlund H (1994) Insulin-promoter-factor 1 is required for pancreas development in mice. Nature 371: 606–609.
2. Offield MF, Jetton TL, Labosky PA, Ray M, Stein RW, et al. (1996) PDX-1 is required for pancreatic outgrowth and differentiation of the rostral duodenum. Development 122: 983–995.
3. Ohlsson H, Karlsson K, Edlund T (1993) IPF1, a homeodomain-containing transactivator of the insulin gene. EMBO J 12: 4251–4259.
4. Wright CV, Schnegelsberg P, De Robertis EM (1989) XlHbox 8: a novel Xenopus homeo protein restricted to a narrow band of endoderm. Development 105: 787–794.
5. Jorgensen MC, Ahnfelt-Ronne J, Hald J, Madsen OD, Serup P, et al. (2007) An illustrated review of early pancreas development in the mouse. Endocr Rev 28: 685–705.
6. Stoffers DA, Zinkin NT, Stanojevic V, Clarke WL, Habener JF (1997) Pancreatic agenesis attributable to a single nucleotide deletion in the human IPF1 gene coding sequence. Nat Genet 15: 106–110.
7. Grapin-Botton A, Majithia AR, Melton DA (2001) Key events of pancreas formation are triggered in gut endoderm by ectopic expression of pancreatic regulatory genes. Genes Dev 15: 444–454.
8. Pedersen JK, Nelson SB, Jorgensen MC, Henseleit KD, Fujitani Y, et al. (2005) Endodermal expression of Nkx6 genes depends differentially on Pdx1. Dev Biol 288: 487–501.
9. Horb ME, Shen CN, Tosh D, Slack JM (2003) Experimental conversion of liver to pancreas. Curr Biol 13: 105–115.
10. Ahlgren U, Jonsson J, Jonsson L, Simu K, Edlund H (1998) beta-cell-specific inactivation of the mouse Ipf1/Pdx1 gene results in loss of the beta-cell phenotype and maturity onset diabetes. Genes Dev 12: 1763–1768. 11. Johnson JD, Ahmed NT, Luciani DS, Han Z, Tran H, et al. (2003) Increased
islet apoptosis in Pdx1+/- mice. J Clin Invest 111: 1147–1160.
12. Hani EH, Stoffers DA, Chevre JC, Durand E, Stanojevic V, et al. (1999) Defective mutations in the insulin promoter factor-1 (IPF-1) gene in late-onset type 2 diabetes mellitus. J Clin Invest 104: R41–48.
13. Stoffers DA, Ferrer J, Clarke WL, Habener JF (1997) Early-onset type-II diabetes mellitus (MODY4) linked to IPF1. Nat Genet 17: 138–139.
14. Huang H, Liu N, Lin S (2001) Pdx-1 knockdown reduces insulin promoter activity in zebrafish. Genesis 30: 134–136.
15. Leibowitz G, Ferber S, Apelqvist A, Edlund H, Gross DJ, et al. (2001) IPF1/ PDX1 deficiency and beta-cell dysfunction in Psammomys obesus, an animal With type 2 diabetes. Diabetes 50: 1799–1806.
16. Milewski WM, Duguay SJ, Chan SJ, Steiner DF (1998) Conservation of PDX-1 structure, function, and expression in zebrafish. Endocrinology 139: 1440–1449. 17. Seufert J, Weir GC, Habener JF (1998) Differential expression of the insulin gene transcriptional repressor CCAAT/enhancer-binding protein beta and transactivator islet duodenum homeobox-1 in rat pancreatic beta cells during the development of diabetes mellitus. J Clin Invest 101: 2528–2539.
18. Yee NS, Yusuff S, Pack M (2001) Zebrafish pdx1 morphant displays defects in pancreas development and digestive organ chirality, and potentially identifies a multipotent pancreas progenitor cell. Genesis 30: 137–140.
19. Holland AM, Gonez LJ, Naselli G, Macdonald RJ, Harrison LC (2005) Conditional expression demonstrates the role of the homeodomain transcription factor Pdx1 in maintenance and regeneration of beta-cells in the adult pancreas. Diabetes 54: 2586–2595.
20. Waeber G, Thompson N, Nicod P, Bonny C (1996) Transcriptional activation of the GLUT2 gene by the IPF-1/STF-1/IDX-1 homeobox factor. Mol Endocrinol 10: 1327–1334.
21. Watada H, Kajimoto Y, Umayahara Y, Matsuoka T, Kaneto H, et al. (1996) The human glucokinase gene beta-cell-type promoter: an essential role of insulin promoter factor 1/PDX-1 in its activation in HIT-T15 cells. Diabetes 45: 1478–1488.
22. Chakrabarti SK, James JC, Mirmira RG (2002) Quantitative assessment of gene targeting in vitro and in vivo by the pancreatic transcription factor, Pdx1. Importance of chromatin structure in directing promoter binding. J Biol Chem 277: 13286–13293.
23. Kulkarni RN, Jhala US, Winnay JN, Krajewski S, Montminy M, et al. (2004) PDX-1 haploinsufficiency limits the compensatory islet hyperplasia that occurs in response to insulin resistance. J Clin Invest 114: 828–836.
25. Mosley AL, Corbett JA, Ozcan S (2004) Glucose regulation of insulin gene expression requires the recruitment of p300 by the beta-cell-specific transcrip-tion factor Pdx-1. Mol Endocrinol 18: 2279–2290.
26. Elrick LJ, Docherty K (2001) Phosphorylation-dependent nucleocytoplasmic shuttling of pancreatic duodenal homeobox-1. Diabetes 50: 2244–2252. 27. Macfarlane WM, McKinnon CM, Felton-Edkins ZA, Cragg H, James RF, et al.
(1999) Glucose stimulates translocation of the homeodomain transcription factor PDX1 from the cytoplasm to the nucleus in pancreatic beta-cells. J Biol Chem 274: 1011–1016.
28. Petersen HV, Peshavaria M, Pedersen AA, Philippe J, Stein R, et al. (1998) Glucose stimulates the activation domain potential of the PDX-1 homeodomain transcription factor. FEBS Lett 431: 362–366.
29. Boucher MJ, Selander L, Carlsson L, Edlund H (2006) Phosphorylation marks IPF1/PDX1 protein for degradation by glycogen synthase kinase 3-dependent mechanisms. J Biol Chem 281: 6395–6403.
30. Humphrey RK, Yu SM, Flores LE, Jhala US (2010) Glucose regulates steady-state levels of PDX1 via the reciprocal actions of GSK3 and AKT kinases. J Biol Chem 285: 3406–3416.
31. Khoo S, Griffen SC, Xia Y, Baer RJ, German MS, et al. (2003) Regulation of insulin gene transcription by ERK1 and ERK2 in pancreatic beta cells. J Biol Chem 278: 32969–32977.
32. An R, da Silva Xavier G, Hao HX, Semplici F, Rutter J, et al. (2006) Regulation by Per-Arnt-Sim (PAS) kinase of pancreatic duodenal homeobox-1 nuclear import in pancreatic beta-cells. Biochem Soc Trans 34: 791–793.
33. Lebrun P, Montminy MR, Van Obberghen E (2005) Regulation of the pancreatic duodenal homeobox-1 protein by DNA-dependent protein kinase. J Biol Chem 280: 38203–38210.
34. Fernandez-Alvarez J, Barbera A, Nadal B, Barcelo-Batllori S, Piquer S, et al. (2004) Stable and functional regeneration of pancreatic beta-cell population in nSTZ-rats treated with tungstate. Diabetologia 47: 470–477.
35. Meng R, Al-Quobaili F, Muller I, Gotz C, Thiel G, et al. (2010) CK2 phosphorylation of Pdx-1 regulates its transcription factor activity. Cell Mol Life Sci.
36. Gao Y, Miyazaki J, Hart GW (2003) The transcription factor PDX-1 is post-translationally modified by O-linked N-acetylglucosamine and this modification is correlated with its DNA binding activity and insulin secretion in min6 beta-cells. Arch Biochem Biophys 415: 155–163.
37. Kishi A, Nakamura T, Nishio Y, Maegawa H, Kashiwagi A (2003) Sumoylation of Pdx1 is associated with its nuclear localization and insulin gene activation. Am J Physiol Endocrinol Metab 284: E830–840.
38. Wu H, MacFarlane WM, Tadayyon M, Arch JR, James RF, et al. (1999) Insulin stimulates pancreatic-duodenal homoeobox factor-1 (PDX1) DNA-binding activity and insulin promoter activity in pancreatic beta cells. Biochem J 344 Pt 3: 813–818.
39. Mosley AL, Ozcan S (2004) The pancreatic duodenal homeobox-1 protein (Pdx-1) interacts with histone deacetylases Hdac-1 and Hdac-2 on low levels of glucose. J Biol Chem 279: 54241–54247.
40. An R, da Silva Xavier G, Semplici F, Vakhshouri S, Hao HX, et al. (2010) Pancreatic and duodenal homeobox 1 (PDX1) phosphorylation at serine-269 is HIPK2-dependent and affects PDX1 subnuclear localization. Biochem Biophys Res Commun.
41. Fan AC, Deb-Basu D, Orban MW, Gotlib JR, Natkunam Y, et al. (2009) Nanofluidic proteomic assay for serial analysis of oncoprotein activation in clinical specimens. Nat Med 15: 566–571.
42. O’Neill RA, Bhamidipati A, Bi X, Deb-Basu D, Cahill L, et al. (2006) Isoelectric focusing technology quantifies protein signaling in 25 cells. Proc Natl Acad Sci U S A 103: 16153–16158.
43. Galbo T, Pedersen IL, Floyel T, Bang-Berthelsen CH, Serup P, et al. Novel monoclonal antibodies against Pdx1 reveal feedback regulation of Pdx1 protein levels. Eur J Histochem 54: e19.
44. Rosenberg LC, Lafon ML, Pedersen JK, Yassin H, Jensen JN, et al. (2010) The transcriptional activity of Neurog3 affects migration and differentiation of ectopic endocrine cells in chicken endoderm. Dev Dyn 239: 1950–1966. 45. Carlotti F, Zaldumbide A, Charif H, de Koning EJ, Luider TM, et al. (2008)
The 45-kDa form of Pdx-1 does not result from post-translational modifications. Biochem Biophys Res Commun 370: 225–229.
46. Wu KL, Gannon M, Peshavaria M, Offield MF, Henderson E, et al. (1997) Hepatocyte nuclear factor 3beta is involved in pancreatic beta-cell-specific transcription of the pdx-1 gene. Mol Cell Biol 17: 6002–6013.
47. Kim YC, Kim SY, Mellado-Gil JM, Yadav H, Neidermyer W, et al. (2011) RB regulates pancreas development by stabilizing Pdx1. EMBO J.
48. Stanojevic V, Habener JF, Thomas MK (2004) Pancreas duodenum homeobox-1 transcriptional activation requires interactions with p300. Endocrinology homeobox-145: 2918–2928.
49. Olsen JV, de Godoy LM, Li G, Macek B, Mortensen P, et al. (2005) Parts per million mass accuracy on an Orbitrap mass spectrometer via lock mass injection into a C-trap. Mol Cell Proteomics 4: 2010–2021.
50. Cox J, Mann M (2008) MaxQuant enables high peptide identification rates, individualized p.p.b.-range mass accuracies and proteome-wide protein quantification. Nat Biotechnol 26: 1367–1372.
51. Cox J, Matic I, Hilger M, Nagaraj N, Selbach M, et al. (2009) A practical guide to the MaxQuant computational platform for SILAC-based quantitative proteomics. Nat Protoc 4: 698–705.
52. Ahnfelt-Ronne J, Jorgensen MC, Hald J, Madsen OD, Serup P, et al. (2007) An improved method for three-dimensional reconstruction of protein expression patterns in intact mouse and chicken embryos and organs. J Histochem Cytochem 55: 925–930.
53. Gradwohl G, Dierich A, LeMeur M, Guillemot F (2000) neurogenin3 is required for the development of the four endocrine cell lineages of the pancreas. Proc Natl Acad Sci U S A 97: 1607–1611.