AN ECONOMETRICAL ANALYSIS OF THE HOUSEHOLDS SAVING
BEHAVIOUR IN ROMANIA
CASE STUDY: THE MONTHLY BANK DEPOSITS
BABUCEA ANA-GABRIELA,
PROF. PHD., “CONSTANTIN BRÂNCU
Ş
I” UNIVERSITY OF TÂRGU JIU, ROMANIA
e-mail:
[email protected]
B
Ă
L
Ă
CESCU ANIELA,
ASSOC. PROF. PHD., “CONSTANTIN BRÂNCU
Ş
I” UNIVERSITY OF TÂRGU JIU, ROMANIA
e-mail:
[email protected]
Abstract
The aim is also to identify a statistical regression models appropriate and as relevant to explain the evolution of the monthly household deposits although, in this respect, of all sorts of factors identified in the literature: demographic factors and the demographic change , of income, monetary factors, factors related to the fiscal-budgetary policies, behavioral factors that seem to become determinants, and the age structure of the population of Romania, were selected only those which have been identified monthly data series from January 2012. To verify the existence of causal relationships identified and determining the nature and intensity of their methodology was used the parametric statistical analysis of the correlation resorting to specialized software package SPSS v.23 for Windows.
The paper is structured as follows: first is dedicate to the introduction and a short literature review, second part is about data overview and summary statistics, third section captures methodology and results and last section reflects conclusions.
Key Words: household deposits, model, relevant variables, time and savings deposits of households, multiple regression analysis
ClassificationJEL: E210, C100, O160
1. INTRODUCTION
Time and notice deposits of households are an important economic category being the source of funds used for loans to both households and businesses. Choosing a form of savings bank deposits indicate a preference for liquidity.
Annals of the „Constantin Brâncuşi” University of Târgu Jiu, Economy Series, Issue 4/2016
2. DATA OVERVIEW AND SUMMARY STATISTICS
The analysis is based on data from the Statistics of National Bank of Romania regarding the evolution of the time deposits and deposits redeemable at notice, in lei and in foreign exchange from households, and their contribution in total deposits from non-financial corporations, households and other together, on the period after the financial crisis, from January 2011 to March 2016. The database is present in the table below.
Table no. 1 – The evolution of the monthly Romanian Householdstime deposits and deposits redeemable at notice, in lei and in foreign exchange, in the period January 2012 – March 2016
Month
TOTAL (non-financial corporations, households, and other) time deposits and deposits redeemable at notice, in lei
and in foreign exchange, Mil. Lei
- Households, in Lei and Foreign exchange
TOTAL time deposits and deposits redeemable at notice,
in Lei Mil. Lei
- Households, in Lei
TOTAL time deposits and deposits redeemable at notice,
in foreign exchange Mil. Lei
- Households, in foreign exchange
Mil. Lei % Mil. Lei % Mil. Lei %
Jan 2016 160166,2 108473.4 67.7 101895.4 66852.1 65.6 58270.8 41621.3 71.4 Feb 2016 159624,7 107316.2 67.2 101599.8 66462.2 65.4 58024.9 40854.0 70.4 Mar 2016 159458,1 107102.8 67.2 102376.3 66363.5 64.8 57081.8 40739.3 71.4
Source: Processing by the author based by statistical data sets available on www.bnr.ro
The data indicate that, in the analyzed period, the Romanian household’s time deposits and deposits redeemable at notice, both in Lei and in currency exchange had a constant ascendant trend with values which represent important contributions in total assets mobilized by banks in this form on the domestic financial market. In this regard, the graphics below are significant.
Fig. 1 – Evolutionof the monthly Romanian Households time deposits and deposits redeemable at notice, in lei and in foreign exchange, in the period January 2012 – March 2016
3. METHODOLOGY AND RESULTS
In the analysis of households saving behavior in Romania, we used the
multiple regression. So, the dependent variable is Household deposits, measured in Lei, and currency exchange, measured in mill. Lei (HDT)On the basis of the available data, in this research was identified 4 independent variables: - IndepVar1 - Consumer price indices, in percentage (CPI);
- IndepVar2 - Monthly net average earning per total economy, in Lei/employee (AEE);
- IndepVar3 - Interest rates for time deposits and deposits redeemable at notice in Lei, in percentage (IRL); - IndepVar4 - Interest rates for time deposits and deposits redeemable at notice in Euro, in percentage
(IRE);
Table no. 2 - Data referring to the dependent variable and considered independent variables
HDT IRL IRE CPI AEE HDT IRL IRE CPI AEE
Jan 2011 84430,8 7,1 3,19 6,99 1424 aug.13 102918,9 4,65 2,54 3,67 1604
feb.11 84898,1 7,01 3,18 7,6 1414 sept.13 103015,4 4,49 2,49 1,88 1609
mar.11 84689,2 6,85 3,15 8,01 1493 oct.13 103129,3 4,33 2,39 1,88 1615
apr.11 84538,4 6,76 3,17 8,34 1498 Nov 2013 104354,4 4,16 2,31 1,83 1650
May 2011 85427 6,68 3,17 8,41 1458 dec.13 105511,1 4,03 2,25 1,55 1760
Jun 2011 86302,1 6,57 3,12 7,93 1472 Jan 2014 106426,2 3,88 2,17 1,06 1625
Jul 2011 86931,5 6,49 3,1 4,85 1471 feb.14 106255,1 3,73 2,09 1,05 1626
aug.11 87650,9 6,41 3,1 4,25 1455 mar.14 105361,2 3,6 2,02 1,04 1706
sept.11 89492,8 6,33 3,11 3,45 1464 apr.14 105385,1 3,49 1,97 1,21 1735
Annals of the „Constantin Brâncuşi” University of Târgu Jiu, Economy Series, Issue 4/2016
HDT IRL IRE CPI AEE HDT IRL IRE CPI AEE
Nov 2011 90826 6,27 3,22 3,44 1491 Jun 2014 104206,4 3,31 1,92 0,66 1687
dec.11 92380,9 6,24 3,29 3,14 1604 Jul 2014 104494,2 3,24 1,87 0,95 1719
Jan 2012 93976,2 6,25 3,32 2,72 1467 aug.14 104560,4 3,18 1,83 0,84 1683
feb.12 95175,7 6,21 3,36 2,59 1472 sept.14 104863,8 3,12 1,8 1,54 1698
mar.12 96380,3 6,09 3,37 2,4 1543 oct.14 105163,6 3,03 1,78 1,44 1705
apr.12 96805,3 5,92 3,38 1,8 1553 Nov 2014 105552,5 3 1,74 1,26 1743
May 2012 97600,5 5,74 3,37 1,79 1530 dec.14 107550,4 2,92 1,66 0,83 1866
Jun 2012 97382,7 5,58 3,35 2,04 1552 Jan 2015 108156,5 2,79 1,6 0,41 1740
Jul 2012 98919,3 5,46 3,34 3 1556 feb.15 108686,8 2,67 1,51 0,4 1731
aug.12 98165,9 5,41 3,33 3,88 1534 mar.15 108294,5 2,53 1,44 0,79 1829
sept.12 98897,8 5,37 3,29 5,33 1538 apr.15 107917,5 2,39 1,37 0,65 1857
oct.12 99549,5 5,35 3,23 4,96 1552 May 2015 107732 2,25 1,29 1,16 1806
Nov 2012 99873 5,35 3,18 4,56 1575 Jun 2015 107075,7 2,11 1,18 -1,55 1818
dec.12 100330,7 5,31 3,13 4,95 1697 Jul 2015 106069,2 2 1,08 -1,67 1849
Jan 2013 100975,7 5,3 3,07 5,97 1548 aug.15 105851,3 1,91 0,99 -1,87 1813
feb.13 101430,1 5,25 3,02 5,65 1553 sept.15 105537,9 1,81 0,91 -1,73 1833
mar.13 102438,5 5,2 2,97 5,25 1617 oct.15 105843,6 1,75 0,87 -1,64 1871
apr.13 101359,3 5,11 2,9 5,29 1661 Nov 2015 106244,2 1,7 0,83 -1,14 1918
May 2013 101975,6 4,99 2,78 5,32 1611 dec.15 107490,1 1,62 0,78 -0,93 2114
Jun 2013 102486,9 4,89 2,71 5,37 1606 Jan 2016 108473,4 1,55 0,73 -2,13 1943
Jul 2013 102250,8 4,77 2,67 4,41 1635 feb.16 107316,2 1,48 0,68 -2,68 1950
mar.16 107102,8 1,41 0,63 -2,98 2051 Source: www.bnr.ro
First, for establishing the direction and intensity of the relationship between the analyzed variables, we determined the Pearson correlation coefficients in Table 3.
Table no. 3 Correlations between variables
As can be seen, there are very strong links between the HDT and IRL, IRE, CPI, AEE, the coefficient Pearson value is over 0.750 between them, with value Sig. less than 0.05.
HDT IRL IRE CPI AEE HDT Pearson Correlation 1 -,884** -,754** -,765** ,804**
Sig. (2-tailed) ,000 ,000 ,000 ,000
N 63 63 63 63 63
IRL Pearson Correlation -,884** 1 ,967** ,870** -,938** Sig. (2-tailed) ,000 ,000 ,000 ,000
N 63 63 63 63 63
IRE Pearson Correlation -,754** ,967** 1 ,828** -,922** Sig. (2-tailed) ,000 ,000 ,000 ,000
N 63 63 63 63 63
CPI Pearson Correlation -,765** ,870** ,828** 1 -,807** Sig. (2-tailed) ,000 ,000 ,000 ,000
N 63 63 63 63 63
AEE Pearson Correlation ,804** -,938** -,922** -,807** 1 Sig. (2-tailed) ,000 ,000 ,000 ,000
N 63 63 63 63 63
For processing of data in SPSS, we used the method Backward according to which variables are eliminated until a threshold of significance set for F is not reached.
Table no.4 presents the results of the elimination variable step by step.
Table no.4 Variables Entered/Removed Model
Variables Entered
Variables
Removed Method 1 AEE, CPI, IRE,
IRLb . Enter
2
. AEE Backward (criterion: Probability of F-to-remove >= ,100). 3
. CPI Backward (criterion: Probability of F-to-remove >= ,100). a. Dependent Variable: HDT
b. All requested variables entered.
According to the table no. 4 was excluded, step by step, two variables: AEE (Monthly net average earning per total economy, in Lei) and CPI (Consumer price indices).
In table no. 5 it can observe independent variable which estimates the best the dependent variable.
Table no.5 Model Summary
Model R
R Square
Adjusted R Square
Std. Error of the Estimate
Change Statistics R Square
Change
F
Change df1 df2
Sig. F Change 1 ,970a ,940 ,936 1863,7669 ,940 228,556 4 58 ,000 2 ,970b ,940 ,937 1848,3711 ,000 ,029 1 58 ,865 3 ,968c ,938 ,936 1868,4024 -,002 2,308 1 59 ,134 a. Predictors: (Constant), AEE, CPI, IRE, IRL
b. Predictors: (Constant), CPI, IRE, IRL c. Predictors: (Constant), IRE, IRL
The value of R Square tells us that 94% of variation of HDT explains by all independent variables. The value of Sig. is less than the superior limit accepted of 0.05, result that the linear model is valid (statistically significant) and can be used.
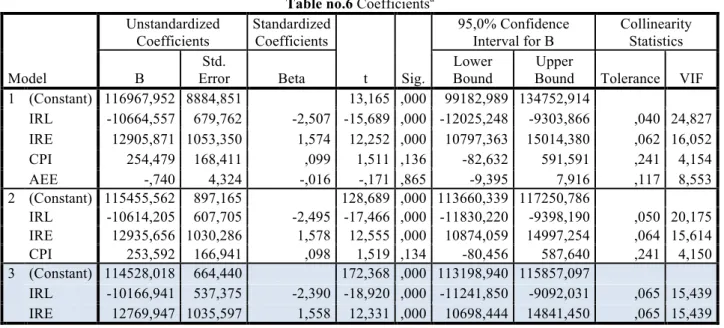
In table no.6 there is the information needed to build the right of regression.
Table no.6 Coefficientsa
Model
Unstandardized Coefficients
Standardized Coefficients
t Sig.
95,0% Confidence Interval for B
Collinearity Statistics
B
Std.
Error Beta
Lower Bound
Upper
Bound Tolerance VIF 1 (Constant) 116967,952 8884,851 13,165 ,000 99182,989 134752,914
IRL -10664,557 679,762 -2,507 -15,689 ,000 -12025,248 -9303,866 ,040 24,827 IRE 12905,871 1053,350 1,574 12,252 ,000 10797,363 15014,380 ,062 16,052 CPI 254,479 168,411 ,099 1,511 ,136 -82,632 591,591 ,241 4,154 AEE -,740 4,324 -,016 -,171 ,865 -9,395 7,916 ,117 8,553 2 (Constant) 115455,562 897,165 128,689 ,000 113660,339 117250,786
IRL -10614,205 607,705 -2,495 -17,466 ,000 -11830,220 -9398,190 ,050 20,175 IRE 12935,656 1030,286 1,578 12,555 ,000 10874,059 14997,254 ,064 15,614 CPI 253,592 166,941 ,098 1,519 ,134 -80,456 587,640 ,241 4,150 3 (Constant) 114528,018 664,440 172,368 ,000 113198,940 115857,097
Annals of the „Constantin Brâncuşi” University of Târgu Jiu, Economy Series, Issue 4/2016
Model 3 indicates that the variable IRL is a negative predictor (-10166,941), and IRE is positive predictor (12769,947). In this case, the regression equation is:
HDT = 114528,018-10166,941IRL+12769,9475IRE
According to the model, an increase in IRL with 1 percent will cause a decrease in the level of HDT with 10166,941 mil. Lei (admitting that the two variables there is a linear dependence), while an increase of 1 percent of IRE will cause an increase in the level of HDT with 12769,9475 mil. Lei (admitting that the two variables there is a linear dependence).
In table no. 7 was calculated the collinearity because a higher correlation between variables drives a strong increase in the size of standard deviation of the parameters.
Table no.7 Collinearity Diagnosticsa Model Dimension Eigenvalue
Condition Index
Variance Proportions
(Constant) IRL IRE CPI AEE 1 1 4,453 1,000 ,00 ,00 ,00 ,00 ,00
2 ,498 2,989 ,00 ,00 ,00 ,17 ,00 3 ,045 9,954 ,00 ,03 ,06 ,72 ,00 4 ,004 33,871 ,00 ,75 ,92 ,10 ,00 5 ,000 103,518 1,00 ,22 ,02 ,01 ,99 2 1 3,612 1,000 ,00 ,00 ,00 ,01
2 ,354 3,196 ,07 ,00 ,00 ,25 3 ,031 10,848 ,91 ,04 ,07 ,63 4 ,004 30,631 ,02 ,96 ,93 ,11 3 1 2,907 1,000 ,01 ,00 ,00
2 ,088 5,736 ,96 ,02 ,01 3 ,004 26,041 ,03 ,98 ,99 a. Dependent Variable: HDT
Eigenvalue shows the number of correlations that exist between independent variables. If its value closer to zero, the variables are strongly interrelated.
Condition Index is calculated as the square root of the ratio between the largest value of Eigenvalue and the value eigenvalue of each dimension. An index greater than 15 indicates that there is a possible problem of Collinearity and a value greater than 30 indicates serious problems of collinearity. These situations are present in model 1 and model 2. The excluded variables can be observed in table no.8.
Table no.8 Excluded Variablesa
Model Beta In t Sig.
Partial Correlation
Collinearity Statistics
Tolerance VIF
Minimum Tolerance 2 AEE -,016b -,171 ,865 -,022 ,117 8,553 ,040 3 AEE -,012c -,123 ,902 -,016 ,117 8,545 ,050 CPI ,098c 1,519 ,134 ,194 ,241 4,150 ,050 a. Dependent Variable: HDT
b. Predictors in the Model: (Constant), CPI, IRE, IRL c. Predictors in the Model: (Constant), IRE, IRL
Beta in represents value of the regression coefficient of variables AEE and CPI if it had not been excluded from the model. Statistics of t and Sig value are analyzed for to test the hypothesis if between the excluded independent variable and the dependent variable are there is no significant connection.
4. CONCLUSIONS
From the analysis based on the regression between Household deposits in lei and currency exchange and the four variables, it can notice although apparently the Consumer price indices (CPI) and Monthly net average earning per total economy (AEE) would have been, in normal circumstances, determinants of financial behavior of the population, they have not proved enough significant to be included in a regression generalizable model, the only variable correlated determining factor being only Interest rates for time deposits and deposits redeemable at notice in Lei (IRL) and Interest rates for time deposits and deposits redeemable at notice in Euro (IRE).
For a better description of the process of saving the population under the impact of factors influence it could be envisaged developments structural change of the Romanian population by age groups over the period considered and the distribution of active and retired territorial units, counties or regions development, household savings may be of a precautionary given the waning confidence in the ability of its public pension system unable to provide sufficient consumer spending and health at retirement, rather than for purposes of future consumption. Certanly the savings behavior was dictated by experience with the harmful household lending prior period financial crisis that is now the population segment more cautious in terms of consumption, preferring to first save and then decide to purchase some goods durable or buildings. We can consider that a certain effect to boost the household savings due to the national central bank which since 2011 has initiated and developed a diverse range of financial education programs, especially among the young and very young population.
5. BIBLIOGRAPHY
1. Babucea A.G., Recent aspects on territorial disparities in financial behaviour of households in Romania,
Annals of the „Constantin Brâncuşi” University of Târgu Jiu, Economy Series, Issue 3 / 2016, pp.198-205; 1. Băcescu-Cărbunaru A., Condruz-Băcescu, M., Statistică teoretică şi practică: seriile teritoriale/de spaţiu -
sistem de indicatori şi indici, reprezentări grafice sugestive, Revista Română de Statistică nr. 12 / 2012, pp.3-14;
2. Bozena F., The factors affecting the level of household savings and their influence on economy development, 8 th International scientific conference Financial management of firms and financial institutions Ostrava VŠB-TU Ostrava, faculty of economics, finance department 6th – 7th September 2011
3. Dukić D., Dukić G., Turkalj D., Computer data analysis aimed at constructing A model of establishing the factors which determine household savings in the republic of Croatia, Interdisciplinary Management Research, 2007, vol. 3, pp.99-111
4. Gogonea, R.M., Statistică: baza teoretico-aplicativă pentru comerţ-servicii-turism, Editura Universitară, 2009; 5. Guran (Teodorescu) I., Trends in retirement saving: evidence from an online survey of romanian households,
Annals of the „Constantin Brâncuşi” University of Târgu Jiu, Economy Series, Issue 2 / 2015, pp. 300-306; 6. Keynes. J. M. (1936). The general theory of employment, interest and money. London: MacMillan.
7. Minică M., Consumption and Saving: Between Theory and Romanian Reality, Annals of Eftimie Murgu University Resita, Fascicle II, Economic Studies. 2012, p75-83;
8. Oprea C., Zaharia M., Elemente de analiza datelor şi modelare utilizând Excel, - Editura Universitară, 2011; 9. Niculescu-Aron I.G., An Analysis of the Saving Behavior in Romania. Comparative Study For 2012 And 2011
Based On The “Financial Situation Of The Romanian Households” Enquiries, Research Journal of Economics, Business and ICT, Vol 6 2012, pp.20-25;
10. Ruxanda G., Analiza datelor, Editura ASE, Bucureşti, 2001;
11. Săvoiu, G., Crăciuneanu, V., Ţaicu, M., A New Method of Statistical Analysis of Markets’ Concentration or Diversification, Romanian Statistical Review nr. 2 / 2010, p. 15-21
12. Zaharia M., Babucea A.G., Bălăcescu A., Dynamics and their determinants in household deposits in lei. Case of Romania after the financial crisis of 2008, Annals of 'Constantin Brancusi' University of Targu-Jiu, 2015, Special, p237-240;
13. www.bnr.ro- Official site of Romanian National Bank
14. www.cnp.ro - -Official site of Romanian National Prognosis Commission