Perimetria de freqüência duplicada na detecção de defeitos campimétricos discretos e
moderados (à perimetria convencional) causados por tumores hipofisários
From the Department of Ophthalmology, Universidade de São Paulo - USP - São Paulo (SP) - Brazil. 1Livre Docente do Departamento de Oftalmologia da
Uni-versidade de São Paulo - USP - São Paulo (SP) - Brasil. 2Pós-graduando da USP - São Paulo (SP) - Brasil. 3Pós-graduando da USP - São Paulo (SP) - Brasil.
Corresponding Author: Mário L. R. Monteiro. Av. An-gélica, 1757 - Cj. 61 - São Paulo (SP) CEP 01227-200 E-mail: [email protected]
Recebido para publicação em 01.06.2006 Última versão recebida em 29.08.2006 Aprovação em 04.10.2006
Mário Luiz Ribeiro Monteiro1
Frederico Castelo Moura2
Leonardo Provetti Cunha3
INTRODUCTION
Pituitary tumors (PT) are relatively common lesions that may compress the anterior visual pathways producing loss of vision. Treatment, either medical or with surgery (usually transphenoidal) is associated with very high success rates(1). PT are almost always benign but do have a high rate
of recurrence.
Although modern neuro-imaging techniques have decreased the re-liance on visual field (VF) testing for the diagnosis of PT, it is still of crucial importance in the diagnosis and follow-up of such patients(2). Goldmann’s
moderate pituitary tumor-associated visual field defects
detected by conventional perimetry
Keywords: Perimetry/methods; Pituitary neoplasms; Visual fields; Vision disorders
Purpose: To test the ability of frequency doubling technology (FDT) perimetry to identify pituitary tumor-associated visual field defects.
Methods: Twenty-threeeyes from patients with pituitary tumor (PT) and 28 normal eyes were studied. Subjects were eligible when presenting with normal visual acuity and mild or moderate temporal field loss in at least one eye on Goldmann and standard automated perimetry (SAP). FDT testing was performed using the C-20-5 screening and the C-20 full-threshold test. The sensitivity and specificity for identification of the field defect were determined and the groups were compared with regard to several parameters. Finally, we compared the ability of FDT and SAP to detect the characteristic pattern of temporal hemianopia/quadran-tanopia. Results: In the screening test, sensitivity ranged from 21.74% to 43.48% while specificity was 100%. In the threshold test, sensitivity ranged from 52.17% to 82.61% (specificities of 85.71% and 60.71%, respectively), according to total deviation analysis, and from 30.43% to 73.91% (specificities of 96.42% and 64.28%, respectively), according to the pattern deviation analysis. Patients with PT presented a significantly higher number of abnormal points in the temporal hemifield. In 12 eyes FDT and SAP were both able to identify the characteristic pattern of visual field defect; in 4 eyes FDT performed better than SAP; in 4 eyes, SAP performed better than FDT, while in 3 neither test was able to determine the pattern of visual field defect correctly. Conclusions: Threshold FDT perimetry seems to be a sensitive instrument for iden-tifying abnormality in eyes with chiasmal compression-induced field defects detected on conventional perimetry.
manual perimeter (GP) is still valuable in the detection of field defects of neurological origin but modern automated peri-metry does have its advantages(3), especially in view of the
increasing scarcity of physicians and technicians fully trained in manual GP. The current standard in automated perimetry is full-threshold testing encompassing either 24 or 30 central degrees of the VF. Although strategies such as the Swedish Interactive Threshold Algorithm program(4) have significantly
improved the reliability of automated perimetry, it still may be too difficult for patients with neurological disease, resulting in undesirable false positive data capable of confounding the interpretation of abnormal findings(5). There is therefore a
need for tests which can rapidly and accurately identify cases deserving further testing and investigation.
The frequency doubling technology (FDT) perimeter is a recently introduced modality of VF test device developed mainly to detect glaucomatous damage(6-7). It makes use of the
frequency-doubling illusion by which a sine-wave grating of low spatial frequency undergoing counterphase flicker at high temporal frequency appears to the observer to have twice the actual number of bars(8). FDT perimetry may be a sensitive
method to detect a field defect and has the advantage of being user-friendly. Since its introduction FDT has been used to study a range of different diseases and seems to be of benefit to patients with neuro-ophthalmic conditions(9-11). However,
so far no study has specifically addressed cases with PT-asso-ciated VF defects, especially mild cases.
The purpose of this paper was to test the ability of FDT perimetry to identify mild and moderate PT-associated VF defects as detected by conventional perimetry, as well as to evaluate FDT perimetry as a screening tool for chiasmal compression.
METHODS
Between December 2002 and October 2005, 51 eyes were submitted to FDT perimetry. Of these, 23 were from 16 patients with PT, with either active or previous chiasmal compression. The remaining 28 eyes were from 14 normal controls. Nine eyes from the 18 patients with PT were not included in the study because they did not fulfil the inclusion criteria for the study. The mean age (± SD) of patients with PT and healthy indi-viduals was 44.15 ± 10.38 and 38.86 ± 8.10, respectively (p=0.13, thus non-significant). The study was approved by an Ethics Committee and all participants gave their informed consent.
The patients underwent a complete ophthalmologic exami-nation including VF testing performed using both manual GP (Haag-Streit AG, Bern, Switzerland) and automated perimetry. On GP the V-4-e, I-4-e, I-3-e, I-2-e and I-1-e stimuli were used to kinetically draw the isopters and search for scotomas. Special attention was given to defects along the vertical meridian. Standard automated perimetry (SAP) was performed with a Humphrey field analyzer 750 (Zeiss-Humphrey, Dublin, CA) using a 4 mm2 Goldmann size III stimulus. Either the 24-2
Full-threshold test or the 24-2 Swedish Interactive Threshold Al-gorithm (SITA) Standard test was used.
Patients were selected for study based on the results of GP. To be included in the study the patient should have in at least one eye: best corrected visual acuity of 20/20 or better in the study eye and mild or moderate temporal VF loss on GP (usually in the upper temporal quadrant) with a nasal hemifield within normal limits.
VF defects were limited to mild or moderate in severity. To be included in the study, on GP, the examined eye should present a VF defect limited to the temporal field with I/3e, I/2e or I/1e targets, and normal I/4e and V/4e isopters. VF defects should respect the vertical meridian. In patients with mild VF loss, a vertical step of at least 10 degrees difference between the nasal and the temporal upper quadrant with a clear respect to the vertical meridian was required for labeling the eye as abnormal. VF defects were also classified on SAP, based on the criteria proposed by Kerrison et al(12). According to this
study, a calculated mean deviation in the upper temporal drant was recorded. Deviations in the upper temporal qua-drant were calculated by averaging the deviations of the most central 12 points in such quadrant(12). For classification
pur-poses, VF defects were considered mild when the upper tem-poral mean deviation (U.T.M.D.) ranged from -3.0 to -6.0 decibels and moderate when the U.T.M.D. ranged from -6.01 to -20.00 decibels.
Other inclusion criteria were: good cooperation for perfor-ming VF examination, spherical refraction within ±5 D; cylinder correction within ±3 D; intraocular pressure below 22 mmHg; and reliable VF. GP was considered reliable when the patient presented good fixation and consistent responses during exa-mination performed by an experienced physician. A reliable SAP was defined as one with fewer than 25% fixation losses, false positive or false negative responses. Patients with clinical signs of glaucoma or optic disc anomaly were excluded.
In 9 patients only one eye and in 7 both eyes met the inclu-sion criteria. The control group consisted of normal healthy volunteers, with a normal ophthalmic examination including Humphrey perimetry (24-2 SITA Standard threshold test). Normal eyes had intraocular pressures of 22 mmHg or less with no history of increased IOP and normal optic discs. Normal healthy volunteers had both eyes examined.
FDT perimetry was performed after conventional perime-try, with a rest period of at least 15 minutes between them. Testing was performed in a darkened room using an FDT device (Humphrey-Welch Allyn, Dublin, CA). Patients and controls were submitted to both the C-20-5 screening mode and the C-20 full-threshold mode. Both strategies test four locations in each quadrant and one central location, giving a total of 17 locations tested in the central 20º of the visual field. In each tested area the FDT device presents frequency-dou-bling stimuli (10x10) with low spatial frequency, cosinusoidal grating (0.25 cycle/degree) and high temporal frequency (25 Hz counter-phase flicker) on a square background.
second time and are labeled p≥5% if the subject responds. If the second stimulus is missed, a third stimulus is presented corresponding to what is seen by 98% of the normal popu-lation (missed by 2% of normals). If this is seen, the location is labeled p<5%. If however the third stimulus is missed, a fourth stimulus is presented corresponding to what is seen by 99% of the normal population. If this is seen, the location is labeled p<2%, and, if missed, p<1%(9,14).
The C-20 full threshold protocol determines the minimum contrast necessary to detect the stimulus for each of the 17 target locations in the stimulus display and requires approxi-mately 4 minutes per eye(10). The test provides information on
threshold (dB) plots, deviation plots with a five-probability-level classification based on age-related normative reference, mean deviation (MD) and pattern standard deviation statistical Global indices values. Only reliable fields were accepted in the study. Reliable visual fields had less than 33% false positive and false negative responses and less than 20% fixation losses. We tested several sets of diagnostic criteria to assess the validity of FDT in detecting abnormality in eyes of patients with PT. Using GP as the gold standard for defining abnorma-lity, we calculated the sensitivity and specificity for a number of predefined criteria for both the C-20-5 screening protocol and the C-20 threshold test. In the first scenario, eyes were considered abnormal when displaying abnormal points any-where in the visual field (one abnormal point depressed <2%; two abnormal adjacent points, both <5%; two abnormal adja-cent points, one <5% and one <2%; two abnormal adjaadja-cent points, one <5% and one <1%). Second, we counted the num-ber of abnormal points in the temporal hemifield (two abnormal temporal points, both <5%; two abnormal temporal points, one <5% and one <2%; two abnormal temporal points, one <5% and one <1%; three abnormal temporal points <5%; three abnormal temporal points two <5% and one <2%). Third, we verified the number of excessive abnormal points in the tem-poral hemifield compared to the nasal hemifield (temporo-nasal difference of abnormal points >2). Sensitivity and speci-ficity were calculated for each set of criteria.
In addition, we compared the two groups with regard to the number of abnormal points assuming an <5% probability of being normal in the nasal and the temporal hemifield on both the screening C-20-5 test and the full-threshold C-20 test (consi-dering both total and pattern deviation). We also compared the mean deviation (MD), temporal and nasal sensitivity calculated from the sensitivity points in the full-threshold test, and the temporo-nasal difference in sensitivity in both groups.
Finally, using GP as the gold standard, we compared the ability of FDT and SAP to detect the characteristic pattern of temporal hemianopia/quadrantanopia.
Sensitivity and specificity were calculated in the traditio-nal manner. We used either the unpaired t-test or the Mann-Whitney U test (depending on compliance with normal distri-bution assessed by the Shapiro-Wilk test) for comparisons between the groups of patients and normal subjects. The chi-square test was used to analyze differences in the ability of FDT and SAP to detect VF detects. The level of statistical significance was set at p<0.05.
RESULTS
Nine patients were male and 9 female, with age ranging from 26 to 68 years. Two had active compression of the visual pathways while the remainder had chiasmal decompression more than 6 months earlier. The U.T.M.D. in patients with PT ranged from -2.5 to -20.0 (-7.5 ± 6.29). In the control group age ranged from 21 to 52 years.
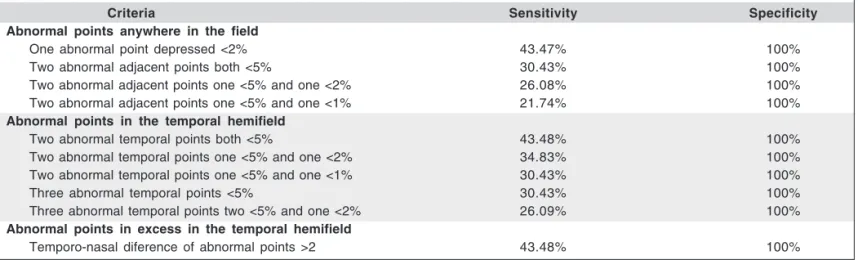
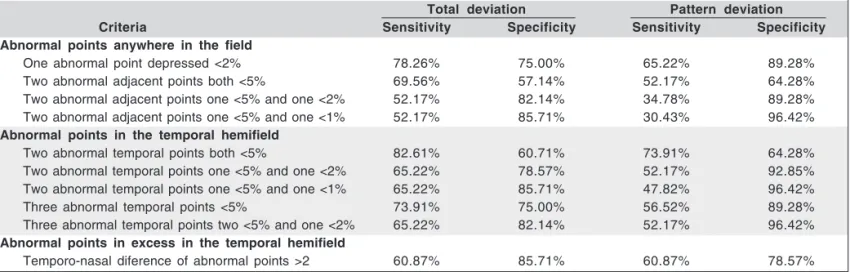
Tables 1 and 2 show the sensitivity and specificity found for the three sets of criteria on the C-20-screening test and the C-20-5 full-threshold test. Screening test: sensitivity ranged from 21.74% (two abnormal adjacent points, one <5% and one <1%) to 43.48% (two abnormal temporal points, both <5%), specificity was 100% (Table 1). Threshold test: sensitivity ranged from 52.17% (specificity 85.71%) to 82.61% (specificity 60.71%) in the total deviation analysis and from 30.43%
Table 1. The sensitivity and specificities of three groups of criteria used in the C-20-5 screening test in eyes subtle and moderate field defects from pituitary adenoma
Criteria Sensitivity Specificity
Abnormal points anywhere in the field
One abnormal point depressed <2% 43.47% 100%
Two abnormal adjacent points both <5% 30.43% 100%
Two abnormal adjacent points one <5% and one <2% 26.08% 100%
Two abnormal adjacent points one <5% and one <1% 21.74% 100%
Abnormal points in the temporal hemifield
Two abnormal temporal points both <5% 43.48% 100%
Two abnormal temporal points one <5% and one <2% 34.83% 100%
Two abnormal temporal points one <5% and one <1% 30.43% 100%
Three abnormal temporal points <5% 30.43% 100%
Three abnormal temporal points two <5% and one <2% 26.09% 100%
Abnormal points in excess in the temporal hemifield
(specificity 96.42%) to 73.91% (specificity 64.28%) in the pattern deviation analysis (Table 2).
Table 3 shows the comparison of the number of abnormal points (p<5%), the mean deviation, the temporal and the nasal mean sensitivity and the temporo-nasal difference in sensiti-vity of the two groups. The number of abnormal points in the temporal hemifield was significantly higher in patients with PT. Differences in temporal mean deviation and temporo-nasal mean deviation were also significant (p=0.001).
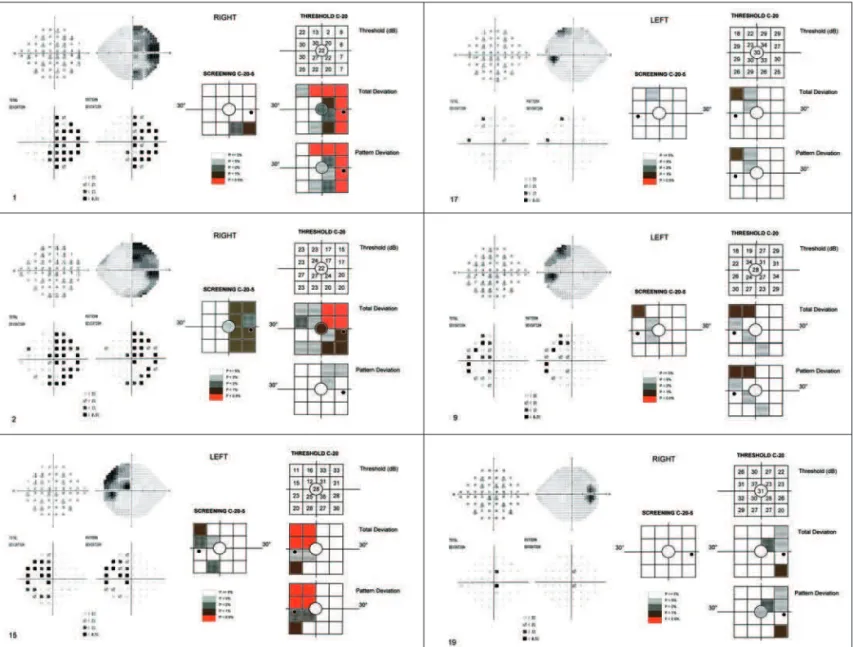
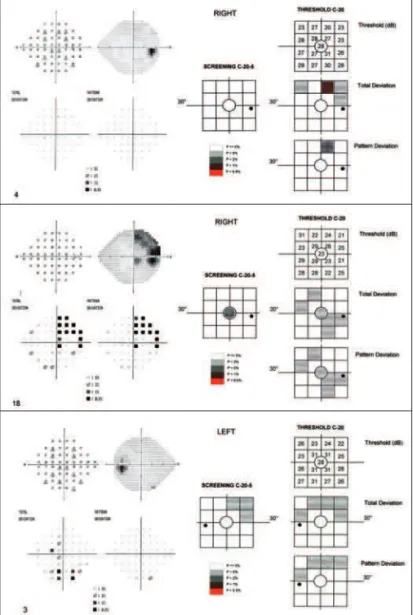
Figures 1 and 2 show the results of SAP and FDT perimetry for each one of the 23 eyes from patients with PT. In 12 eyes FDT and SAP were both able to identify the characteristic pattern of VF defect (Figure 1). In 4 eyes, FDT performed
better than SAP; in 4 eyes, SAP performed better than FDT, while in 3 eyes neither test was able to determine the pattern of VF defect correctly (Figure 2).
DISCUSSION
Despite advances in neuroimaging methods allowing vi-sualization of the suprasellar area, VF examination is still of invaluable importance in the diagnosis and management of patients with PT. While GP was for many years considered the gold standard of VF examination in patients with neuro-oph-thalmic conditions, recent advances have made computerized
Table 2. The sensitivity and specificities of three groups of criteria used in the C-20 threshold test in eyes with mild and moderate field defects from pituitary adenoma
Total deviation Pattern deviation Criteria Sensitivity Specificity Sensitivity Specificity Abnormal points anywhere in the field
One abnormal point depressed <2% 78.26% 75.00% 65.22% 89.28%
Two abnormal adjacent points both <5% 69.56% 57.14% 52.17% 64.28%
Two abnormal adjacent points one <5% and one <2% 52.17% 82.14% 34.78% 89.28%
Two abnormal adjacent points one <5% and one <1% 52.17% 85.71% 30.43% 96.42%
Abnormal points in the temporal hemifield
Two abnormal temporal points both <5% 82.61% 60.71% 73.91% 64.28%
Two abnormal temporal points one <5% and one <2% 65.22% 78.57% 52.17% 92.85%
Two abnormal temporal points one <5% and one <1% 65.22% 85.71% 47.82% 96.42%
Three abnormal temporal points <5% 73.91% 75.00% 56.52% 89.28%
Three abnormal temporal points two <5% and one <2% 65.22% 82.14% 52.17% 96.42%
Abnormal points in excess in the temporal hemifield
Temporo-nasal diference of abnormal points >2 60.87% 85.71% 60.87% 78.57%
Table 3. Comparison using Student’s t test or Mann Whitney U test between values obtained in both the group of eyes from patients with pituitary adenoma and from normal controls in the screening test as well as in the threshold C-20 test
Pituitary adenoma (n=23) Controls (n=28) p* Screening test
Total abnormal points 1.95 ± 2.26 0.21 ± 0.49 <0.001
Abnormal temporal points 1.78 ± 1.99 0.17 ± 0.39 <0.001
Abnormal nasal points 0.09 ± 0.29 0.03 ± 0.18 0.440
Temporo-nasal diference in abnormal points 1.69 ± 1.87 0.14 ± 0.35 <0.001
C-20 threshold test total deviation
Total abnormal points 5.65 ± 3.82 3.71 ± 4.68 0.110
Abnormal temporal points 3.87 ± 2.47 1.82 ± 2.40 0.004
Abnormal nasal points 1.52 ± 1.81 1.71 ± 2.30 0.740
Temporo-nasal diference in abnormal points 2.34 ± 2.53 0.07 ± 1.56 <0.001
C-20 threshold test pattern deviation
Total abnormal points. 3.91 ± 2.55 2.25 ± 2.18 0.017
Temporal abnormal points 3.26 ± 2.30 1.18 ± 1.19 <0.001
Nasal abnormal points 0.48 ± 0.73 0.96 ± 1.31 0.120
Temporo-nasal diference in abnormal points 2.78 ± 2.39 0.25 ± 1.40 <0.001
Mean deviation -3.15 ± 2.13 -1.90 ± 2.28 0.050
Temporal mean sensitivity 23.63 ± 4.02 27.71 ± 3.22 0.001 Nasal mean sensitivity 28.21 ± 2.49 28.56 ± 3.00 0.490 Temporo-nasal difference in sensitivity -4.57 ± 3.90 -0.85 ± 1.41 <0.001
several patients with “typical” neuro-ophthalmic VF defect and found FDT perimetry to be a quite sensitivite and specific detection tool. However, FDT perimetry could not adequately categorize the VF defect into characteristic patterns such as hemianopic, quadrantanopic or glaucomatous. Other authors(10),
on the other hand, observed that the sensitivity and specifi-city of FDT perimetry equalled those of SAP in patients with VF defects from optic neuropathy but failed to identify pa-tients with hemianopia.
In our study FDT revealed abnormalities in almost all eyes when observed in the full-threshold test, compatible with a sensitive method to detect VF defects. On the other hand, when the “screening” test was analyzed (with supraliminal stimuli) it was found to have poor sensitivity to detect chias-mal VF defects. This finding is in accordance with those of some authors(17) who concluded that the FDT screening
stra-tegy failed to identify hemianopic and quadrantanopic VF perimetry the most commonly used method today(15). Many
authors believe that SAP can detect abnormalities earlier than manual GP, due to its greater sensitivity and ability to make comparisons for each point(15). However, despite the many
advantages in SAP technology, there are many drawbacks of this type of examination when applied to neuro-ophthalmo-logic patients, particularly those with severe visual loss and those with attention deficits(5,16).
FDT perimetry is a relatively simple method and will ac-complish an examination in less than one minute in the scre-ening mode. Quick and user-friendly operation makes this technique attractive, especially for neurologic patients. Fuji-moto and Adachi-Usami(11) tested FDT perimetry in 14
pa-tients affected with recovered optic neuritis (normal visual acuity) and observed a generalized sensitivity depression, while control testing with SAP revealed a depression in the central area of the VF only. Likewise, some authors(9) examined
defect in more than half of the studied 15 eyes. Our study indicates that the full-threshold FDT test is a sensitive me-thod for detecting VF defects even in patients with subtle or moderate defect on GP. This finding differs from results obtai-ned by other authors(10). These authors found that FDT
peri-metry failed to detect hemianopias in a substantial number of patients and indicated a variety of mechanisms to explain this observation. They suggested a scatter of light from the stimu-lus from the nonseeing into the seing hemifield (along the vertical meridian) and shifts in fixation as the possible expla-nation for failure to identify hemianopic field defect.
In the current study, however, FDT was found to be a sensitive method for identifying VF abnormality. Although several eyes presented abnormalities in the nasal hemifield too, the phenomenon is also rather frequent when using SAP (Figure 2), and in most such cases abnormalities in the
tempo-ral hemifield were much more prominent and allowed identifi-cation of the temporal VF defect compatible with chiasmal compression. Therefore, as in other psychophysical tests, a high level of suspicion with regard to clinical findings and suspected disease is recommendable. Future studies testing stimulus offset a few degrees away from the vertical(10) will
probably improve the results of the test; however, the actual usefulness of this type of perimetry in neuro-ophthalmology will require testing on somewhat larger study populations.
RESUMO
Objetivo: Avaliar a capacidade da perimetria com tecnologia de freqüência duplicada (FDT) de identificar defeitos de cam-po visual associados a tumores pituitários. Métodos: Vinte e três olhos de pacientes com tumores pituitários (TP) e 28 olhos normais foram estudados. Os indivíduos eram selecio-nados quando apresentavam acuidade visual normal e defeito temporal discreto ou moderado em pelo menos um olho ao perímetro de Goldmann e à perimetria automatizada padrão (SAP). O teste com FDT foi realizado usando os programas “C-20-5 screening” e “C-20 full-threshold test”. A sensibilida-de e a especificidasensibilida-de para isensibilida-dentificação sensibilida-de sensibilida-defeito campimé-trico foram determinados e os grupos comparados com relação a diversos parâmetros. Por fim, nós comparamos a capacidade do FDT e da SAP em detectar o padrão característico de he-mianopsia/quadrantopsia temporal. Resultados: No teste de “screening”, a sensibilidade oscilou entre 21,74% e 43,48% ao passo que a especificidade foi 100%. No “threshold test”, a sensibilidade variou entre 52,17% e 82,61% (especificidade entre 85,71% e 60,71%), na análise do “total deviation”, e de 30,43% a 73,91% (especificidade de 96,42% a 64,28%), de acordo com a análise do “pattern deviation”. Pacientes com TP apresentaram número significativamente maior de pontos de falhas no hemicampo temporal. Em 12 olhos FDT e SAP foram ambos capazes de identificar o padrão característico de defeito de campo visual, em 4 olhos FDT foi melhor que SAP; em 4 olhos, SAP foi melhor que o FDT, ao passo que em 3 olhos, nenhum dos dois testes foi capaz de determinar o padrão característico de defeito de campo visual corretamen-te. Conclusões: A perimetria FDT “threshold” parece ser ins-trumento sensível para identificar anormalidades em olhos com defeito de campo induzidos por compressão quiasmática detectados à perimetria convencional.
Descritores: Perimetria/métodos; Neoplasias hipofisárias; Campos visuais; Transtornos da visão
REFERENCES
1. Anderson D, Faber P, Marcovitz S, Hardy J, Lorenzetti D. Pituitary tumors and the ophthalmologist. Ophthalmology. 1983;90(11):1265-70.
2. Grochowicki M, Vighetto A, Berquet S, Khalfallah Y, Sassolas G. Pituitary adenomas: automatic static perimetry and Goldmann perimetry. A comparative study of 345 visual field charts. Br J Ophthalmol. 1991;75(4):219-21.
Figure 2 - Standard automated and frequency doubling technology (FDT) perimetry in eyes with temporal visual field defect on Goldmann perimetry. Above, one of four eyes in which FDT perimetry performed better than standard automated perimetry (SAP). Middle, one of four eyes in which SAP performed better than FDT perimetry. Below, one of three eyes in which neither test was able to demonstrate the
3. Anderson D, Patella V. Automated static perimetry. 2nd ed. St. Louis: CV Mosby; 1999. p.1-363.
4. Bengtsson B, Heijl A, Olsson J. Evaluation of a new threshold visual field strategy, SITA, in normal subjects. Swedish Interactive Thresholding Algo-rithm. Acta Ophthalmol Scand. 1998;76(2):165-9.
5. Monteiro MLR, Pereira A. Perimetria computadorizada na detecção de defeitos campimétricos discretos (ao perímetro de Goldmann) causados por tumores hipofisários. Arq Bras Oftalmol. 2003;66(6):803-9.
6. Johnson CA, Samuels SJ. Screening for glaucomatous visual field loss with frequency-doubling perimetry. Invest Ophthalmol Vis Sci. 1997;38(2):413-25. 7. Quigley HA. Identification of glaucoma-related visual field abnormality with the screening protocol of frequency doubling technology. Am J Ophthalmol. 1998;125(6):819-29.
8. Kelly D. Frequency doubling in visual responses. J Opt Soc Am. 1966;56 (11):1628-33.
9. Thomas D, Thomas R, Muliyil JP, George R. Role of frequency doubling perimetry in detecting neuro-ophthalmic visual field defects. Am J Ophthal-mol. 2001;131(6):734-41.
10. Wall M, Neahring RK, Woodward KR. Sensitivity and specificity of frequency
doubling perimetry in neuro-ophthalmic disorders: a comparison with conven-tional automated perimetry. Invest Ophthalmol Vis Sci. 2002;43(4):1277-83. 11. Fujimoto N, Adachi-Usami E. Frequency doubling perimetry in resolved
optic neuritis. Invest Ophthalmol Vis Sci. 2000;41(9):2558-60.
12. Kerrison JB, Lynn MJ, Baer CA, Newman SA, Biousse V, Newman NJ. Stages of improvement in visual fields after pituitary tumor resection. Am J Ophthalmol. 2000;130(6):813-20.
13. Adams CW, Bullimore MA, Wall M, Fingeret M, Johnson CA. Normal aging effects for frequency doubling technology perimetry. Optom Vis Sci. 1999;76(8):582-7.
14. Anderson AJ, Johnson CA. Frequency-doubling technology perimetry. Oph-thalmol Clin North Am. 2003;16(2):213-25.
15. Katz J, Tielsch JM, Quigley HA, Sommer A. Automated perimetry detects visual field loss before manual Goldmann perimetry. Ophthalmology. 1995;102(1):21-6. 16. Pereira A, Monteiro ML. Perimetria computadorizada e manual em pacientes com defeitos perimétricos temporais avançados causados por tumores supra-selares. Arq Bras Oftalmol. 2005;68(5):587-91.
17. Fong KC, Byles DB, Constable PH. Does frequency doubling technology pe-rimetry reliably detect neurological visual field defects? Eye. 2003;17(3):330-3.