DOI: 10.1590/0004-282X20130219
ARTICLE
Investigation of magnetic resonance
imaging texture analysis as an aid tool for
characterization of refractory epilepsies
Investigação da análise de textura em imagem de ressonância magnética como auxílio
para caracterização de epilepsias refratárias
Maurício Martins Baldissin1, Edna Marina de Souza2
1Departamento de Neurologia, Faculdade de Ciências Médicas, Universidade Estadual de Campinas, Campinas SP, Brazil;
2Departamento de Engenharia Biomédica, Faculdade de Engenharia Elétrica e Computação, Universidade Estadual de Campinas, Campinas SP, Brazil;
Correspondence: Maurício Martins Baldissin; Clínica de Neurodiagnose; Avenida Dr. Pedro Soares de Camargo 543 / sétimo andar / conj. 73/74; 13208-080 Jundiaí SP - Brasil; E-mail: [email protected]
Conflict of interest: There is no conflict of interest to declare.
Received 17 June 2013; Received in final form 03 July 2013; Accepted 10 July 2013.
ABSTRACT
Refractory epilepsies are syndromes for which therapies that employ two or more antiepileptic drugs, separately or in association, do not result in control of crisis. Patients may present focal cortical dysplasia or diffuse dysplasia and/or hippocampal atrophic alterations that may not be detectable by a simple visual analysis in magnetic resonance imaging. The aim of this study was to evaluate MRI texture in regions of interest located in the hippocampi, limbic association cortex and prefrontal cortex of 20 patients with refractory epilepsy and to compare them with the same areas in 20 healthy individuals, in order to find out if the texture parameters could be related to the presence of the disease. Of the 11 texture parameters calculated, three indicated the existence of statistically significant differences between the studied groups. Such findings suggest the possibility of this technique contributing to studies of refractory epilepsies.
Keywords: refractory epilepsies, magnetic resonance, texture analysis.
RESUMO
Epilepsias refratárias compreendem síndromes para as quais as terapias que empregam duas ou mais drogas antiepilépticas, isolada-mente ou em associação, não resultam no controle da frequência das crises. Portadores podem apresentar displasias corticais focais ou difusas e/ou alterações atróficas hipocampais que, em alguns casos, não são detectáveis por uma simples análise visual nas imagens de ressonância magnética. Nesse contexto, o objetivo deste estudo foi avaliar a textura de imagens de RM em regiões de interesse localizadas nos hipocampos, córtex de associação límbico e córtex pré-frontal de 20 pacientes com epilepsia refratária e compará-las às mesmas áreas de um grupo de 20 indivíduos sadios. Dos 11 parâmetros de textura calculados, três indicaram a existência de diferenças estatis-ticamente significantes entre os grupos estudados. Tais achados sugerem a possibilidade desta técnica contribuir para os estudos das epilepsias de difícil controle.
Palavras-chave: epilepsias refratárias, ressonância magnética, análise de textura.
Refractory epilepsies involve syndromes for which the therapies that employ two or more antiepileptic drugs (AEDs), separately or in association, do not result in control of crisis frequency1,2. In Brazil, among the people afected by
epilepsy, totaling approximately 3 million, 30% are refractory to drug therapy3.
Among patients with refractory epilepsy, 40% present hi p
pocampal atrophy in cases of temporal lobe epilepsy (TLE)4,5
and 35% present focal cortical dysplasia (FCD) in cases of extratemporal epilepsy6.
FCD is characterized by alterations in the microarchi
tecture of the cerebral cortex, in which dysmorphic neurons (giant, dysplastic) and balloon cells may or may not be ob
served. he presence or absence of abnormal cells results in two possible classiications for FCD. In type 1 FCD, we can observe the loss of the laminar pattern of the cortex without the presence of abnormal cells; in type 2 FCD, in turn, there is the presence of dysplastic neurons or balloon cells asso
ciated with loss of cortical lamination. In the magnetic reso
the cortex, abnormal cortical signals and blurring in areas in corticosubcortical transition. Of the patients that present
epilepsy associated with FCD, approximately 55% are refrac tory to the medication6.
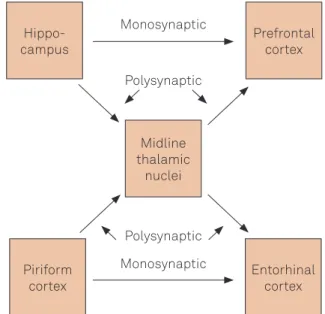
TLE is a syndrome in which the ictal activity starts in the temporal lobe, where it is possible to observe the occur
rence of mesial temporal sclerosis (MTS), which besides the hippocampus can also afect neighboring structures such as the amygdala and the entorhinal cortex, like shows the Figure 1. In MRI, it is possible to observe atrophies both of the hippocampus and of the other temporal lobe structu
res5,7. Of the patients afected by this syndrome, 40% are re
fractory to the medication5.
Nevertheless, many patients with a clinical picture of re
fractory epilepsy present visibly normal MRI and no volu
metric abnormality in the brain structures59. Various studies show that TLE involves the mesial limbic structures, which are abnormal in many patients. he surgical removal of these areas can contribute to crisis control1012.
MRI is a diagnostic imaging technique broadcast that has been widespread since the early 80s. It is a method that enables the obtainment of images of organs with high spa
tial resolution without the use of ionizing radiation. he te chnique is used extensively in neurology, both for structural and functional evaluations. he versatility of the image cap ture parameters and the diversity of data processing tools
enable its adaptation to a vast array of clinical situations. In this study we used MRI processing by texture analy
sis, which is being increasingly explored in clinical surveys. his is because histological modiications may be revealed as alterations in the MRI signal detected by this technique. In
this case, the statistical parameters of texture of these images
may be diferent from those observed for normal subjects1316.
he texture of an MRI image, in this study, refers to the ap
pearance, structure and arrangement of the objects along it. It is a descriptor with the potential to distinguish between su
pericial characteristics of objects in the image, such as uni formity, roughness and smoothness. Although there are se
veral ways of describing the texture of images, the approach that has been applied most often to medical images is the cooccurrence matrix, which is based on the distribution of the grey levels in a given region of interest (ROI) of the eva luated image and on their neighborhood relations1719.
he application of diferent approaches of the texture
analysis technique to the study of epilepsy is not new. In 2001, Yu et al. found alterations of texture in the hippocampus con tralateral to the one that presented atrophy in patients with
TLE21. In 2003, Bonilha et al. conirmed the eiciency of this technique in detecting hippocampal sclerosis (HS) in cases of mesial temporal lobe epilepsy (MTLE)20. As a result, they observed that most of the texture parameters calculated made it possible to distinguish diferences between the scle rotic hippocampal and contralateral tissues of patients and
the normal hippocampal tissues of control subjects.
Bernasconi22 and Antel et al.23 employed another texture analysis approach to evaluate cortical thickening in FCDs.
With the characterization of the texture of dysplastic lesions,
they drew up a computational algorithm with the objective
of automatically detecting, in the form of a study, dysplastic lesions. Algorithms of this nature, in the cases where valida
tion by histological analysis is possible, may contribute even
further to the diagnosis of epilepsies.
Taking into account the panorama of refractory epilep sies and the perspectives that arise with texture analysis, this study was aimed at verifying whether there are statistically
signiicant diferences of texture between brain structures of patients and of healthy subjects when we evaluate the limbic
association cortex, the prefrontal cortex and the hippocampi.
METHOD
he group of patients selected by the criteria of the Neu roimaging Laboratory of State University of Campinas (UNICAMP) was composed of subjects with distinct clini
cal symptoms. his selection took into consideration the fact that, despite the proile of the symptoms and of their clinical
evolution, the simple visual analysis of the MRI did not de tect alterations at the time of the study, in which the patients
were already considered refractory to the AEDs. he choice of the patients was based on recent models in which it is pro
posed that any region of the brain can originate the epileptic
crisis and recruit other areas through interaction of the lim
bic, cortical and subcortical structures10.
his retrospective study involved the selection of MRI scans of 20 patients with refractory epilepsy, aged between
Hippo-campus
Prefrontal cortex
Midline thalamic
nuclei
Piriform cortex
Entorhinal cortex Monosynaptic
Monosynaptic Polysynaptic
Polysynaptic
21 and 41 years (average=32±8 years, 66% men), besides ano ther 20 healthy subjects as a control group, aged between 26 and 48 years (average=29±4 years, 55% men) without a histo
ry of neurological diseases. he age of crisis onset for the stu died group ranged between 2 and 28 years (average=12.1±6.9
years). It is a unpaired study. Both the images of the patients
and of the control subjects were normal upon visual and vo lumetric analysis by the radiologist. All the images were ac
quired in the Achieva3T®
scanner (Philips, Netherlands), and the project was approved by the Committee of Ethics in Research of Medical School of Jundiai.
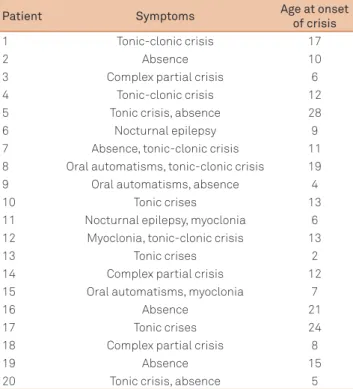
Table 1 presents the types of crises of each one of the pa tients studied and the age at onset of the crises.
he textures of the hippocampi and of cortical por
tions (prefrontal cortex and limbic association cortex) were evaluated in all the patients. Coronal T2weighted ima ges (TR=2000 ms, TE=30 ms, section thickness=3 mm) were used in the hippocampal analyses. T2 images provide a more pre
cise anatomical location of the temporal lobe structures, ena bling the detection of hippocampal atrophies in the TLEs. Sagittal T1 images (TR=7.1 ms, TE=3.2 ms, section thick
ness=1 mm) were used for the limbic association cortex and prefrontal cortex study, since they present better contrast for
the detection of cortical malformations.
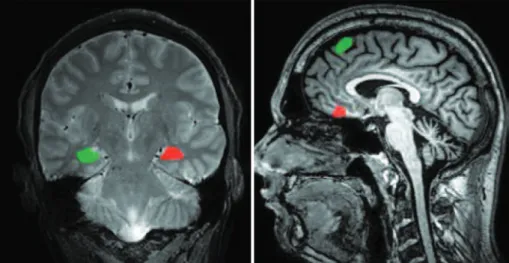
he texture analyses were executed in the MaZda softwa re (Lodz, Poland). his software was used to deine, for each subject, ROIs in the left and right hippocampi, in the pre frontal cortex and in the limbic association cortex, as pre sented in Figure 2.
A slice of the TI image was selected for each subject for evaluation of the cortical areas, with a slice of the T2 image
for evaluation of the hippocampi, as these are the ones that
provided the best visual representation of the areas studied. Small ROIs (minimum of 15 x 15 pixels) were used in the eva luation of the cortical tissues, in order to reduce the inluence of brain sulci and gyri in the texture analysis.
he statistical parameters of texture were calculated
from the grey level cooccurrence matrix17,18. his matrix ena
bles the obtainment of statistical information from the dis
tribution of pixel pairs along the image. he matrix was used as a basis to calculate the following statistical parameters: angular second moment (ASM), contrast (CO), correlation (COR), inverse diference moment (IDM), entropy (E), sum entropy (SE), diference entropy (DE), sum variance (SV), dif
ference variance (DV), sum average (SA) and sum of squares (SS). hese parameters were calculated for ive distances bet ween pixels (d=1, 2, 3, 4 and 5 pixels) and, taking, for each one of the parameters, the mean of the values obtained for four image sweep directions (0°, 45°, 90°, 135°). he statisti
cal parameters cited provide diferent information about the same evaluated ROI. For example, ASM assesses uniformity;
the entropy measurements assess disorganization among
the image pixels; contrast can detect the presence of edges and rough spots in the image. he statistical signiicance of the diferences found between the group of patients and the control group was veriied with the tStudent test. he sig
niicance level used was 5%.
RESULTS
Table 2 presents the means and standard deviations
of the values of the texture parameters calculated for the left hippocampus for each studied group in the MRI, toge
ther with the pvalues obtained by Student’s ttest. Only pa
rameters that presented signiicant diferences among the
groups are shown.
Table 3 presents the results obtained in the MRI analyses of the right hippocampus of patients and control subjects,
using a method similar to that adopted in the left hippocam
pus. As for Table 2, only parameters that presented signii
cant diferences among the groups are shown.
here is not signiicant diferences among the groups for the cortical areas studied (prefrontal cortex and limbic
association cortex).
DISCUSSION
According to Table 2, the parameters obtained by this study that resulted in statistically signiicant diferences bet
ween the group of patients and the control group for left
Table 1. Types of symptoms presented by the patients studied and age at onset of crisis.
Patient Symptoms Age at onset
of crisis
1 Tonic-clonic crisis 17
2 Absence 10
3 Complex partial crisis 6
4 Tonic-clonic crisis 12
5 Tonic crisis, absence 28
6 Nocturnal epilepsy 9
7 Absence, tonic-clonic crisis 11
8 Oral automatisms, tonic-clonic crisis 19
9 Oral automatisms, absence 4
10 Tonic crises 13
11 Nocturnal epilepsy, myoclonia 6
12 Myoclonia, tonic-clonic crisis 13
13 Tonic crises 2
14 Complex partial crisis 12
15 Oral automatisms, myoclonia 7
16 Absence 21
17 Tonic crises 24
18 Complex partial crisis 8
19 Absence 15
Table 2. Results obtained in the analysis of the left hippocampus in the MRI. The table shows the texture parameters that presented statistically significant differences between the group of patients and the control group.
Distance Parameter Patients Controls p
Mean±SD Mean±SD
d=5 COR 0.12±0.14 0.22±0.13 0.04
d=5 SA 47.14±13.68 38.56±11.73 0.04
COR: correlation;SA: sum average; SD: standard deviation.
Figure 2. Left: T2 coronal MRI image presenting the regions of interest for analysis of the hippocampi. Right: T1 sagittal MRI image presenting the ROIs for the analysis of cortical portions.
Table 3. Results obtained in the analysis of the right hippocampus in the MRI. The table shows the texture parameters that presented statistically significant differences between the group of patients and the control group.
Distance Parameter Patients Controls p
Mean±SD Mean±SD
d=3 COR 0.35±0.14 0.22±0.13 <0.01
d=3 DV 8.05±6.13 13.76±11.38 0.04
d=4 COR 0.21±0.15 0.08±0.13 <0.01
d=5 COR 0.14±0.14 0.03±0.12 0.01
COR: correlation; DV: difference variance; SD: standard deviation.
hippocampus were: COR and SA for distance of ive pixels. Table 3 shows that COR and DV presented statistically signii
cant diferences between the group of patients and the con
trol group for the right hippocampus. COR presented statisti
cally signiicant diferences for distances of three, four and ive pixels and DV presented signiicant diferences for distance of three pixels. Given that COR is related to the linear depen
dence between neighbor pixels, we observed that for the pa
tients, for both hippocampi, there is a tendency of diference
in the pixels linear dependence when compared to controls.
For the left hippocampus, the SA also present statistically signiicant diferences between the group of patients and the control group. his suggest that the mean of sum of gray le vels tends to distribute in diferent forms in patients and con
trols, pointed to texture diferences between these groups. In
the right hippocampus, the DV present statistically signii
cant diferences between the group of patients and the con trol group. Given that this parameter is related to dispersion
of distribution of diferences between the gray levels of the imaging, the indings suggest that there is a tendency to exis
tence of diferent distributions of gray levels in patients when compared to controls, pointed also to diferences of hippo
campi texture of these groups. To verify that the texture al
terations of the images are related with modiications of hip
pocampal tissue it would be necessary to compare the data
with the histopathological analyses of the areas in question.
he indings obtained seem to be in agreement with ob servations found in the literature, that the main neurons of
the hippocampus are vulnerable to a varied range of insults,
Since the necroscopic studies of Sommer24 and Bratz25, it has been observed that in patients with epilepsy, the hippocam
pus presents neuronal loss accompanied by ibrosis, gliosis, volume contraction and tissue thickening7. As mentioned,
the analyses of Yu et al. detected alterations of texture in the hippocampus contralateral to that presenting atrophy in pa
tients afected by TLE21. In the study by Bonilha et al.20, the authors observed alterations of texture in the sclerotic and
contralateral hippocampi of patients with epilepsy when
compared with the healthy subjects. Indeed, in this study, we observe bilateral alterations of texture in the hippocampi of
the patients when compared with the control group. It is in teresting to note that this occurred for the group as a whole,
regardless of the type of epileptic crisis presented. his might be related to structural modiications that may result from the epileptic crises – which would explain the inding, in
spite of the heterogeneity of the group of patients. We can
therefore assume the possibility that hippocampal alterations
result, in turn, in the refractoriness of epileptic crises. According to the hypothesis of Bernasconi22, FCDs ap pear in MRI images as a thickening of the cortex combined with a hypotensive signal in the T1 images when compared with the normal cortical tissues, as they can be made up of
dysmorphic neurons (giant, dysplastic) and balloon cells.
However, there is also the type of dysplasia in which there is loss of the laminar pattern of the cortex without the presence
of abnormal cells9, which may hinder the detection of these
lesions in the visual analysis of MRI images. However, for to
the cortical, limbic and prefrontal portions evaluated, we not found statistically signiicant diferences between the group
of patients and the control group.
Recent models, as shown in Figure 1, indicate the involve ment of cortical areas in the propagation of seizures in refrac tory epilepsy. However, this study found no changes in the
texture of the images to corroborate with these models. Concluding, in this work we found signiicant diferences between the group of epilepsy patients and that of control subjects in the parameters COR and SA, for the left hippo
campus, and COR and DV, for the right hippocampus. his study opens up a perspective on the use of this technique beyond surveys. With subsequent studies, cove ring a larger number of subjects (patients and control sub
jects) and the use of histological techniques, if the indings are corroborated, we will be able to have yet another useful
tool to assist in the evaluation of MRI images of patients with refractory epilepsy.
References
1. Berg AT, Berkovic SF, Brodie JM, et al. Revised terminology and concepts for organization of seizures and epilepsies: report of the ILAE Commission on Classification and Terminology, 2005-2009. Epilepsia 2010;51:676-685.
2. Palmini A, Calcagnotto M.E, Cendes F. Epilepsias refratárias: diagnóstico sindrômico, topográfico e etiológico. In: Guerreiro CAM, Guerreiro MM, Cendes F, Lopes-Cendes I (Eds). Epilepsia. São Paulo: Lemos, 2000:369-378.
3. Fernandes PT, Noronha ALA, Sander J, et al. National epilepsy movement in Brazil. Arq Neuropsiquiatr 2007;65:55-57.
4. Cendes F. Progressive hippocampal and extrahippocampal atrophy in drug resistant epilepsy. Curr Opinion Neurol 2005;18:173-177. 5. Kobayashi E, Cendes F, D’Agostino MD, et al. Hippocampal atrophy
and T2-weighted signal changes in familial mesial temporal lobe epilepsy. Neurology 2003;60:405-410.
6. Barkovitch J, Kuzniecky R, Dobyns W, Jackson G, Becker L, Evrard P. A classification scheme for malformations of cortical development. Neuropediatrics 1996;27:59-63.
7. Cendes F, Cook MJ, Watson C, et al. Frequency and characteristics of dual pathology in patients with lesional epilepsy. Neurology 1995;45:2058-2064.
8. Urbach H, Sassen R, Wellmer J. Epilepsy syndromes. In: Urbach H (Ed). MRI in epilepsy. Med Radiol 2013:15-19.
9. O’Muircheartaig J, Richardson MP. Epilepsy and the frontal lobes. Cortex 2010;48:144-155.
10. Thom M, Bertram M. Temporal lobe epilepsy. Handbook of Clinical Neurology 2010;107:284-299, Elsevier.
11. Beleza P, Pinho J. Frontal lobe epilepsy. J Clin Neurosc 2011;18:593-600. 12. Gavaret M, McGonigal A, Badier JM, et al. Physiology of frontal lobe
seizures: pre-ictal, ictal and inter-ictal relationships. Suppl Clin Neurophysiol 2004;57:400-407.
13. Lerski RA, Straughan K, Schad LR, et al. Image texture analysis: an approach to tissue characterization. MRI 1993;11:873-887.
14. Freeborough PA, Fox NC. MR texture analysis applied to the diagnosis and tracking of Alzheimer disease. IEEE Transact Med Imag 1998;17:475-479.
15. Mathias JM, Tofts PS, Losseff NA. Texture analysis of spinal cord pathology in multiple sclerosis. MRI 1999;42:929-935.
16. Schad LR, Blüml S, Zuna I. MR tissue characterization of intracranial tumors by means of texture analysis. MRI 1993;11:889-896.
17. Haralick RM, Shannmugam K. Textural features for images
classification. IEEE Transact Syst Man Cybernetics 1979;3:610-621.
18. Haralick RM. Statistical and structural approaches to texture. Proc IEEE 1979;67:786-804.
19. Castellano G, Bonilha L, Li LM, Cendes F. Texture analysis of medical images. Clin Radiol 2004;1061-1069.
20. Bonilha L, Kobayashi E, Castellano G, et al. Texture analysis of hippocampal sclerosis. Epilepsia 2003;12:1546-1550.
21. Yu O, Roch C, Namer IJ, et al. Existence of contralateral abnormalities revealed by texture analysis in unilateral intractable hippocampal epilepsy. MRI 2001;19:1305-1310.
22. Bernasconi A. Advanced MRI analysis methods for detection of focal cortical dysplasia. Epilept Disord 2003;5:81-84.
23. Antel SB, Collins DL, Bernasconi N, et al. Automated detection of focal cortical dysplasia lesions using computational models of their MRI characteristics and texture analysis. Neuroimage 2003;19:1748-1759.
24. Sommer W. Erkrankung des ammonshornes als aetiologisches
moment der epilepsie. Arch Psychiatr Nervenkr 1880;10:631-675.