Global and Cardiovascular Mortality and Risk Factors in Patients
Under Hemodialysis Treatment
Fátima Aparecida A. Almeida. Felipe Carrhá Machado. José Andrade Moura Junior. Armênio Costa Guimarães
Escola Bahiana de Medicina e Saúde Pública. BA - BrazilAbstract
Background: There is a high global and cardiovascular mortality rate among patients who need hemodialysis.
Objective: To assess global and cardiovascular mortality and to identify the risk factors in patients who undergo hemodialysis.
Methods: Observational. prospective study. A total of 334 patients were studied within three years. Primary outcomes: global and cardiovascular mortality. Survival was assessed through Kaplan-Meier method. and the risk variables were identified by means of bivariate and multivariate Cox regression.
Results: A total of 189 men (56.6%). aging 48.8 ± 14.2. majority non-white (295. 88.3%) and who did finished the elementary school (211. 63.2%). Global mortality rate was 21.6%. with a 50% rate of 146-month survival; cardiovascular mortality rate was 41.7% (30/72). with a 75% rate of 141-month survival. In the bivariate analysis. the relative risk (RR) for non-cardiovascular and cardiovascular death increased when age ≥60 years old was Hb≤9.0 g/dL and fast glycemia ≥126 mg/dL. Only non-cardiovascular death with low school grade and widow. Hb<11.0 g/dL. Ht<33.0%. fast glycemia≥100 mg/dL. Ca product x P<42 and creatinine ≥9.2 mg/dL decreased with blood pressure (BP) ≥140/90 mmHg (before hemodialysis session) and Ht>36%; Obit due only to cardiovascular factors increased with creatinine ≥9.4 mg/dL. In the multivariate analysis. non-cardiovascular and cardiovascular RR increased with age ≥60 years old and Hb<9 g/dL; cardiovascular death RR increased with glycemia ≥126 mg/dL. and non-cardiovascular death RR increased with urea removal rate in hemodialysis (Kt/V) <1.2.
Conclusion: Global and cardiovascular mortality of patients who need hemodialysis is high. Independent risk factors for non cardiovascular and cardiovascular causes of death were age ≥60 years old and Hb<9 g/dL. for cardiovascular cause of death only. was fasting blood glucose ≥126 mg/dL. and for non-cardiovascular cause of death. Kt/V<1.2. (Arq Bras Cardiol 2010;94(2): 187-192)
Key words: Mortality; letality/cardiovascular diseases; renal dialysis; kidney failure chronic.
Mailing address: Armênio Costa Guimarães •
Rua Guadalajara. 841/101 - Morro do Gato - Ondina - 40140-460 - Salvador, BA - Brazil
E-mail: [email protected]. [email protected] Manuscript received August 20, 2008; revised manuscript received December 14, 2008; accepted May 15, 2009.
Introduction
Chronic kidney disease is considered to be a public health problem, and its incidence has been consequently increasing due to diabetes and hypertension cases and to the ageing of population. In Brazil, according to the 2006 Census of
Sociedade Brasileira de Nefrologia, there were 70,872 patients under dialysis treatment, with 64,306 under hemodialysis treatment1. Cardiovascular mortality among hemodialysis
patients is usually elevated (40 to 50% of the population with chronic kidney failure), a rate that is 10 to 20 times higher than in general population2. Traditional risk factors, as well as those
related to renal insufficiency and to hemodialysis process, such as anemia, chronic inflammation, malnutrition, left ventricle
hypertrophy, increase in calcium-phosphorus product and low Kt/v, participate in this rate3.
In order to identify the frequency of such events and the associated risk factors, a cohort prospective study was carried out during three years in a hemodialysis center of Salvador, Bahia, Brazil.
Methods
according the Brazilian Society of Hemodyalisis criteria, by means of an aneroid sphygmomanometer (Tycos®). Routine
laboratorial assessment included hemoglobin, hematocrit, leucogram, serum iron, glycemia, albumin, creatinine, urea, potassium, Ca x P product and Kt/v (which assesses the efficacy of hemodialysis based on urea emotion rate, as regulating the volume to be cleaned in the session). Moreover, 284 patients took total cholesterol (TC) dosage, HDL cholesterol and triglycerides (TG). LDL cholesterol was calculated through Friedewald formula [LDL-C = (TC-HDL-C) – (TG/5)] for levels of TG lower than 400 mg/dL. A total of 158 patients went through posterior-anterior thoracic radiography, and the cardiothoracic index (CTI) was considered altered when superior to 50%. In 179 patients, electrocardiogram was carried out in the 12 derivations, and left ventricle hypertrophy (LVH) was diagnosed based on Sokolow-Lyon criteria and on Cornell University4.
Continuum variables were expressed in mean ± standard deviation (SD) or median and interquartile interval, according to normality or asymmetry of its distribution, respectively, and the categorical variables were expressed in percentiles. Global, cardiovascular and non-cardiovascular mortality were assessed. Survival curves were built through Kaplan-Meier method. For the evaluation of mortality-related risk factors, non-cardiovascular and cardiovascular mortalities were compared. Bivariate analysis was carried out through Cox regression model, with 95% confidence interval. For the adjustment of Cox multivariate models, the backward algorithm was used, as variables of bivariate analysis which presented p<0.15 were included. Epi-Info version 6 was the utilized database, and Cox regression analysis was made through STATA software, version 10. The study was approved by the Ethics Committee of Fundação Bahiana para o Desenvolvimento das Ciências.
Results
A total of 334 patients were assessed, with mean age of 48.8 ± 14.2 years old, 189 (56.6%) males, 295 (88.8%) mulattos and black individuals, and 211 (63.2%) with a low education level, including illiterates (33), and those with incomplete first grade (178). Table 1 shows the patients’ demographic, clinical and laboratorial data according to their conditions of alive or dead, after a three-year observation. Death cases were significantly older (56.9±14.6 [23-87]
versus 46.6±14.9 [18-88] years old, p<0.001), and presented with a higher prevalence of antecedents of acute myocardial infarction (7 [19.7%] versus 3 [3.4%], p=0,027).88] years old, p<0.001). The alive and dead people did not differ with regard to skin color, marital status, educational level and other cardiovascular risk antecedents. The same occurred in relation to blood pressure and weight. The laboratorial assessment showed, in obits, a higher anemia grade (9.8 ± 2.5 g/dL versus 10.7 ± 2.1 g/dL, p=0.001 e Ht 30.6 ± 6.6%
versus 32.9 ± 7.0%, p=0.001), hyperglycemia (121.5 [88.0] mg/dL versus 94.0 [40.0] mg/dL, p<0,001), lower plasmatic creatinine concentration (7.6±4.1 mg/dL versus 9.5±3.8 mg/dL, p<0.001) and tendency to higher cardiomegaly in the 158 patients that went through thoracic X-ray (CTI), 57.2 [5.9] versus 53.1 [9.8], p<0.055).
In Table 1, it is possible to observe that the majority of the 72 obits (30, 41.7%) occurred due to cardiovascular cause, which is divided into cardiac, 26/30 (86.7%), which is the main one, and cerebral vascular causes, 4/30 (13.3%), followed by infectious cause, 16/72 (22.2%). Approximately a quarter of these patients, 20 (27.8%), died by causes qualified as CID-10, R 68.8 (other causes-related symptoms).
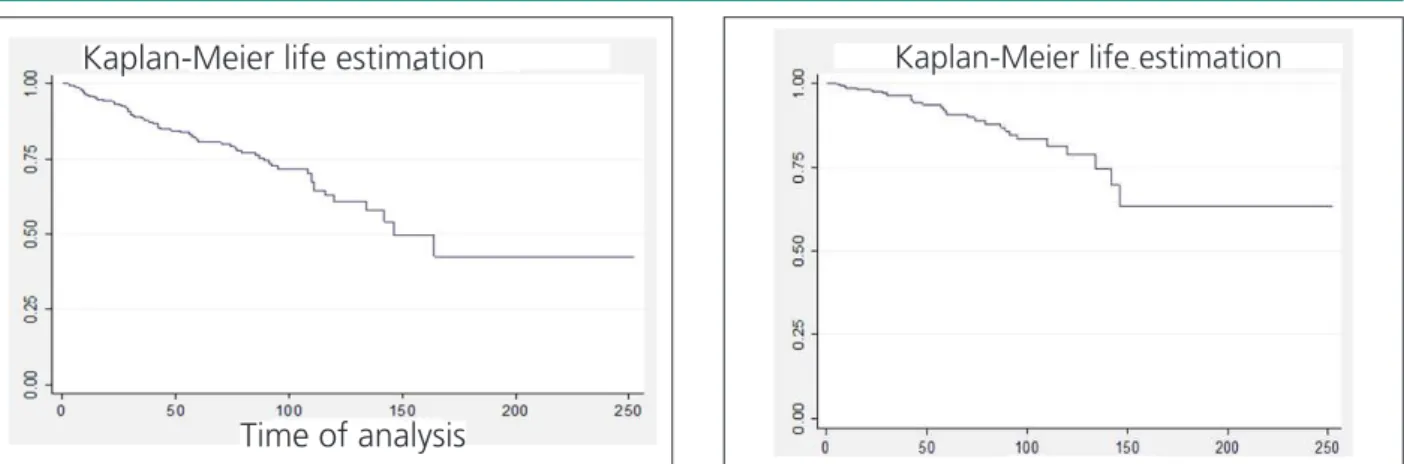
Survival curve regarding obit by all causes shows that 50% of the patients survive 146 months (12.2 years) after the beginning of hemodialysis treatment (Figure 1), while 75% of the patients survived for approximately 141 months with regard to cardiovascular obits (11.7 years) (Figure 2).
The comparison through bivariate analysis of risk factor associated with non-cardiovascular and cardiovascular mortality, respectively, showed that age ≥60 years old, Hb≤9.0 g/dL and fast glycemia ≥126 mg/dL significantly≤9.0 g/dL and fast glycemia ≥126 mg/dL significantly9.0 g/dL and fast glycemia ≥126 mg/dL significantly≥126 mg/dL significantly126 mg/dL significantly increased both kind of obits (Table 2). Non-cardiovascular obit risk also increased significantly with incomplete first grade school, widowers, Hb<11.0 g/dL, Ht<33%, fast glycemia ≥100 mg/dL, Ca x � product �42 and Kt/� ≤1.2,≥100 mg/dL, Ca x � product �42 and Kt/� ≤1.2,100 mg/dL, Ca x � product �42 and Kt/� ≤1.2,≤1.2,1.2, and decreases with B�≥140/90 mmHg before hemodialysis≥140/90 mmHg before hemodialysis140/90 mmHg before hemodialysis session, and Ht>36%. Creatinine ≥9.2 mg/dL, on the other≥9.2 mg/dL, on the other9.2 mg/dL, on the other hand, significantly increased non-cardiovascular obit risk, while ≥9.4 mg/dL increased cardiovascular obit risk, respectively.9.4 mg/dL increased cardiovascular obit risk, respectively. Therefore, in multivariate model, in which these risk variables are comprised (Table 3), only age ≥60 years and Hb≤9.0 g/dL≥60 years and Hb≤9.0 g/dL60 years and Hb≤9.0 g/dL≤9.0 g/dL9.0 g/dL remained as independent risk variables for non-cardiovascular and cardiovascular obit; glycemia ≥126 mg/dL remained as≥126 mg/dL remained as126 mg/dL remained as independent risk for cardiovascular obit and Kt/�≤1,2 as≤1,2 as1,2 as independent risk for non-cardiovascular obit.
Discussion
The numerous obit occurrences by all causes, specifically by cardiovascular cause, is in compliance with literature data, indicating that chronic kidney failure, even at the period of advanced chronic hemodialysis treatment, is a high risk condition for global and cardiovascular obit3. In private, the
Table 1 - Demographic and clinical data concerning patients under hemodialysis treatment. according to alive or dead conditions. after three-year follow-up
Total Alive Dead
N(%) 334 (100) 262 (78.4) 72(21.6) p
Age (years) (Mean ± SD) 48.8±14.2 46.6 ± 14.9 56.9 (14.6) <0.001
Male 189(56.6) 14 8 (56.5) 41(56.9) 0.956
Non-white patients 295(88.3) 233 (88.9) 62 (86.1) 0.788
Schooling* 211(63.2) 156 (50.8) 55 (76.4) 0.013
Married patients 194(58.1) 154 (58.7) 40 (55.6) 0.414
Cardiovascular risk factors
Hypertention 236(70.7) 189 (72.1) 47 (65.3) 0.462
Smoking 100(29.9) 73 (27.9) 27(37.5) 0.462
Dyslipidemia 50(14.9) 36 (13.7) 14 (19.4) 0.761
Diabetes mellitus 69(20.7) 42 (16.0) 27 (37.5) 0.115
Medical antecedents
Stroke 55(16.5) 44 (16.8) 12 (16.7) 0.98
Acute myocardial infarction 16(4.8) 9 (3.4) 7 (19.7) 0.027
Physical data (Mean ± SD)
Systolic Blood Pressure (mmHg) 142± 22.0 141.1± 9.9 144.0 ±26.0 0.258
Diastolic Blood Pressure (mmHg) 88.4± 13.0 88.7 ± 13.2 87.2 ± 13.3 0.189
Dry weight (kg) 60.9± 12.7 60.9 ± 12.6 60.7 ± 13.3 0.992
Laboratory (mean ± SD)
Hemoglobin (g/dL) 10.6 ± 2.2 10.7 ± 2.1 9.8 ± 2.5 0.001
Hematócrit (%) 32.4±7.0 32.9 ± 7.0 30.6 ± 6.6 0.002
Albumin (g/dL) 3.4±6.9 3.4 ± 0.7 3.6 ± 0.8 0.13
Potassum (mg/dL) 5.4± 1.1 5.4 ± 1.2 5.6 ± 1.3 0.438
Magnesium (mg/dL) 3.0±0.6 3.0 ± 0.6 3.0 ± 0.6 0.975
Ca X P 54.3± 16.8 54.8± 15.9 52.4 ± 18.8 0.276
Kt/v 1.4± 0.4 1.4 ± 0.4 1.4 ±0.3 0.43
Cholesterol (mg/dL) (Median±IQI)†
(Mediana[IIQ])‡ 149 (63) 150.0 (65.0) 142.0 (62.5) 0.419
LDL-C (mg/dL) 85.6 (65.1) 88.8 (48.3) 86.1 (52.5) 0.494
HDL-C (mg/dL) 35 (17.0) 38.4 (17.5) 40.7 (31.5) 0.48
NHDL-C(mg/dL) 113.0 (58.7) 113.0 (58.5) 113.0 (59.0) 0.396
VLDL–C (mg/dL) 27.1 (22.0) 27.4 (21.7) 24.9 (31.9) 0.544
TG (mg/dL) 137 (116.0) 137.5 (108.0) 126.5 (113) 0.518
TG/HDL-C 3.9 (3.5) 3.6 (3.9) 3.1 (3.2) 0.618
Glucose 96n(43) 94 (40.0) 121.5(88.0) < 0.001
Creatinine (mg/dL) (Mean ± SD) 8.6± 3.9 9.5 ± 3.8 7.6 ± 4.1 <0.001
CTI (%) (N=158) N(%)‡ 53.4 ± 7.8 53.1(9.8) 57.2 (5.9) <0.055
LVH (n=179) N(%)‡ 61 (34.1) N=144 50 (34.7) N =35 11(31.4) 0.864
Death Causes N. of deaths/Total deaths
All 72/334 (21.6)
Cardiovascular 30/72 (41.7)
Infeccious 16/72 (22.2)
Hemodialysis-related 06/72 (8.3)
Other Causes # 20/72 (27.8)
Table 2 - Bivariate analysis: variables of patients under hemodialysis treatment who showed signiicant association with mortality by non-cardiovascular or non-cardiovascular causes
Non-cardiovascular mortality (42/262) Cardiovascular mortality (30/292)
RR (CI 95% )* p-value RR (CI 95% )* p-value
Age ≥ 60 years old 6.8 (2.30 -19.82) <0.001 4.64 (1.50-14.27) 0.007
Hb<9,0 g/d/L 3.18 (1.70-6.00) <0.001 3.34 (1.58-7.04) 0.002
Glucose(mg/dL)† 3.87 (2.00- 7.80) 0.001 3.40 (1.62-7.08) 0.001
Creatinine > 9,4 mg/dL 2.24 (1.06-4.72) 0.034
Low scholarity § 2.41(1.11-5.21) 0.026 1.47 (0.67-3.41)
Widower 4.91(1.75-13.80) 0.002 2.45 (0.51-11.74)
BP >140/90 mmHg# 0.46 (0.25-0.86) 0.015 0.63 (0.29-1.34)
Hb<11,0 g/dL 3.67 (1.29-10.42) 0.014 1.12 (0.68-1.80)
Ht>36% 0.32 (0.13-0.76) 0.011 0.64 (0.28-1.43)
Ht<33% 2.64 (1.15-6.04) 0.021 2.56 (0.86-7.58)
Glucose >100 mg/dL † 2.16 (1.15-4.09) <0.016 1.48 (0.72-3.05)
Creatinine > 9,2 mg/dL 3.62 (1.81-7.22) <0.001
Ca x P <42 2.17 (1.09-6.65) 0.03 1.26 (0.43-3.70)
Cox regretion: RR, relative risk; §CI 95%, 95% conidence interval; †12h fasting blood glucose; §Low schooling: less than 8 years; # Measured before hemodialysis
session.
Figure 2 -Kaplan-Meier Survival curve concerning cardiovascular mortality as
assessed in months, from the beginning of hemodialysis treatment, in a sample of 334 patients with chronic kidney failure.
Figure 1 -Survival curve (Kaplan-Meier) concerning the global mortality,
assessed in months, from the beginning of the hemodialysis, in a sample of 334 patients with chronic kidney failure.
Kaplan-Meier life estimation
Time of analysis
Kaplan-Meier life estimation
serum albumin levels, hyperphosphatemia, hyperkalemia and eccentric left ventricle hypertrophy are nor presented as a differential risk in this sample, which evidently does not reduce the related preventive and therapeutic care. It is worth to emphasize the small reduction of serum albumin concentration that did not present a significant difference between life and death cases, though it was higher in the latter. These median albumin levels equal or superior to 3.4 g/dL, in these hemodialysis patients, are suggestive of a jeopardized nutritional status, which may contribute to a low mortality rate.
Among the three mentioned independent risk factors, the most important one, due to its pathogenic actuation amplitude and control possibility, is anemia. In patients with end stage
renal disease, it represents the most frequent and neglected risk factor for non-cardiovascular and cardiovascular obit, which may not be adequately valorized because it is common and is not placed among traditional ones3. In the present
paper, for each diminution Hb gram inferior to 9.0 g/dL, the relative risk for non-cardiovascular obit would increase in approximately 2.37 times, and for cardiovascular obit, in 3.4 times. Still, this condition remains inadequately treated during predialysis phase of renal disease5,6, with aggravation in dialysis
phase6, despite the current availability of erythropoietin by
Table 3 - Multivariate analysis*: variables of patients under hemodialysis treatment who showed signiicant inluence on non-cardiovascular and cardiovascular mortality
Non-cardiovascular mortality Cardiovascular mortality
RR† (CI 95%) p-value RR (CI 95%) p-value
Agr ≥ 60 years old 4.40 (1.41-13.73) 0.01 4.22 (1.28-13.91) 0.018
Hemoglobin <9 (g/dL) 3.38 (1.74-6.54) 0.001 4.38 (1.87-10.21) 0.001
Glucose ≥126 mg/dL ‡ 2.64 (1.22-5.74) 0.014
Kt/V ≤ 1,2 2.17 (1.12-4.21) 0.02
* Cox regression (model composed by variables whose association with non-cardiovascular and cardiovascular; mortality in the multivariate analysis had p<0.15); † RR: relative risk; 95% CI: 95% conidence interval; ‡ 12h fasting blood glucose.
prevalence for hypertension is related (70% of the patients in this study), chronic inflammation, insulin resistance (altered fast glycemia) and type 2 diabetes8, all factors that contribute
to the atherosclerosis process9. Though low educational level
is a matter of social amplitude and complex in its short and medium-term solution, it must be taken into account, for it affects significantly the portion of the society that comprises the majority of the patients in hemodialysis treatment. A continuum educational support offered by the interdisciplinary team, which is necessary for supporting this type of program, may constitute a feasible solution. Age, as a progressive risk factor and in its biological characteristics, indicates the necessity of a more rigorous control of the multiple risk factors present in the elderly and already mentioned in the literature3.
With regard to the other risk co-variables identified by the bivariate analysis, the matters of blood pressure with reduced relative risk in 45% when equal to or higher than 140/90 mmHg before hemodialysis session, as well as the increase of relative risk with Ca x P product <42 and lipidic profile neutrality deserve a specific comment. The presence of a U correlation between systolic blood pressure (SBP) and mortality of patients under hemodialysis treatment was reported by Zager et al10, which is in compliance with current
data and shows that the optimum level for SBP is not yet determined, and should be motif for longitudinal studies. The increased risk of global mortality by the reduced Ca x P product is not reported in the literature, even in patients that were given sevelamer chloride11-14, a current medication
that is specific for hyperphophatemia control. Face to that, the findings should be registered for the purpose of future assessment. One of the limitations of this study was the fact that the complementary examinatios (lipidic profile, magnesium dosage, echocardiogram and thoracic X-ray) were initiated a period after the beginning of the research, which kept some patients from participating in the evaluation due to obit or refusal to go through the examinations. Another limitation, naturally, comes from the observational characteristics of the research, as data were obtained by means of the routine
protocol of the institution, and not of the applicability of a research protocol. At last, a financial limitation did not allow cardiac alterations to be also assessed by echocardiography, and the high sensibility C-reactive protein to be determined in order to assess the grade of the inflammatory process that happens in these patients.
Conclusions
The mortality of patients under hemodialysis treatment as substitutive renal therapy is still elevated, and cardiovascular disease strongly contributes for such rates. Independent non-cardiovascular and cardiovascular mortality risks were: age ≥60 years old and Hb ≤9.0 g/dL; fast glycemia ≥126≥60 years old and Hb ≤9.0 g/dL; fast glycemia ≥12660 years old and Hb ≤9.0 g/dL; fast glycemia ≥126≤9.0 g/dL; fast glycemia ≥1269.0 g/dL; fast glycemia ≥126≥126126 mg/dL was an independent cardiovascular mortality risk and urea removal rate during hemodialysis (Kt/V) lower than 1.2 of non-cardiovascular mortality. It is important to emphasize the possibility of monitoring, correction and prevention of such independent, modifiable mortality factors.
Acknowledgments
The authors would like to thank Carlos Teles for the statistical analysis and Gabrielita C. Machado for the help in the bibliographical review.
Potential Conflict of Interest
No potential conflict of interest relevant to this article was reported.
Sources of Funding
This study was funded by FAPESB.
Study Association
References
1. Sociedade Brasileira de Nefrologia. Censos. [Acesso em 2007 jul 7]. Disponível em: http://www.sbn.org.br/censos.htm.
2. Silva Jr ACC. Abensur H. Lotaif LD. Amodeo C. Piegas LP. Novos fatores de risco cardiovascular. Rev Soc Cardiol Estado de São Paulo. 2007; 17 (1): 50-9.
3. Canziani ME. Doenças cardiovasculares na doença renal crônica. J Bras Nefrol. 2005; 26 (supl. 1): 20-1.
4. Gasperin CA. Germiniani H. Facin AR. Souza AM. Cunha CLP. Análise dos critérios eletrocardiográficos para determinação da sobrecarga ventricular esquerda. Arq Bra Cardiol. 2002; 78 (1): 59-71.
5. Isek K. Kohagura K. Anemia as a risk factor for chronic kidney disease. Kidney Int. 2007; 72: 54-9.
6. Zalunardo N. Levin A. Anemia and the heart in chronic kidney disease. Semin Nephrol. 2006; 26: 290-5.
7. Li S. Collins AJ. Association of hematocrit value with cardiovascular morbidity and mortality in incident hemodialysis patients. Kidney Int. 2004; 65 (2): 626-33.
8. Dogra G. Irish A. Chan D. Watts G. Insulin resistance. inflammation. and blood pressure determine vascular dysfunction in CKD. Am J Kidney Dis. 2006; 48: 926-34.
9. Grundy SM. Cleeman JI. Daniels SR. Donato KA. Eckel RH. Franklin BA. et al. Diagnosis and management of the metabolic syndrome. An American Heart Association/National Heart. Lung. and Blood Institute Scientific Statement. Circulation. 2005; 112: 2735-52.
10. Zager PG. Nikolic J. Brown RH. Campbell MA. Hunt WC. Peterson D. et al. “U” curve association of blood pressure and mortality in hemodialysis patients. Kidney Int. 1998; 54: 561-9.
11. Chertow GM. Burke SM. Dillon MA. Slatolposky E. for the RenaGel Study Group. Long-term effects of sevelamer hydrochloride on calcium x phosphate product and lipid profile of hemodialysis patients. Nephrol Dial Transplant. 1999; 14: 2907-14.
12. Carvalho AB. Cuppari L. Controle da hiperfosfatemia na DRC. J Bras Nefrol. 2008; 30 (supl 2): 4-8.
13. Delmez. J. Block G. Robertson J. Chasan-Taber S. Blair A. Dillon M. et al. A randomized. double-blind crossover design study of sevelamer hydrochloride and sevelamer carbonate in patients on hemodialysis. Clin Nephrol. 2007; 68 (6): 386-91.