Quality of sleep among
university students
Efects of nighttime computer and television use
Gema Mesquita1, Rubens Reimão2
ABSTRACT
This descriptive, cross-sectional study was based on subjective questionnaires that assessed nighttime habits of television viewing and Internet use during weekdays and perceived sleep quality among university students. Sleep perception was measured using the Pittsburgh Sleep Quality Index (PSQI). The study group comprised 710 university students aged 17-25 years. Analysis of sleep perception in relation to internet use revealed that 58.06% of subjects who accessed the internet between 19:00 and 21:00 slept poorly; 71.43% between 19:00 and 22:00; 73.33% between 19:00 and 24:00; and 52.38% between 19:00 and 03:00 (p=0.0251). Concerning the relationship between television exposure and perceived sleep, the groups did not differ from each other (p=0.9303). This study showed that internet use between 19:00 and 24:00 increases the risk of poor sleep among young adults, in comparison with television viewing times.
Key words: quality of sleep, internet, television, sleep disturbances.
Qualidade do sono entre universitários: os efeitos da utilização do computador e televisão no período da noite
RESUMO
Este estudo transversal descritivo com base em questionários subjetivos avalia o hábito de assistir TV e acessar a internet durante as noites nos dias de semana e a percepção da qualidade do sono entre universitários. Para avaliar a percepção do sono foi aplicado o Índice de Qualidade do Sono de Pittsburgh. O grupo estudado incluiu 710 universitários entre 17-25 anos. Para as análises da percepção do sono relacionado ao hábito de acessar o computador observou-se que acessam a internet e dormem mal: 58,06% entre as 19 e as 21h; 71,43% entre as 19 e as 22h; 73,33% entre as 19 e as 24h; 52,38% entre as 19 e as 3h (p=0,0251). Em relação aos horários de assistir TV e a percepção do sono os grupos não se diferenciaram entre si (p=0,9303). O estudo demonstra que acessar a internet durante os horários das 19 às 24h aumenta as chances dos jovens dormirem mal quando comparado aos horários de assistir TV.
Palavras-chave: qualidade do sono, internet, televisão, distúrbios do sono.
Correspondence
Gema Mesquita Rua Euclides da Cunha 202 37130-000 Alfenas MG, Brazil E-mail:[email protected]
Received 18 October 2009 Received in final form 9 March 2010 Accepted 16 March 2010
State University of Campinas (UNICAMP), Campinas SP, Brazil and the University of São Paulo Medical School (FMUSP), São Paulo SP, Brazil: 1MSc. Psychologist, Department of Child and Adolescent Health, School of Medical Sciences, UNICAMP.
University of José do Rosario Vellano (UNIFENAS), Alfenas MG, Brazil; 2MD, PhD. Pediatric Neurologist, Division of Clinical
Neurology, Hospital das Clinicas, FMUSP.
The effects of excessive use of elec-tronic media, such as computers and tele-vision, have been identiied as a health is-sue1-3. he implications of heavy nocturnal
use of such media, particularly computers, remain largely unknown4.
Evidence shows that many young indi-viduals surf the internet or watch TV
pro-grams in a habitual manner, often leading to impaired sleep quality2,5.
shift-ing paradigms that have had an impact on daily routines and habits7,8.
Although television and computers are similar in terms of intensity of light displayed, they difer in how they are used. When in front of the television, viewers usually sit or lie down in a comfortable position around three meters from the screen, changing channels with a remote control. However, in front of a computer moni-tor, internet users sit between ifty and seventy centime-ters away from the screen and interact more actively with the device, engaging both mental and physical faculties to operate the equipment.
he use of these devices at inappropriate times, cou-pled with the brightness of the light that they project onto the retina, are factors that are thought to trigger changes in sleep patterns1,2,4. In the case of computer displays, the
light that they emitted is in close proximity to the retina. According to Guyton, light-stimulated retina cells trans-mit electrical signals to the hypothalamus10. In addition
to controlling the glands of the body, the hypothalamus contains a small nucleus that houses the biological clock, which is essential for regulating sleep/wake cycles and rhythms10. he strength, variation and timing of light
pro-jected onto the retina by these devices disrupt the nor-mal release of melatonin in the body (the hormone that controls sleep), resulting in changes in quality of sleep11-13.
Given that sleep plays an essential role in restoring ener-gies expended during the day, and in memorization, con-centration and learning processes14,15,the ramiications
of sleep quality among young graduates undergoing aca-demic and professional training are manifold.
Surveys have shown16,17 that internet users spend
ex-cessive time at the computer, and have found that the pop-ulation as a whole is sleeping less hours due to exposure to television programs and computers on the internet1-3.
Against this background, the aim of the present study was to identify possible relationships between time spent using the computer or television, and sleep quality among young university students.
METHOD
A descriptive, cross-sectional study was conducted, in which data on sleep quality was collected from a sample of 1,978 university students at a pubic university in the south of the state of Minas Gerais, Brazil. he random sample comprised 710 subjects, containing both women (486) and men (224). heir mean age was 20.7 years (standard deviation of 1.8 years), with a minimum age of 17.01 years, median age of 21.0 years and maximum age of 25.0 years.
Instruments
he participants were asked to answer an objective self-assessment questionnaire on the use of television and
the computer on weekdays during the following time pe-riods: [A] 19:00 to 21:00; [B] 19:00 to 22:00; [C] 19:00 to 24:00; [D] 19:00 to 3:00.
Sleep perception was measured using the Pittsburgh Sleep Quality Index (PSQI). his scale is used to quanti-fy the quality of sleep over the past month. It was devised to provide a standardized measurement of sleep quali-ty18. he scale is straightforward and consists of 19
self-assessed items grouped into seven components weight-ed 0 to 3. The overall score ranges from 0 to 21, with lower scores indicating better quality of sleep. Individ-uals scoring less than ive are considered good sleepers (GoodS), while those scoring more than ive are rated as poor sleepers (PoorS). An overall score >5 on the PSQI indicates serious problems relating to at least two com-ponents, or moderate diiculties relating to more than three components. he PSQI instrument has been vali-dated as reliable for use in Brazil19, and has been used in
a number of studies in other countries20,21.
Inclusion criteria
Students drawn from the Federal University of Alfenas who were present in the classroom at the time of ques-tionnaire application, and who agreed to take part on a voluntary basis by signing the informed consent form, were included in the study.
Procedures
Data were collected in groups from the classrooms between August and November 2007. Contact with stu-dents was brief. he participating stustu-dents were informed of the purpose of the study and the methods to be used and signed an informed consent statement.
he project “Life Habits and Sleep Complaints among Young University Students”, on which the present study was based, was approved and homologated at the General Meeting of the Research Ethics Committee of the School of Medical Sciences of UNICAMP on October 24, 2006, under CAAE ile no. 0441.0.146.000-06.
Statistical methodology
he data obtained in the study were tabulated, orga-nized and stored in an electronic Excel spreadsheet. he compiled data were submitted to statistical analysis by the Research Board of the School of Medical Sciences of UNICAMP, using version 9.1.3 of the SAS (Statistical Analysis System) for Windows Service Pack 3 (SAS Insti-tute Inc, 2002-2003, Cary, NC, USA).
he descriptive analysis was performed based on po-sition and dispersion measurements for continuous vari-ables, and frequency tables for categorical variables.
and compare proportions; Mann-Whitney test to compare continuous or ordinal measurements between pairs of groups, and the Kruskal-Wallistest for comparisons among three or more groups; and multiple logistic regression analysis to identify factors impacting on sleep quality22. he
signiicance level used for the statistical tests was set at 5%.
RESULTS
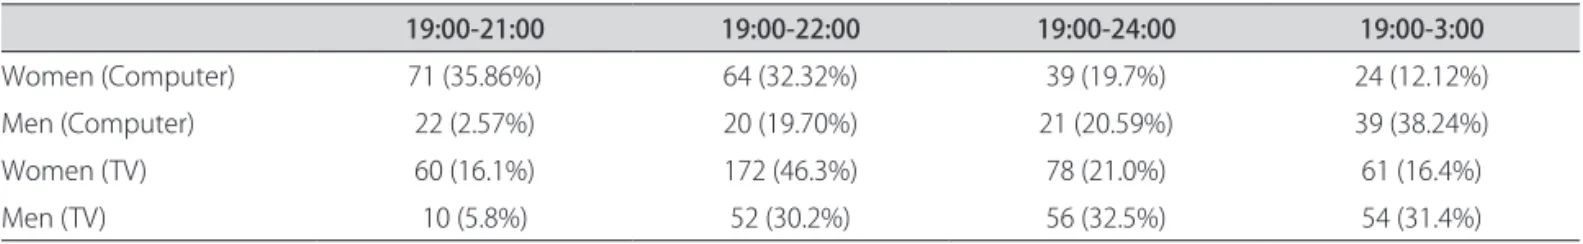
he overall PSQI scores for the 710 participants were: mean 6.5; standard deviation 2.6; minimum 0.0; median 6.0; and maximum 6.0. A total of 39.72% of respondents were found to be good sleepers and 60.38% were poor sleepers. Computer use was signiicantly higher among women between 19:00 and 21:00, and among men be-tween 19:00 and 3:00 (p<0.0001; c2). A signiicantly
high-er proportion of women reported watching TV between 19:00 and 21:00 than of men (p<0.0001; c2) (Table 1).
No difference was found in any of the items of the Pittsburgh Sleep Quality Index between the groups, in terms of gender or perceived sleep. On the scale, 60.91% of the women reported poor sleep versus 58.93% of the men. he chi-square test was used: c2 p=0.6169. A mean
overall score of 6.5 was found for the women, and 6.3 for the men (p=0.2981; Mann-Whitney).
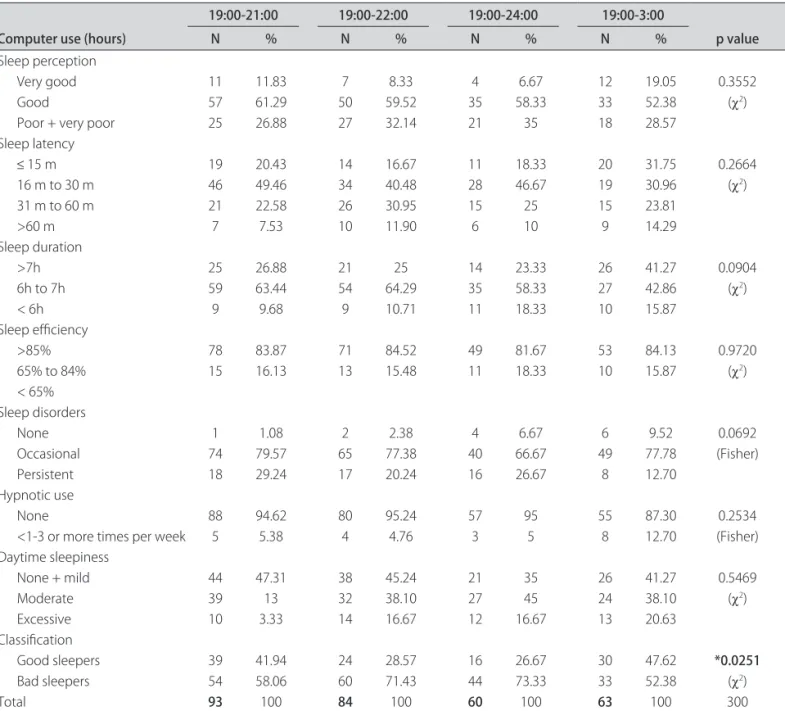
The mean perceived sleep scores for the different time periods of computer use were 6.3 (19:00 to 21:00); 6.6 (19:00 to 22:00); 7.0 (19:00 to 24:00) and 6.4 (19:00 to 3:00) (Table 2). Application of the Kruskal-Wallis test (p=0.3257) showed that there were no differences be-tween the groups relating to time period.
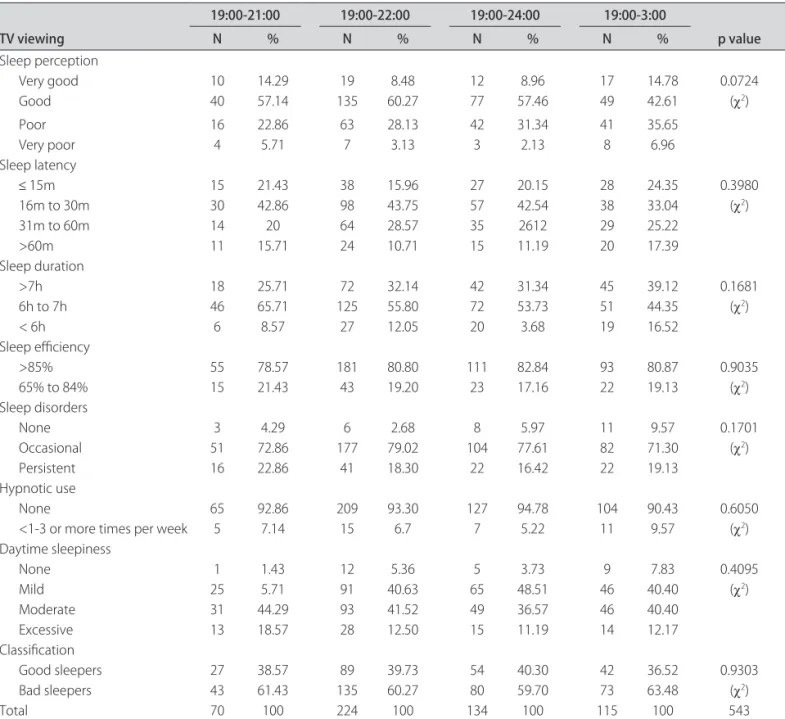
he mean perceived sleep scores in relation to televi-sion viewing periods were 6.7 (19:00 to 21:00); 6.6 (19:00 to 22:00); 6.3 (19:00 to 24:00); and 6.7 (19:00 to 03:00) (Ta-ble 3). Application of the Kruskal-Wallis test (p=0.3257) showed that there were no diferences between the groups (Table 4).
DISCUSSION
he indings from this study revealed that there were signiicantly higher numbers of poor sleepers among in-dividuals using computers between 19:00 and 22:00 or between 19:00 and 24:00 (Table 2). In contrast, no sig-niicant diferences in the numbers of poor sleepers were seen among television users between the diferent time
periods (Table 3). his result is of particular relevance giv-en that computer use at these times is prevalgiv-ent not only in the student population but also among children, ado-lescents, adults and the elderly1-4,16,17.
To our knowledge, only seven studies investigating the impact of computer use on sleep patterns have been published in the worldwide literature1-4,16,17,23. All of these
studies except one23 found that computer use disturbed
sleep patterns.
In the present study, significant numbers of com-plaints of reduced sleeping times and increased sleep dis-turbances (Sleep Duration and Sleep Disorders compo-nents of Tables 2 and 3) were associated with media use, thus corroborating the results of previous studies1-3,23.
Our analysis showed that computer use (Table 2) was connected with a signiicantly higher risk of perceiving poor sleep quality among these university students, in contrast to the habit of watching television (Table 3). Our results are similar to those of Dworak17 and Van Den3, who
reported a signiicantly higher risk of impaired sleep pat-terns following internet use before going to sleep than in relation to television use, among children and adolescents. Furthermore, a study by Suganuma1 on the use of
elec-tronic media (television and computers) in relation to per-ceived sleep found a signiicant diference between light users (29.0%) and heavy users (53.5%) (p=0.02) regarding perceptions of insuicient sleep. According to this au-thor1, “attention should be given to media use before sleep
as a cause of perceived insuicient sleep”.
An earlier study by the present authors2 found that
adolescents who used the computer during the night perceived poorer sleep quality (74.04%) to a signiicant-ly greater extent than non-users did. Nevertheless, we did not expect internet use between 19:00 and 24:00 to be the greatest risk factor for poor sleep among univer-sity students.
Studies that might explain our indings have explored the efect of light exposure on circadian rhythms and have demonstrated that exposure to light before 24:00 leads to delays in the circadian phase, whereas exposure after 24:00 induces phase advances, thereby changing sleep cy-cles. Studies involving strong light showed a more signif-icant impact on the circadian clock than did those with weak light. hese studies concluded that the sensitivity
Table 1 Analysis and comparison of computer and television use (hours), according to gender.
19:00-21:00 19:00-22:00 19:00-24:00 19:00-3:00
Women (Computer) 71 (35.86%) 64 (32.32%) 39 (19.7%) 24 (12.12%)
Men (Computer) 22 (2.57%) 20 (19.70%) 21 (20.59%) 39 (38.24%)
Women (TV) 60 (16.1%) 172 (46.3%) 78 (21.0%) 61 (16.4%)
of circadian rhythms to the efects of light exposure on the retina varies according to the circadian phase within which light exposure takes place11-13,24-27.
Based on our indings, we posit that proximity to the computer screen between 19:00 and 24:00 induced a sig-niicant light efect that changed the participants’ sleep cycles and contributed towards poorer quality sleep. An-other factor may be related to the interactivity patterns of computer use, in which computer users tend not to in-terrupt their use. In contrast, TV viewing is less contigu-ous or intense, such that users more readily discontinue the activity temporarily. Exploring these hypotheses was beyond the scope of the present study and could be the topic of future investigations.
Takahashi and Arito29 showed that performing mental
tasks before sleep can curtail the duration of slow wave sleep within the irst cycle.
However, a study by Higuchi et al.4 on the display light
of electronic games between 23:00 and 01:45 among a group of young adults, found no efect on the physiologi-cal variables of sleep. According to these authors, the com-bination of the compelling nature of the game and the dis-play brightness may change the perception of sleep quality.
Our results indicate that the fact that these young adults watched television (Table 3) was not linked to any signiicant risk of a perception of poor quality sleep, al-though an earlier study had shown that watching TV for three or more hours consecutively contributed towards a signiicantly higher risk of frequent sleep problems5.
Correlation analysis (Table 4) between non-use of the computer at any time and use during the nighttime pe-riods studied showed that computer use between 19:00 and 22:00 or between 19:00 and 24:00 was associated with higher frequency of poor sleepers.
Table 2. Comparative analysis of computer use (hours) and perceived sleep, using the Pittsburgh Sleep Quality Index.
Computer use (hours)
19:00-21:00 19:00-22:00 19:00-24:00 19:00-3:00
p value
N % N % N % N %
Sleep perception
Very good 11 11.83 7 8.33 4 6.67 12 19.05 0.3552
Good 57 61.29 50 59.52 35 58.33 33 52.38 (c2)
Poor + very poor 25 26.88 27 32.14 21 35 18 28.57
Sleep latency
≤ 15 m 19 20.43 14 16.67 11 18.33 20 31.75 0.2664
16 m to 30 m 46 49.46 34 40.48 28 46.67 19 30.96 (c2)
31 m to 60 m 21 22.58 26 30.95 15 25 15 23.81
>60 m 7 7.53 10 11.90 6 10 9 14.29
Sleep duration
>7h 25 26.88 21 25 14 23.33 26 41.27 0.0904
6h to 7h 59 63.44 54 64.29 35 58.33 27 42.86 (c2)
< 6h 9 9.68 9 10.71 11 18.33 10 15.87
Sleep eiciency
>85% 78 83.87 71 84.52 49 81.67 53 84.13 0.9720
65% to 84% 15 16.13 13 15.48 11 18.33 10 15.87 (c2)
< 65% Sleep disorders
None 1 1.08 2 2.38 4 6.67 6 9.52 0.0692
Occasional 74 79.57 65 77.38 40 66.67 49 77.78 (Fisher)
Persistent 18 29.24 17 20.24 16 26.67 8 12.70
Hypnotic use
None 88 94.62 80 95.24 57 95 55 87.30 0.2534
<1-3 or more times per week 5 5.38 4 4.76 3 5 8 12.70 (Fisher)
Daytime sleepiness
None + mild 44 47.31 38 45.24 21 35 26 41.27 0.5469
Moderate 39 13 32 38.10 27 45 24 38.10 (c2)
Excessive 10 3.33 14 16.67 12 16.67 13 20.63
Classiication
Good sleepers 39 41.94 24 28.57 16 26.67 30 47.62 *0.0251
Bad sleepers 54 58.06 60 71.43 44 73.33 33 52.38 (c2)
Despite the large sample size used in this study and the valuable data pooled, causal relationships could not be fully examined here because this was a ield study among students from only one university.
In conclusion, the data on computer use between
19:00 and 21:00 or between 19:00 to 24:00 that we col-lected allowed us to conclude that computer use increases the risk of poor sleep among university students. Howev-er, perceptions of sleep relating to TV viewing during the same periods did not present the same risk.
REFERENCES
Suganuma N, Kikuchi T, Yanagi K, et al. Using electronic media before sleep 1.
can curtail sleep time and result in self-perceived insuicient sleep. Sleep Biol Rhythms 2007;5:159-165.
Mesquita G, Reimão R. Nightly use of computer by adolescents: its efects on 2.
quality of sleep. Arq Neuropsiquiatr 2007;65:428-432.
Van Den BJ. Television viewing, computer game playing, and internet use and 3.
self-reported time to bed and time out of bed in secondary-school children. Sleep 2004;27:101-104.
Higuchi S, Motohashi Y, Liu Y, et al. Efects of playing a computer game us-4.
ing a bright display on presleep physiological variables, sleep latency, slow wave and REM sleep. J Sleep Res 2005;14:267-273.
Johnson JG, Cohen P, Kasen S, et al. Association between television viewing 5.
Table 3. Comparative analysis of television viewing (hours) and perceived sleep, using the Pittsburgh Sleep Quality Index.
TV viewing
19:00-21:00 19:00-22:00 19:00-24:00 19:00-3:00
p value
N % N % N % N %
Sleep perception
Very good 10 14.29 19 8.48 12 8.96 17 14.78 0.0724
Good 40 57.14 135 60.27 77 57.46 49 42.61 (c2)
Poor 16 22.86 63 28.13 42 31.34 41 35.65
Very poor 4 5.71 7 3.13 3 2.13 8 6.96
Sleep latency
≤ 15m 15 21.43 38 15.96 27 20.15 28 24.35 0.3980
16m to 30m 30 42.86 98 43.75 57 42.54 38 33.04 (c2)
31m to 60m 14 20 64 28.57 35 2612 29 25.22
>60m 11 15.71 24 10.71 15 11.19 20 17.39
Sleep duration
>7h 18 25.71 72 32.14 42 31.34 45 39.12 0.1681
6h to 7h 46 65.71 125 55.80 72 53.73 51 44.35 (c2)
< 6h 6 8.57 27 12.05 20 3.68 19 16.52
Sleep eiciency
>85% 55 78.57 181 80.80 111 82.84 93 80.87 0.9035
65% to 84% 15 21.43 43 19.20 23 17.16 22 19.13 (c2)
Sleep disorders
None 3 4.29 6 2.68 8 5.97 11 9.57 0.1701
Occasional 51 72.86 177 79.02 104 77.61 82 71.30 (c2)
Persistent 16 22.86 41 18.30 22 16.42 22 19.13
Hypnotic use
None 65 92.86 209 93.30 127 94.78 104 90.43 0.6050
<1-3 or more times per week 5 7.14 15 6.7 7 5.22 11 9.57 (c2)
Daytime sleepiness
None 1 1.43 12 5.36 5 3.73 9 7.83 0.4095
Mild 25 5.71 91 40.63 65 48.51 46 40.40 (c2)
Moderate 31 44.29 93 41.52 49 36.57 46 40.40
Excessive 13 18.57 28 12.50 15 11.19 14 12.17
Classiication
Good sleepers 27 38.57 89 39.73 54 40.30 42 36.52 0.9303
Bad sleepers 43 61.43 135 60.27 80 59.70 73 63.48 (c2)
Total 70 100 224 100 134 100 115 100 543
Table 4. Results from multiple logistic regression analysis on sleep quality (poor sleepers versus good sleeper).
Times of computer use and non-use p=value 95% CI
19:00-21:00 vs. non-use 0.87 0.64 ; 1.67
19:00-22:00 vs. non-use 0.01 1.04 ; 3.65
19:00-24:00 vs. non-use 0.03 1.12 ; 3.33
19:00-03:00 vs. non-use 0.27 0.42 ; 1.27
and sleep problems during adolescence and early adulthood. Arch Pediatr Adolesc Med 2004;158:562-568.
Asaoka S, Fukuda K, Tsutsui Y, et al. Does television viewing cause delayed 6.
and/or irregular sleep-wake patterns? Sleep Biol Rhythms 2007;5: 23-27. Kumar K. Da sociedade pós-industrial à pós-moderna: novas teorias sobre o 7.
mundo contemporâneo. Tradução de Ruy Jungmann. Rio de Janeiro: Jorge Zahar 1997:252-258 .
Lima FO. Tecnologia e sociedade. In: Lima FO (Ed). A Sociedade digital, o im-8.
pacto da tecnologia na sociedade, na cultura, na educação e nas organiza-ções. Rio de Janeiro: Qualitymark 2000:9-35.
Guyton MD. Mecanismo comportamentais e motivacionais do cérebro: 9.
sistema límbico e o hipotálamo. In: Guyton MD (Ed). Tratado de isiologia médica. Tradução de Mira de C. Engelhardt. 9ª Ed. Rio de Janeiro: Guanaba-ra Koogan 1997: 684-692.
Marques N, Menna-Barreto L. Cronobiologia: princípios e aplicações. 3ª Ed. 10.
São Paulo: Edusp; Rio de Janeiro: Fiocruz 2003:10-204.
Czeisler CA. The effect of light on the human circadian pacemaker. Ciba 11.
Found Symp 1995;183:254-290.
Khalsa SBS, Jewett ME, Cajochen C, et al. A phase response curve to single 12.
bright light pulses in human subjects. J Physiol 2003;549:945-952. Yokoi M, Aoki K, Shimomura Y, et al. Exposure to bright light modiies HRV 13.
responses to mental tasks during nocturnal sleep deprivation. J Physiol An-thropol 2006;25:153-161.
Genzel L, Desler M, Wehrle R, et al. Slow wave sleep na REM sleep awakenings 14.
do not afect sleep dependent consolidation. Sleep 2009;32:295-301. Payne JD, Stickgold R, Swanberg K, et al. Sleep preferentially enhances mem-15.
ory for emotional components of scenes association for Scenes. Psychol Sci 2008;19:781-788.
National Sleep Foundation. Sleep in Americans poll highights key indings. 16.
Teens and Sleep [on-line] 2006 Acesso em: 20 jun 2006. Disponível em: <www.sleepfoundation.org>.
Dworak M, Schierl T, Bruns T, et al. Impact of singular excessive computer 17.
game and television exposure on sleep patterns and memory performance of school-aged children. Pediatrics 2007;120:978-985.
Buysse DJ, Reynolds CF, Monk TH, et al. The Pittsburgh Sleep Quality Index: a new 18.
instrument for psychiatric practice and research. Psychiatry Res 1989; 28:193-213. Doi Y, Minowa M, Uchiyama M, et al. Psychometric assessment of subjective 19.
sleep quality using the Japanese version of the Pittsburgh Sleep Quality In-dex (PSQI-J) in psychiatric disordered and control subjects. Psychiatry Res 2000; 97:165-172.
Buysse DJ, Reynolds CF, Monk TH, et al. Quantiication of subjective sleep 20.
quality in healthy elderly men and women using the Pittsburgh Sleep Qual-ity Index (PSQI). Sleep 1991;14:331-338.
Bertolazi NA. Tradução, adaptação cultural e validação de dois instrumen-21.
tos de avaliação do sono: Escala de Sonolência de Epworth e Índice de qual-idade do Sono de Pittsburgh. [Dissertação]. Porto Alegre: Universqual-idade Fed-eral do Rio Grande do Sul; 2008.
Conover WJ. Practical nonparametric statistics. New York: John Wiley & Sons; 22.
1971.
Li S, Jin X, Wu S, et al. The impact of media use on sleep patterns and sleep 23.
disorders among school-aged children in China. Sleep 2007;30:361-367. Kubota T, Uchiyama M, Suzuki H, et al. Efects of nocturnal bright light on sa-24.
liva melatonin, core body temperature and sleep propensity rhythms in hu-man subjects Neurosci Res 2002;42:115-122.
Van Cauter E, Sturis J, Byrne MM, et al. Demonstration of rapid light-induced 25.
advances and delays of the human circadian clock using hormonal phase markers. Am J Physiol Endocrinol Metab 1994;266:953-963.
Gordijn MC, Beersma DG, Korte HJ, et al. Efects of light exposure and sleep 26.
displacement on dim light melatonin onset. J Sleep Res 1999;8:163-174. Shanahan TL, Czeisler CA. Physiological efects of light on the human circa-27.
dian pacemaker. Semin Perinatol 2000;24:299-320.
Takahashi M, Arito H. Suppression of electroencephalogram delta power den-28.