521
EMISSIONS (TEOE): NEWBORN HEARING
SCREENING PROGRAM PROTOCOLS
Emissões otoacústicas evocadas por estímulo transiente:
protocolos de triagem auditiva neonatal
Isabela Freixo Côrtes-Andrade (1), Daniela Veronese Bento (2), Doris Ruthi Lewis (3)
(1) Phonoaudiologist; PhD Student at the Post-Graduate Stu-dies in Phonoaudiology at PUC-SP, Master’s Program Graduate Studies in Phonoaudiology at PUC-SP.
(2) Phonoaudiologist; Master student at the Program Graduate Studies in Phonoaudiology at PUC-SP.
(3) Phonoaudiologist; Professor of the Post-Graduate Program in Phonoaudiology and the Phonoaudiology course, Col-lege of PUC-SP; PhD in Public Health at USP.
Conlict of interest: non-existent
The prevalence of severe or profound sensor
neural hearing loss ranges from four to six per
1000 life births7, or one to three in 1000, according
to the Brazilian Committee on Hearing losses8,9. These indings show that in certain populations, this
percentage increases dramatically, as is the case
of children who remain in Neonatal Intensive Care Units (ICU-N), whose prevalence is 10.2%10,11.
Currently, the implementation of Universal
Neonatal Hearing Screening Programs (“Programas de Triagem Auditiva Neonatal Universal” – PTANU)
is increasingly common in all countries3. In Brazil, on August 2, 2010, it was decreed and signed into Law No. 12.1303, which mandates the realization
of evoked otoacoustic emissions in neonates, in all hospitals.
Because of this demand, programs and multi-disciplinary committees have been developed in order to discuss and recommend actions regarding
INTRODUCTION
The diagnosis of hearing loss in the irst six
months of life is a key factor to minimize the irreversible effects that sensory deprivation can result in the global development1-3. In this critical
period of neurological maturation, there is the
beginning of auditory development which occurs when a readiness for the basic perceptual abilities
and language can be acquired4-6. ABSTRACT
Purpose: to describe the results of three TEOE protocols obtained from automatic equipment used in
a Newborn Hearing Screening Program. Method: during two months, TEOEs of 287 neonates in São Paulo were studied. To register them, we used a three-protocol, set up with different pass/fail criteria. The following protocols were registered: Protocol A: to pass in four frequency bands, not necessarily
consecutive-; Protocol B: to pass in three frequency bands, not necessarily consecutive – and Protocol
C: to pass in two frequency bands, not necessarily consecutive, as well. The parameters that we used to consider these answers were: reproducibility above 50%, as well as signal/noise ratio > 3dB at 1.0 and 1.5 kHz and > 6dB at 2.0, 3.0 and 4.0 kHz. Results: TEOEs of 574 ears were analyzed and
the 2.0, 3.0 and 4.0 frequencies showed the highest pass percentages (94.1, 95.8 and 92.7% for protocols A, B and C respectively). Protocol C showed the highest pass percentage, achieving 96,9%. Nevertheless, the results obtained in Protocol B, which had the presence of three bands, showed a similar percentage to Protocol C (96,2%). Therefore, there was a not statistically signiicant difference between Protocols B and C. 1.0 kHz frequency achieved a percentage of only 9.9 in the tested ears. Conclusions: one has to research Protocols A, B and C with gold standard in order to verify which one suits best in terms of sensibility and speciicity, even though the three protocols studied showed similar results in pass criteria for two or three frequency bands.
noise levels are higher when tested frequencies are lower, making it more dificult to individuate the presence of otoacoustic emissions with spectrum below 1.5 kHz24.
Different parameters and criteria for passing/ failing are used in automatic equipment, which can modify the sensitivity and speciicity of the test
applied to a population of neonates and infants.
However it is necessary to choose safe criteria for false-positive and false-negative results which do not occur in excessive numbers or allowed
ones, thus, maintaining the reliability of this test.
In this perspective, the objective of this study was
to describe the results of three EOAET protocols,
analyzing ive EOAET frequency bands from automatic equipment used in the Neonatal Hearing
Screening Program.
METHOD
We studied the EOAET results of 287 neonates
from a public hospital in the city of São Paulo, from
April to June 2010.
The trials were conducted by students of the
Program of Postgraduate Studies in Phonoaudiology from PUC-SP (master and doctorate), and
phono-audiologists working as voluntaries. The team was divided into scales during the week to ensure the daily duty call, except Sundays, the day that the TAN is not performed.
Preferably, the trials were held near the hospital, within 48 hours of life, in a quiet room or on the bed with the baby in natural sleep. TAN was not performed in newborns with less than 24 hours of
life25.
The Newborn Hearing Screening Programme
(Programa de Triagem Auditiva Neonatal – PTAN)
used as research protocol on as otoacoustic emissions evoked by transient stimulus (TEOAE)
in neonates without Risk Indicators of Hearing
Loss (Indicadores de Risco para Deiciência
Auditiva – IRDA), and Auditory Evoked Potential
of the Automatic Auditory Brain Stem (Potencial Evocado Auditivo de Tronco Encefálico Automático – PEATE-A) to identify hearing impairment in
neonates with IRDA.
To achieve the objective of the present study it was only analyzed the passing and failing results of the TEOAE. For the record of the TEOAE it was used
the Otoport Lite equipment from the Otodynamics
company, using nonlinear click stimulus, which
occurs predominantly in the frequency range from
1.000 to 4.000 Hz, with an intensity of 64 dB pe SPL. The criterion of analysis of emissions was hearing health of newborns and infants, like the Joint
Committee of Infant Hearing (JCIH) in the USA, and
the COMUSA in Brazil12-14.
The implementation of TANU aims to identify
hearing disorders that can compromise the proper development of communicative skills of every child
at birth or, at most, up to three months old. In case of conirmation of hearing impairment, it must be held early intervention until the baby’s six months of age, as recommended by the JCIH13. Thus, the implementation of the TANU program makes sense only when the diagnosis is performed to charac -terize the hearing status, followed by appropriate
intervention to enhance the development of auditory and communication skills along development12.
Authors suggest that the realization of the
Newborn Hearing Screening using electroacoustic
and electrophysiological measures, such as otoacoustic emissions evoked by transient stimulus (Emissões Otoacústicas Evocadas por Estímulo Transiente – EOAET) and Auditory Evoked Potential of the Automatic Auditory Brain Stem (Potencial Evocado Auditivo de Tronco Encefálico Auditivo Automático – PEATE-A), as this population is unable to respond appropriately to behavioral tests due to age15-20. These two techniques have been widely applied as effective tools in the Universal Newborn Hearing Screening (Triagem Auditiva Neonatal Universal – TANU), both in developed and
in developing countries
EOAET screenings became major instruments
for detecting hearing loss of cochlear origin, as
they allow the study of the mechanical aspects of cochlear function in a non-invasive, objective, and
independent of the potential of the nerve action21, enable the obtaining of objective information, clini -cally, on the pre-neural elements of the cochlea.
This method does not quantify the hearing, but detects its presence21 due to EOAET be present in all individuals whose thresholds are better than 20 and 30dBnNA. Thus, the presence of this phenomenon can conirm cochlear integrity, and may establish the
functionality of otoacoustic activity of outer hair cells (OHC) in the cochlea. Because of these features, in addition to greater speed and reliability, this test has
the ideal proile for the PTAN22.23.
The National Institutes of Health (NIH) conducted
a survey in order to determine the characteristics
and performance of the three exams that assess
peripheral auditory system: EOAET, EOAE-PD and
PEATE. In this study, 7,179 newborns were tested for the presence of ive frequency bands (1.0, 1.5, 2.0, 3.0 and 4.0kHz). Based on these results, we
Protocols in neonatal hearing screening
523
The study was approved by the Ethics Committee from the Pontiical Catholic University of São Paulo – PUC / SP, Research Protocol No. 063/2010.The results were organized in an Excel
document, to perform the quantitative statistical analysis through the Equal Proportions test to compare results, besides the P-value.
RESULTS
The results for each frequency and for the
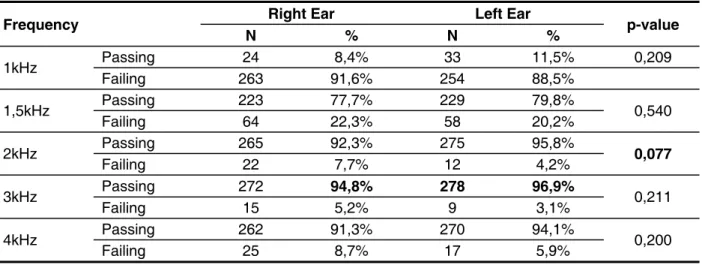
frequency bands in each ear were analyzed by the test of equality of two proportions (Table 1 and Table 2). Only on analysis of four bands it was found a small signiicant difference in the distribution of both ears. However, in all other results, ears behaved in the same way.
stimuli, the maximum test time was 300 seconds, and the frequency bands of device registers were:
1.0 1.5, 2.0, 3.0 and 4.0 kHz. The parameters used
to consider the presence of answers were: repro
-ducibility above 50%, as well as signal to noise ratio> 1.0 and that 3dB at 1.5 kHz and> 6 dB in 2.0,
3.0 and 4.0kHz.
It was researched three different protocols to enable analysis of criteria for distinct passing/failing. In addition to this possibility, it was possible to visualize the end result of passing/failing for each of the ive tested frequency bands.
Protocol A: Passing-Failing in four frequency bands;
Protocol B: Passing-Failing in three frequency bands;
Protocol C: Passing-Failing in two frequency
bands.
Frequency Right Ear Left Ear p-value
N % N %
1kHz Passing 24 8,4% 33 11,5% 0,209 Failing 263 91,6% 254 88,5%
1,5kHz Passing 223 77,7% 229 79,8% 0,540 Failing 64 22,3% 58 20,2%
2kHz Passing Failing 265 22 92,3% 7,7% 275 12 95,8% 4,2% 0,077
3kHz Passing 272 94,8% 278 96,9% 0,211 Failing 15 5,2% 9 3,1%
4kHz Passing 262 91,3% 270 94,1% 0,200 Failing 25 8,7% 17 5,9%
Table 1 – Distribution of ears for each frequency
Band Right Ear Left Ear p-value
N % N %
4 Bands Passing Failing 218 69 76,0% 24,0% 240 47 83,6% 16,4% 0,022
3 Bands Passing Failing 272 15 94,8% 5,2% 280 7 97,6% 2,4% 0,082
2 Bands Passing 275 95,8% 281 97,9% 0,151 Failing 12 4,2% 6 2,1%
Having in mind that the results of the right and
left ears did not obtain statistically signiicant differ
-ences, the sample size was doubled and so 574 ears were analyzed in order to make the study even
more reliable.
When comparing the 5 frequencies for passing
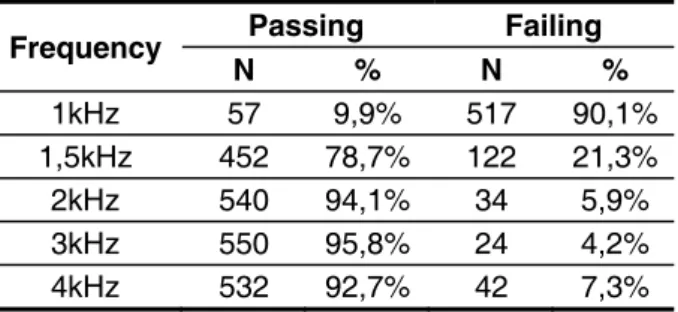
and failing responses, the equality test of two proportions was also used (Table 3 and Table 4). In Table 3, it is possible to observe the proportional distribution among all levels of response. In Table 4, however, are the p-values. Thus, it was found that the frequency with higher percentage of passing was 3 kHz with 95.8% and so the lowest failure rate was of only 4.2%. However, in the p-value analysis
(Table 4) it can be noted that this frequency cannot be considered statistically different from the 2 kHz
frequency, with 94.1% of passing and 5.9% of failing.
Table 3 – Distribution of frequencies Table 3 - Distribution of frequencies
Frequency Passing Failing N % N %
1kHz 57 9,9% 517 90,1%
1,5kHz 452 78,7% 122 21,3%
2kHz 540 94,1% 34 5,9%
3kHz 550 95,8% 24 4,2%
4kHz 532 92,7% 42 7,3%
Table 4 – P-values from table 3 Table 4 - P-values from table 3
1 kHz 1,5 kHz 2 kHz 3 kHz 1,5 kHz <0,001
2kHz <0,001 <0,001
3kHz <0,001 <0,001 0,178
4kHz <0,001 <0,001 0,342 0,022
When comparing the three protocols by which we analyzed the frequency bands for the passing/failing responses (Table 5), we found that the band with the highest percentage of passing was the one that considered two frequency bands, Protocol C, with 96.9%. However, statistically, this percentage is not considered different from the analysis of 96.2% of 3
bands Protocol B (p = 0.520) (Table 6). Therefore, both frequency bands are considered equal in the
distribution of passing/failing. However Protocol A (4 bands) obtained 79.8% of the percentage of passing, with a high failure rate (22.2%) when compared to
Frequency Bands
Passing Failing N % N %
4 Bands 458 79,8% 116 20,2%
3 Bands 552 96,2% 22 3,8%
2 Bands 556 96,9% 18 3,1%
Table 5 – Distribution of bands
4 Bands 3 Bands
3 Bands <0,001
2 Bands <0,001 0,520
Table 6 – P-values from table 5
DISCUSSION
Because there was no signiicant difference in
the statistical analysis of TEOAE to the right and left ear (Table 1 and Table 2), this study’s discussion
emphasizes, only the results in which both ears were simultaneously analyzed.
Thus, more robust response measures of TEOAE
(deined by the signal to noise ratio – SNR) were
observed for the frequencies of 3, 2 and 4 kHz, as
shown in Tables 3 and 4. These results corroborate the study which found higher levels of emissions for
the same found frequencies26.
Furthermore, it was found that the frequency with lower passing percentage was 1 kHz with 9.9%, which consequently had the highest percentage of failings with 90.1%. The high failure rate in
otoacoustic emissions (OAE) is attributed to many factors such as noisy environments and
physi-ological noise that can interfere with the recording of TEOAE, especially in the lower frequency
bands26. False-positive TAN also has been linked mainly to the effects of internal and external noise26. The internal noise is created by the own subject (coughing, swallowing, snoring, breathing), as to the external sources it may include environmental noise
and other electromagnetic interference27.
Taking into account that the maximum test time from the automatic device to record TEOE, in NASP of this study, is 300 seconds, to get results in lower frequencies it would be needed to dedicate a larger test time. Given the poor SNR and the increased
time spent in the measure, the efforts to get useful information for 1.0 kHz and 1.5 kHz, as part of a
Protocols in neonatal hearing screening
525
in four out of the ive tested bands (1.0, 1.5, 2.0,3.0 and 4.0Hz)26. Other studies did not describe the
reason for the choice, but they have a satisfactory
result of TEOAE answers present in three out of ive tested frequency bands29.30. The criteria for passing/failing used for research, whose aim was
to analyze the absolute amplitude and response level of otoacoustic emissions evoked by transient
stimulus in preterm and full-term, was the repro
-ducibility of the cochlear response of at least 70%
correlation and signal to noise ratio of 6 dB SPL at 3 frequencies, including 4kHz31.
CONCLUSION
More robust measures of TEOAE responses
(deined by the signal to noise ratio – SNR) were observed for the frequencies of 3, 2 and 4 kHz. It was found that the Protocol A (4 bands) showed a high failure rate, with 20.2%. This percentage
makes us think back to cases of false-positives, since they can lead to problems in the quality of the
program, creating unnecessary anxiety in parents,
in addition to increasing referrals of failures to retest the TEOAE and overloading responsible clinics
for hearing diagnoses. However, both protocols B (three bands; 96.2%) and C (2 bands; 96.9%) are
not considered statistically different (p = 0.520) in
the passing/failing distribution, and they can be both used as protocols for the NHS Programs.
Even though the protocols B and C have shown similar results between the passing criteria for 2
and 3 frequency bands, they should be included in
future studies, a research done along with an exami -nation considered gold standard (Auditory Evoked
Potential of the Automatic Auditory Brain Stem with click stimulus) in order to conirm the clinical appli -cability of TEOAE protocols.
These indings may contribute to the choice of protocols which bring greater sensitivity, speciicity
and safety in neonatal hearing screening and can be used in public policies implemented in Brazil recently.
It is important that the phonoaudiologists are aware of these issues and, wherever be necessary, to seek grants which denote evidence to assist in
the decision on the use of tools and instruments in their clinical practice. But for this to occur, the study centers and universities should contribute
even more strongly in the validation and extension of knowledge pertaining to the applications of the
technologies currently available in speech therapy.
results, especially when continuous or reverberating sounds are present. Thus, the noise problem at low frequencies is not completely solved with the use of control ilters27.
As the OAE signal has reduced amplitude, which usually is found between –20 and 20dBNPS the
environmental noise is usually the most important cause of problems in the evaluation of EOA28. Because of environmental noise, it is dificult to determine whether the EOA is absent for the
non-functioning of the active processes of the
cochlea or the noise level is just high23. Researchers
do not recommend including as a routine the measurements at the frequencies of 1.0 kHz and
1.5 kHz, suggesting that TANU programs use as
criteria for passing the higher frequencies29.
Furthermore, it was found that the distribution of
passing and failing by comparing the three different protocols programmed into the automatic equipment of TEOE and taking into account the distribution of frequency bands in the Protocol C analysis (2 bands), have itself rates of higher response
presence of 96.9%. However this percentage is
not considered statistically different from Protocol
B, which considered the presence of three bands (96.2%), because it showed a value of p = 0.520.
Thus, both bands can be considered similar in the
distribution of passing/failing, and they both can be used as the protocols of NHS Programs.
Protocol A, which considered the presence of 4 bands, showed 79.8% of percentage of passing, with a high failure rate, with 22.2%, the highest rate of false-positive when compared to the Protocols B (3, 8%) and C (3.1%). These indices make us
think back to cases of false positives, i.e., that have altered results due to other factors that are not related to organic onsets of the auditory system. We must avoid cases of false positives because they can lead to problems in the quality of the program,
creating unnecessary anxiety in parents16, and
increasing referrals to failure to retest the TEOAE and overloading responsible clinics for auditory diagnoses14.
The literature describes some national and inter-national studies using different criteria for passing and failing, indicating that there is still no current
consensus on what would be the best criterion for passing/failing, the phonoaudiologist should adopt
using otoacoustic emissions evoked by transient
stimulus in neonatal hearing screening. In 2000,
a study, in order to ensure the quality of neonatal
REFERENCES
1. Olusanya BO, Wirz BL, Luxon LM. Hospital-based universal newborn hearing screening for
early detection of permanent congenital hearing
loss in Lagos, Nigeria. Int J Pediatr otorhinolaryngol.
2008;72:991-1001.
2. Olusanya BO, Luxon LM, Wirz SL. Screening for early childhood hearing loss in Nigeria. J Med
Screen. 2005;12: 115-8.
3. Korver AMH, Konings S, Dekker FW, Beers
M, Wever CC, Frijns JHM et al. Newborn
Hearing Screening vs Later Hearing Screening and Developmental Outcomes in Children With
Permanent Childhood Hearing Impairment. JAMA.
2010;304(15):1701-8.
4. Yoshinaga-Itano C, Sedey AL, Coulter DK, Mehl AL. Language of Early- and Later-identiied Children
With Hearing Loss. Pediatrics. 1998;102(5):1161-71. 5. Bevilacqua MC, Formigoni GMP. Audiologia
educacional: uma opção terapêutica para a criança deiciente auditiva. Carapicuíba: Pró-Fono; 1998. 6. Carvalho LS, Cavalheiro LG. Detecção Precoce e Intervenção em Crianças Surdas Congênitas Inseridas em Escolas Especiais da Cidade de Salvador/BA. Arq. Int. Otorrinolaringol.
2009;13(2):189-94.
em unidade de terapia intensiva neonatal. Pediatria. 2005;27(3):163-71.
8. Comitê Brasileiro sobre Perdas Auditivas na Infância (CBPAI) – Recomendação 01/99 [minuta – 2ª. versão]. J Cons Fed Fonoaudiol. 2000;5:3-7. 9. Swanepoel D, Ebrahim S, Joseph A, Friedland PL. Newborn hearing screening in a South African private health care hospital. Int J Pediatr
Otorhinolaryngol. 2007;71(6):881-7.
10. Lima GML, Marba ST, Santos MF. Hearing screening in a neonatal intensive care unit. J Pediatr. 2006;82(2):110-4.
11. Lima MCMP, Rossi TRF, Françozo MFC, Marba
ST, Lima GML, Santos MFC. Detecção de perdas
auditivas em neonatos de um hospital público. Rev.
soc. bras. fonoaudiol [periódico na internet]. 2010 [acesso em 2010-10-20];15(1):1-6. Disponível em: http://www.scielo.br/pdf/rsbf/v15n1/03.pdf
12. Comitê Multiproissional em Saúde Auditiva (COMUSA). 2009. [acesso em 2010-11-]. Disponível em: http//:www.audiologiabrasil.org.br.
13. Joint Committee on Infant Hearing. Year 2007
Position Statement: principles and guideslines for early hearing detection and intervention programs. Pediatrics. 2007;120(4):898-921.
14. Mcpherson B, Li SF, Shi BX, Tang JL, Wong
BY. Neonatal hearing screening: evaluation of
tone-burst and click-evoked otoacoustic emission test criteria. Ear Hear. 2006;27:256-62.
RESUMO
Objetivo: descrever os resultados de três protocolos de EOAET de um equipamento automático uti
-lizado em um Programa de TAN. Método: o equipamento uti-lizado foi programado com três critérios diferenciados de passa/falha. Protocolo A: Passar em 4 bandas de frequência, não precisando ser consecutivas; Protocolo B: Passar em 3 bandas de frequência, não precisando ser consecutivas e Protocolo C: Passar em 2 bandas de frequência, não precisando ser consecutivas. Os parâmetros para considerar presença de respostas foram: reprodutibilidade acima de 50%, relação sinal ruído > que 3dB em 1.0 e 1.5kHz e > 6dB em 2.0, 3.0 e 4.0kHz. Resultados: 574 orelhas foram
analisa-das, sendo que as bandas de frequência de 2.0, 3.0 e 4.0kHz foram as que apresentaram percen
-tuais de “passa” mais elevados (94,1; 95,8 e 92,7%, respectivamente). A banda de frequência de 1.0kHz obteve resposta presente em apenas 9,9% das orelhas testadas. Veriicou-se que a análise do Protocolo C (2 bandas) foi a que apresentou o maior percentual de passa (96,9%). Porém este percentual não é considerado estatisticamente diferente do Protocolo B, 3 bandas, (96,2%) com valor de p=0,520. Assim, ambas as bandas são consideradas iguais, podendo-se utilizar qualquer uma das duas. Entretanto o Protocolo A (4 bandas) obteve 79,8% de percentual de passa, apresentando uma taxa de falha elevada (22,2%). Conclusões: deve-se pesquisar, com o padrão-ouro, todos os protocolos para veriicação daquele com melhor sensibilidade e especiicidade, apesar de terem apre
-sentado resultados similares entre critérios de passa para 2 ou 3 bandas de frequência.
Protocols in neonatal hearing screening
527
24. NIH – National Institutes of Health. Consensus Statement – Early identiication of hearing loss ininfants and young children: Consensus development
conference on early identiication of hearing loss in infants and young children. NIH. 1993; 11(1):1-3.
25. Sadri M, Thornton AR, Kennedy CR. Effects of
maturation on parameters used for pass/fail criteria
in neonatal hearing screening programmes using
evoked otoacoustic emissions. Audiol Neurootol.
2007;12(4):226-33.
26. Norton SJ, Gorga MP, Widen JE, Folsom RC, Sininger Y, Cone-Wesson B, et al. Identiication
of neonatal hearing impairment: evaluation of transient evoked otoacoustic emission, distortion product otoacoustic emission, and auditory brain stem response test performance. Ear Hear. 2000; 21:508-28.
27. Popelka GR, Karzon RK, Clary RA. Identiication of noise sources that inluence distortion product
otoacoustic emis sion measurements in human neonates. Ear Hear. 1998;19:319-28.
28. Lopes Fo O, Carlos RC. Emissões Otoacústicas.
In: Lopes Fo. O. (ed.) Tratado de Fonoaudiologia. 2ª.ed. São Paulo: Tecmedd; 2005. Cap.10.
29. Vohr BR, White KR, Brancia Maxon A,
Johnson MJ. Factors affecting the interpretation of transient-evoked otoacousticm emission results in neonatal hearing screening. Semin Hear. 1993; 14:57-72.
30. Brass D, Watkins P, Kemp DT. Assessment
of an implementation of a narrow band, neonatal
otoacoustic emission screening method. Ear Hear. 1994; 15:467-75.
31. Melo ADPM, Alvarenga KF, Modolo DJ, Bevilacqua MC, Lopes AC, Agostinho-Pesse RS. Emissões otoacústicas evocadas transientes em
recém-nascidos a termo e pré-termo. Rev. CEFAC [periódico na internet]. 2010 Feb [acesso em 2011-02-23];12(1):115-121. Disponível em: http:// www.scielo.br/pdf/rcefac/v12n1/a15v12n1.pdf of how many infants with permanent hearing loss
pass a two-stage otoacoustic emissions/automated auditory brainstem response newborn hearing
screening protocol. Pediatrics. 2005;116(3):663-72. 16. Lin HC, Shu MT, Lee KS, Ho GM, Fu TY, Bruna S, et al. Comparison of hearing screening programs
between one step with transient evoked otoacoustic emissions (TEOAE) and two steps with TEOAE
and automated audtoty brainstem response. Laryngoscope. 2005;115(11):1957-62.
17. Lin HC, Shu MT, Lee KS, Lin HY, Lin G.
Reducing falser positives in newborn hearing screening program:how and why. Otol Neurotol.
2007;28(6):788-92.
18. Tiensoli LO, Goulart LMH F, Resende LM, Colosino EA. Triagem auditiva em hospital público
de Belo Horizonte, Minas Gerais, Brasil: deiciência
auditiva e seus fatores de risco em neonatos e lactentes. Cad Saúde Pública. 2007;23(6):1431-41.
19. Benito-Orejas JI, Ramirez B, Morais D, Almaraz A, Fernández-Calvo JL. Comaprasion of two-step
transient evoked otoacoustic emissions (TEOAE) and automated auditory brainstem response (AABR)
for universal newborn hearing screening programs. Int J Pediatr Otorhinolaryngol. 2008;72(8):1193-201.
20. Granell J, Gavilanes J, Herrero J, Sánches-Jara
JL, Velasco MJ, Martin G. Is universal newborn hearing screening more eficient with auditory evoked
potentials compared to otoacoustic emissions? Acta Otorrinolaringol Esp. 2008;59(4):170-5.
21. Kemp DT, Bray P, Alexander L, Brown AM.
Acoustic Emission Cochleography: Pratical aspects. Scand Audiol Suppl. 1986;25:71-95.
22. Probst R. Otoacoustic Emissions: An Overview.
Adv Otorhinolgyngol, Basel, Karger. 1990;44:1-91. 23. Pialarissi PR, Gattaz G. Emissões otoacústicas:
conceitos básicos e aplicações clínicas. Rev Arquivos da Fundação Otorrinolaringologia.
1997;1(2):13-6.
http://dx.doi.org/10.1590/S1516-18462012005000062
Received on: March 28, 2011 Accepted on: July 28, 2011
Mailing Address:
Isabela Freixo Côrtes de Andrade
Avenida Engenheiro Martins Romeo, 103/ 802 Ingá – Niterói – RJ
CEP: 24210-400